The season is still young, but there aren’t many surprises among the top names of the pitching ERA leaderboard. The usual names such as Jacob deGrom, Gerrit Cole, and Max Scherzer are all rightfully there, among a handful of young pitchers who appear to have taken the next step forward — Corbin Burnes and Joe Musgrove as examples, and the rest of the league’s aces are all well-represented at the top of the leaderboard.
One surprise, though, in the early part of the year who has received little fanfare is Aaron Sanchez, who is sitting pretty with a 1.83 ERA through his first four starts with the San Francisco Giants. While Sanchez probably won’t be that far up there by the end of the season, it is still impressive for him to be there in the early going considering the circumstances. Sanchez, of course, had his 2019 season end prematurely with a shoulder injury and didn’t pitch for a major league team in 2020, and was still unsigned for 2021 until mid-February. Sanchez may never return to being the pitcher he was in 2016 with the Toronto Blue Jays, in which he had a 3.00 ERA and received some Cy Young consideration, but it is still good to see him back on the mound, and for the moment, pitching well.
I say “for the moment,” because while Sanchez’s comeback has been a nice story in the early portion of the season, not everything is going perfectly for the 28-year-old. There are some things that look good and that should be viewed positively, but at the same time, Sanchez’s profile elsewhere is a bit mixed, which may make it difficult for him to be successful long-term unless some other changes are made. Let’s take a look into Sanchez’s profile this year and see how he is making it work but also to see where the red flags are that may cause him some trouble down the road.
Fastball Velocity
Considering the type of injury Sanchez is coming back from, it makes sense to start things off by looking at his fastball velocity. Part of what got some excited about him coming into the season was that his fastball velocity looked quite strong at a winter showcase:
Free Agent SP Aaron Sanchez’s Instagram story posted earlier today. He was hitting 95-98 🔥#MLBHotStove #MLBFreeAgency #AaronSanchez #MLB2021 pic.twitter.com/4yxY7ZootN
— Julian Guilarte (@JulianGuilarte1) February 13, 2021
That winter showcase showed his fastball pumping in the upper 90s, which will always get people’s attention. Of course, the tweet shows a four-second clip of one pitch in which Sanchez is wearing shorts and a tank top — not exactly Major League conditions. A showcase is meant to be at max effort and intensity, as a pitcher is just going to throw maybe 20 or 30 pitches, so it shouldn’t fully be taken at face value. Sanchez’s two fastballs (sinker and four-seamer) averaged around 94 mph before the injury, so the upper 90s in the showcase was always meant to look more exciting than it is, but perhaps the expectation was there that Sanchez would be able to at least match or come close to his pre-injury days.
Coming back from as severe an injury as Sanchez’s was, it probably shouldn’t have been expected for him to come back to full velocity right away as he works through a lineup multiple times. However, at the start of the year, his fastball velocity has been a bit underwhelming, and even a little concerning. Here is a look at the average and maximum velocities of his two fastballs in each of his four starts this season:
| Date | AVG SI Velocity | Max SI Velocity | AVG FF Velocity | Max FF Velocity |
|---|---|---|---|---|
| 4/6/2021 | 90.9 | 92.8 | 89.9 | 91.9 |
| 4/12/2021 | 91.3 | 92.7 | 91.0 | 92.9 |
| 4/17/2021 | 88.8 | 90.7 | 90.0 | 91.0 |
| 4/22/2021 | 87.8 | 89.5 | 86.7 | 89.8 |
While each start so far hasn’t been up to par with where he was in 2019, the first two starts definitely look better than the two most recent ones. Things really looked to have bottomed out in his most recent start on April 22 against the Marlins, as he didn’t crack 90 mph at all, and down a full tick in terms of sinker velocity from his previous start on April 17. It’s sort of a slight miracle that he was able to pitch five shutout innings in that one. He was able to make it work, or maybe the struggling Marlins offense helped him out, as every single batted ball off the sinker in that one was hit on the ground. That’s an efficient 100% groundball rate, and that has been a big part of Sanchez’s success this year, as his groundball rate has spiked tremendously this year — both with the sinker on its own, and overall:
| Season | SI GB% | Overall GB% |
|---|---|---|
| 2016 | 58.5 | 55.3 |
| 2017 | 58.3 | 48.4 |
| 2018 | 54.0 | 50.5 |
| 2019 | 54.6 | 48.3 |
| 2021 | 61.9 | 61.0 |
It is good to see a sinker doing what it’s supposed to do in generating a ton of grounders, and Sanchez has definitely been relying on an elevated rate of ground balls this season. The BABIP on his sinkers this year is just .250, and the Giants as a whole do have one of the better defenses in the league, so it seems like relying on groundballs can be a good strategy for Sanchez to lean on and have work, I’m just not entirely sure it’s one that can be sustainable for him once we get in further to his sinker.
Slow In, Fast Out
As we now know, one way Sanchez has been able to have success despite lowered velocity is with a higher rate of ground balls. That seems sound on the surface, but I’m not exactly sure if Sanchez can continue to bank on such a high groundball rate in the future.
One thing that hasn’t been mentioned yet is Sanchez’s control. In the past, Sanchez has had some pretty elevated walk rates (11.2% the last time we saw him in 2019, for instance). His walk rate has actually been much improved thus far this year, at just five percent. While I doubt he’ll have such a low walk rate for the remainder of the year, there are some reasons why that has come down. He’s working in the zone a bit more (49.8% — his highest rate since 2016), but he’s especially working in the zone more with his sinker:
| Season | SI Zone% |
|---|---|
| 2016 | 57.0 |
| 2017 | 53.3 |
| 2018 | 50.8 |
| 2019 | 53.4 |
| 2021 | 60.5 |
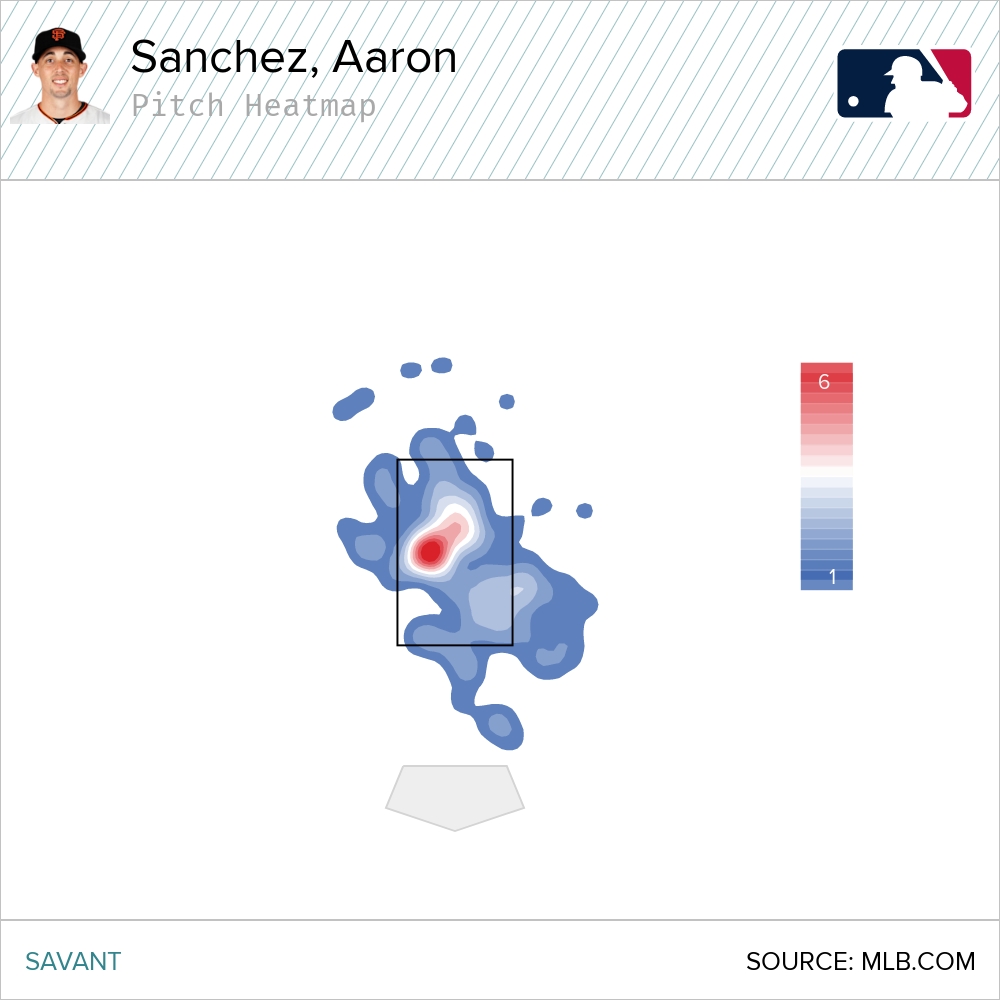
Sanchez is throwing his sinker in the zone more often than ever so far this year, even more than in his standout 2016 season. That’s a good way to help out your walk rate, but when looking at the pitch’s heat map, Sanchez may actually be living too much in the zone, as this looks a bit scary:

That looks like a lot of low-velocity sinkers in the middle of the plate, which usually isn’t a place a sinker-baller pitcher wants to live. In fact, we can quantify this and look at the pitchers with the highest rate of sinkers left in the heart of the zone (essentially the centermost points of the strike zone). There are only three other pitchers this year that have thrown sinkers in the heart of the zone at a higher rate than Sanchez has to start the season:
| Player | Heart SI | Total SI | Heart SI% |
|---|---|---|---|
| David Price | 25 | 55 | 45.5 |
| Anthony DeSclafani | 32 | 79 | 40.5 |
| Sandy Alcantara | 47 | 116 | 40.5 |
| Aaron Sanchez | 33 | 86 | 38.4 |
| David Peterson | 36 | 94 | 38.3 |
Now, it wouldn’t be so bad if hitters were making soft contact on the pitch, but that isn’t the case when it comes to Sanchez’s sinker as the pitch gets hit pretty hard:
| AVG EV | Hard-Hit% | xSLG | xwOBA | xwOBACON |
|---|---|---|---|---|
| 91.4 | 47.6 | 0.506 | 0.331 | 0.382 |
The sample size is still small, but this doesn’t seem all that surprising considering what we already know — his sinker is low velocity and left in the heart of the zone too much. Right now, Sanchez is getting away with it with such a high number of those hard-hit balls ending up on the ground, but I would expect more of those hard-hit balls to start finding the air eventually, especially if hitters keep getting them in the middle of the zone, which certainly has the potential to ruin some of Sanchez’s starts. He could maybe get away with this at his elevated velocity from prior years, but it’s probably less likely at his current 90-mile-per-hour average velocity.
Pivot to the Curve
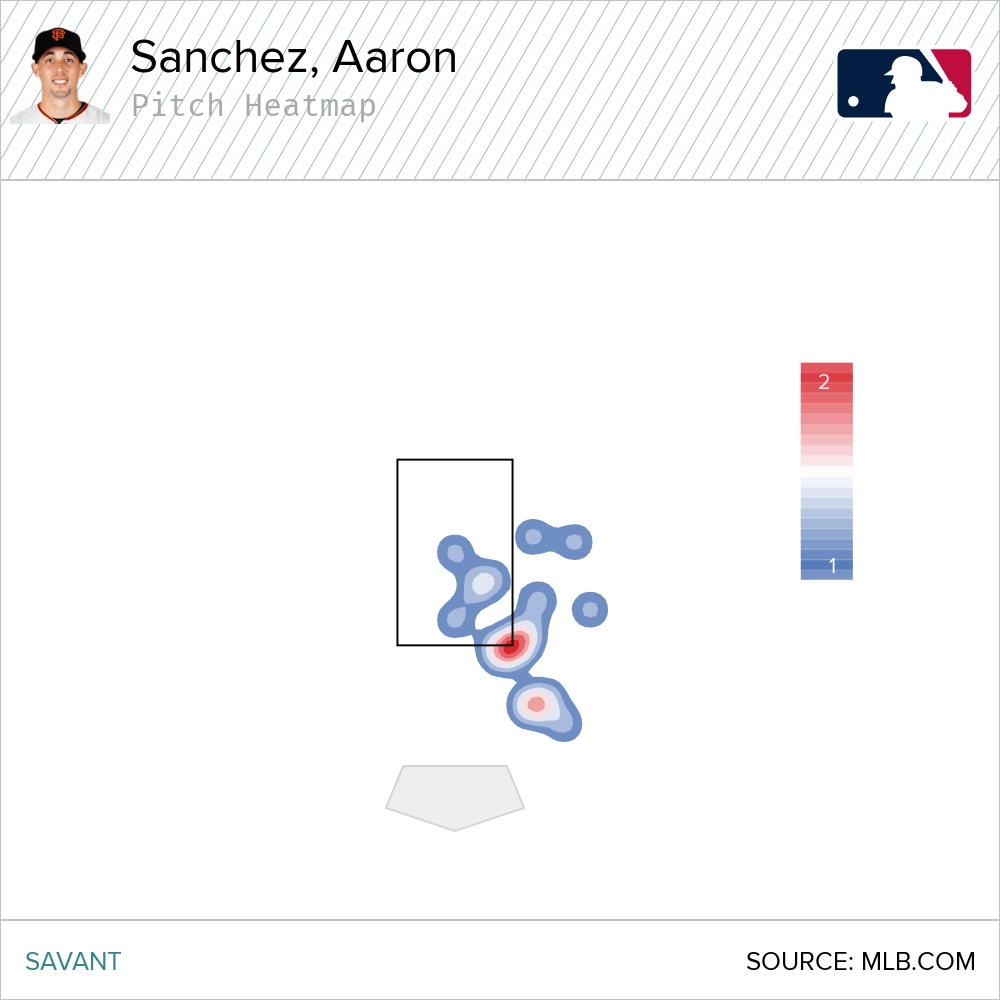
Probably the biggest way Sanchez has made things work and skirted around lower fastball velocity this year has been through his curveball. He’s throwing it more than ever at a 32.2% rate — almost ten percent higher than in 2019, and it’s actually his most-used pitch right now. While Sanchez doesn’t get whiffs at a super high rate compared to other pitchers, when he does get whiffs, it is usually through the curveball. The pitch has a 37% whiff rate and an 18.3% swinging-strike rate, the latter of which is actually one of the top rates among starting pitchers to this point, which is quite good to see. He’s getting whiffs with the pitch exactly where you would want and expect them to come from — down in the zone:

Locating that pitch consistently in that spot will definitely make things tough for hitters. Anecdotally, it is kind of fun to see hitters whiff on the pitch, as it’s not every day you see a hitter flail against a pitch that averages just 74 mph. Here are a few of the better ones from this season:
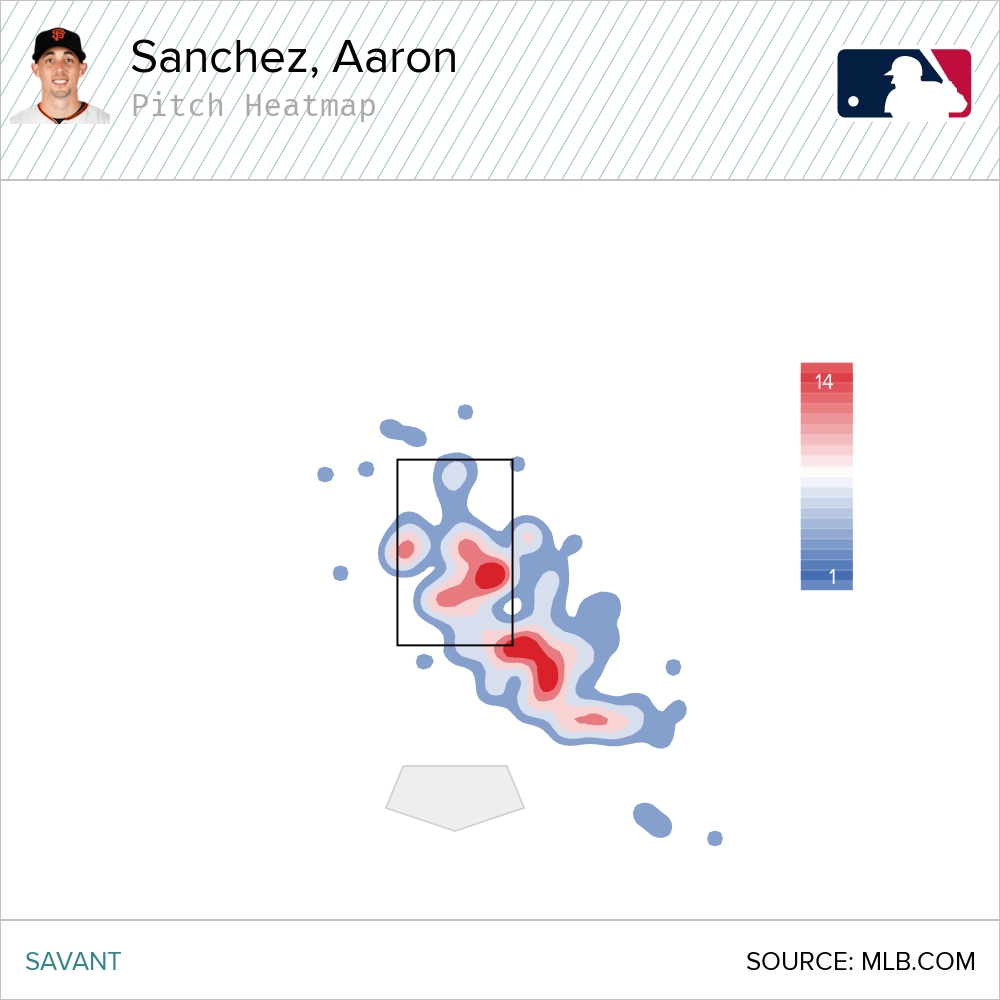
In this aspect, it looks like the curveball is doing a lot of good, and it is. It has definitely been his best pitch this year, which is why he keeps turning to it at such a high rate. However, as was the case with the sinker, there are still some red flags with the pitch. Again, it looks like it comes back to pitch location. We know that Sanchez is getting whiffs with the pitch low in the zone — exactly where they should be — but when looking at the heatmap of his curveball, there again looks to be too many of them ending up in the middle of the zone, which is not unlike his sinker heat map shown earlier:

It’s not as extreme as the sinker heat map, as we see that Sanchez is also getting a good amount of curveballs down in the zone where they should be, but Sanchez is maybe treading a bit on thin ice with curveball locations like this, as it is generally not a good idea to leave so many hanging curveballs in the middle of the plate. He’s gotten away with it so far as the pitch does have a 66.7% ground ball rate — even higher than the sinker — but that maybe shouldn’t be expected to stick if he keeps locating too many of them higher up in the zone.
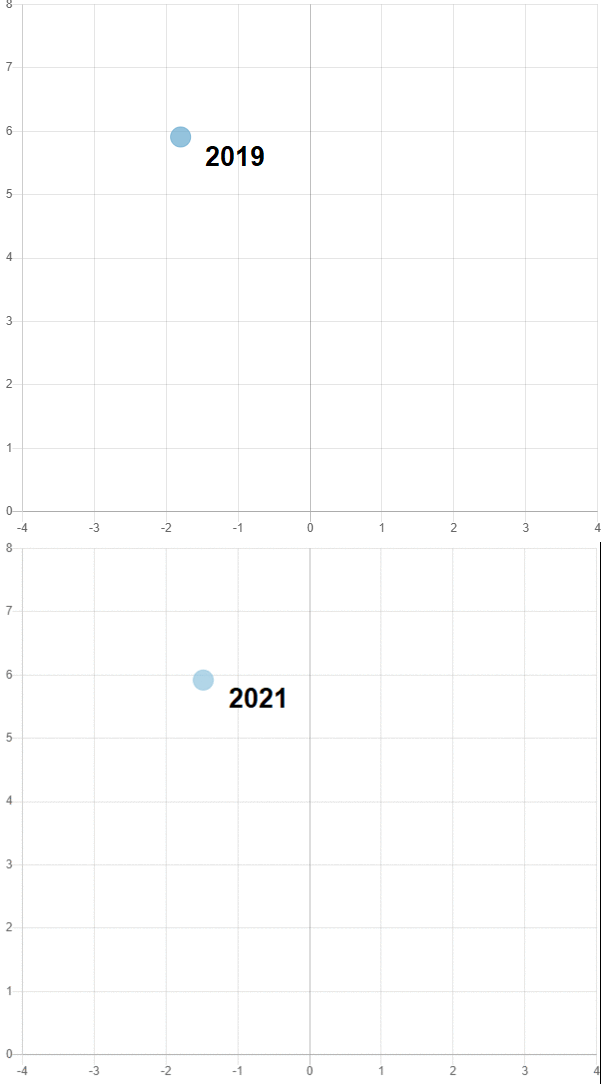
Additionally, while the curveball is moving a similar amount this year as it did in 2019, there may be some weird things happening with Sanchez’s release point. When looking at Sanchez’s release point on the curveball in 2019 and then comparing it to 2021, it does look different:

It is a bit of a subtle difference, but this is potentially a reason why Sanchez has seen more of his curveballs hang up in the zone this season, as while the pitch is moving similarly this year as opposed to 2019 in terms of total inches of drop and break. Compared to other pitchers with a similar release point and extension, the pitch is actually moving less compared to the average:
| Season | Inches of Drop | % vs AVG | Inches of Break | % vs AVG |
|---|---|---|---|---|
| 2019 | 59.1 | 7 | 14.8 | 49 |
| 2021 | 62.5 | 0 | 14.9 | 20 |
We see that where Sanchez was a little better than average in terms of curveball drop and 49% better than average in terms of break in 2019, those numbers have dropped off considerably in 2021, which may be due to the change in release point. The same type of pitch movement Sanchez has may not be working in the same way at the release point he has in 2021, and a result of that different release point may be an explanation for why more of his curveballs are landing up in the zone. So far, hitters are hitting these into the ground, but they perhaps shouldn’t be expected to keep hitting them into the ground and less ideal results on the pitch may be on the horizon. For the moment though, Sanchez has a good formula going with the curveball and making it work with a high ground ball rate and a good amount of whiffs when the pitch is located at the bottom of the zone, however, it may not last long term.
Conclusion
Sanchez has had success this year, which is good to see considering the type of injury he is coming back from and the type of pitcher he was at his peak. However, I’m not so sure this is a profile that is sustainable for the rest of the year when factoring some of the underlying issues in his profile: the lower velocity, the location of his two primary pitches, the fact that his sinker gets hit hard, and the different movement profile of his curveball from his current release point — which can impact the pitch’s location.
Tracking the location of his sinker and curveball may be a key indicator of future success. If he keeps locating too many of them in the middle of the plate, things may get rough for Sanchez. Hitters shouldn’t be expected to keep hitting pitches in the heart of the plate on the ground, and Sanchez maybe shouldn’t expect similar results in the current state, considering the red flags in his profile.
Sanchez has been a good story so far this year. It is fun to see him towards the top of the early pitching leaderboards and sort of calling back to his 2016 dominance. He’s making it work for now and while it probably won’t last for the whole season, maybe he can keep it going a bit longer.
Photos by Julian Avram/Icon Sportswire | Design by Michael Packard (@designsbypack on Twitter @ IG)


Great article, Matt. I’m curious- where do you draw your data from and is there a centralized place I can go to track pitch velocities/location?
Thanks for the insight.
Hey Matt, glad you enjoyed it. All of the stats in this post came from Baseball Savant. To track location in the future, I would take a look at his game logs and then look at the heat maps from each start of each pitch type to see if there’s anything different.