It’s not too early for the annual Mike Trout early adjustment article, is it? Nahhhhh! The 60-game season has me desensitized me to sample sizes, anyway. While we wait for the Angels’ schedule to resume after a scrapped series with the Twins thanks to their bout with Covid-19 (a necessary reminder that we are still in a pandemic and that MLB’s cluelessness and recklessness should eventually be taken to task), let’s see what the Millville Meteor is up to in this early part of the new campaign.
There’s been a whole lot of talk in the past year about whether 2020 or 2021 would be the season that Trout finally passes on the mantle of the undisputed best player in the world, after a nearly decade-long unchallenged run at the top. Coming off career-worsts with a 162 wRC+ and fifth-place finish in MVP voting (quite a shock to the system), it seemed like a real possibility that the time was nigh.
I think he heard us. How silly of us to entertain the thought. As we must do with any Trout article, let’s take a moment to appreciate what we’ve had the fortune to witness since 2012. Some players have been almost as good while being a lot cooler, but nobody’s ever put together his combination of consistency and across-the-board contribution in just about every category imaginable. Baseball Savant is really useful (if sometimes misleading) for helping us visualize being really good or really bad, and I doubt you’ll find anything else on the site quite like this:
I mean, come on.
So what’s there to write about? The beautiful thing about Trout is that his consistency isn’t because he’s consistent. The opposite, actually. Trout makes adjustments every year, as evidenced by the subtle (or stark!) changes in his game we can see in his stats throughout his career. Whenever pitchers find a hole, he finds a way to close it.
Writing about Trout is easy for the same reason he’s probably the greatest of all time. He’s always changing; always adjusting. So let’s get cracking. It’s still early early early (eee), but we’re creeping towards some stabilization points, so let’s take a look at the best player seen by anyone born after 1995 or so and see what we find.
The first step (for me) in looking for a player making a change is to actually watch the hitter’s swing, but you also need to know what you’re looking for sometimes. So we’ll get to that in a minute. Regardless, he’s been tearing the cover off the ball to start this year. Like I said, I think he heard all the chatter this past week. Entering year ten, Trout’s early production has been better than ever, both filling up the traditional box score and placing in the upper echelons of nearly every Statcast metric, too:
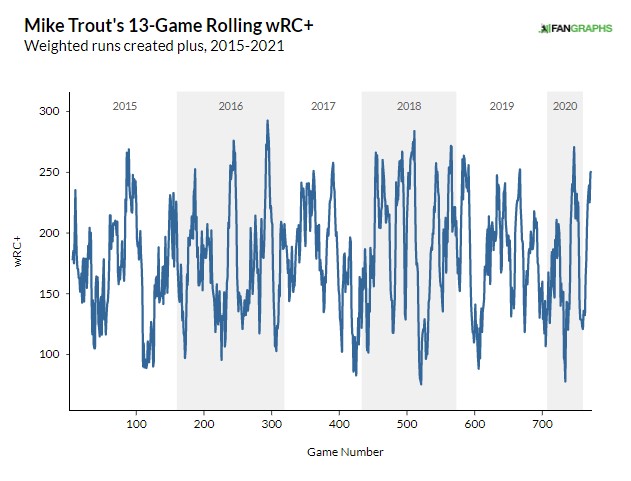
Vintage Trout, up until last year, at least. Because this is a Going Deep article and it would be a disservice to Scott Chu to write an article about a 13-game stretch to open a season without including some rolling graphs. I’ve got a few of those for ya—let’s see how this current hot streak compares to some of his peaks in the past:
Again, pretty vintage. A classic Trout upswing. But the entire point of the first few paragraphs was that in spite of the fact that Trout does this routinely, he never does it quite the same way on a year-to-year basis. Let’s start to dig a little deeper by looking at his plate discipline:
| Season | Chase% | Zone-Swing% | Swing% | Chase Contact% | Zone-Contact% | Contact% | Zone% | F-Swing% |
|---|---|---|---|---|---|---|---|---|
| 2015 | 21.6% | 53.4% | 38.1% | 61.7% | 86.9% | 80.1% | 52.0% | 10.3% |
| 2016 | 20.8% | 57.4% | 38.7% | 67.0% | 86.8% | 81.4% | 48.9% | 17.2% |
| 2017 | 18.1% | 56.9% | 37.7% | 68.9% | 87.7% | 83.3% | 50.5% | 19.3% |
| 2018 | 17.3% | 57.0% | 37.5% | 60.0% | 90.8% | 83.8% | 50.9% | 17.6% |
| 2019 | 16.8% | 57.2% | 36.7% | 61.0% | 88.7% | 82.3% | 49.4% | 15.5% |
| 2020 | 14.2% | 55.8% | 36.7% | 58.2% | 87.3% | 82.1% | 54.0% | 14.9% |
| 2021 | 18.4% | 61.9% | 38.3% | 47.8% | 81.5% | 72.7% | 45.7% | 24.6% |
On the surface, we don’t see too many drastic changes to his approach. He appears to have taken FanGraphs’ Tony Wolfe’s advice and started swinging a little more, especially on the first pitch, but nothing crazy. He’s also chasing a touch more than usual, but again, nothing out of the ordinary.
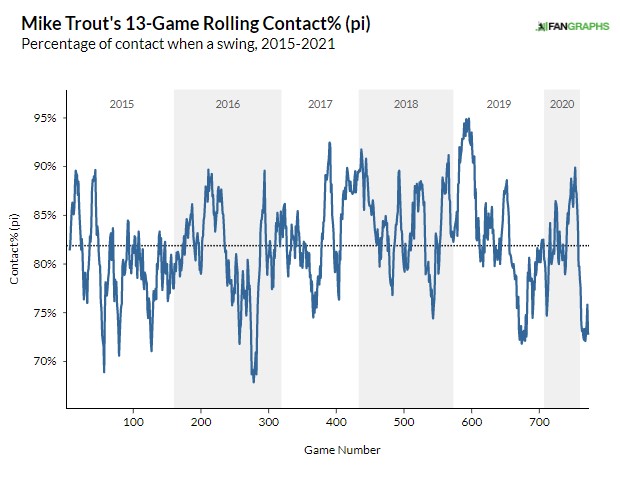
But then there are a couple of changes that for most players might look like red flags. Trout’s contact rate has been remarkably consistent throughout his career, but he’s suddenly whiffing a lot more than that. Is this something we should be worried about? Back to the rolling graphs we go!
Don’t worry. Be happy. Once again, nothing is actually out of the ordinary—I just happened to get a snapshot of what one of his usual “cold” streaks looks like, as far as contact goes.
Let’s take a moment of silence for the pitchers of the American League once he starts making more contact again if this is what he does at the low end of the spectrum. anyway, look some more at his batted ball profile and see if we can find anything new:
| Season | GB % | FB % | LD % | PU % | Pull % | Straight % | Oppo % |
|---|---|---|---|---|---|---|---|
| 2015 | 37.9 | 20.9 | 37.2 | 4 | 35.1 | 35.5 | 29.4 |
| 2016 | 42.2 | 25.4 | 29 | 3.4 | 37.9 | 36.2 | 25.9 |
| 2017 | 37.7 | 29.1 | 23.4 | 9.8 | 37 | 39.2 | 23.7 |
| 2018 | 31.3 | 33.3 | 28.2 | 7.1 | 39 | 37.9 | 22.8 |
| 2019 | 25.4 | 36.2 | 29.4 | 9 | 41.5 | 34.7 | 23.7 |
| 2020 | 25.9 | 34.7 | 29.9 | 9.5 | 34.7 | 36.7 | 28.6 |
| 2021 | 35.7 | 32.1 | 28.6 | 3.6 | 53.6 | 35.7 | 10.7 |
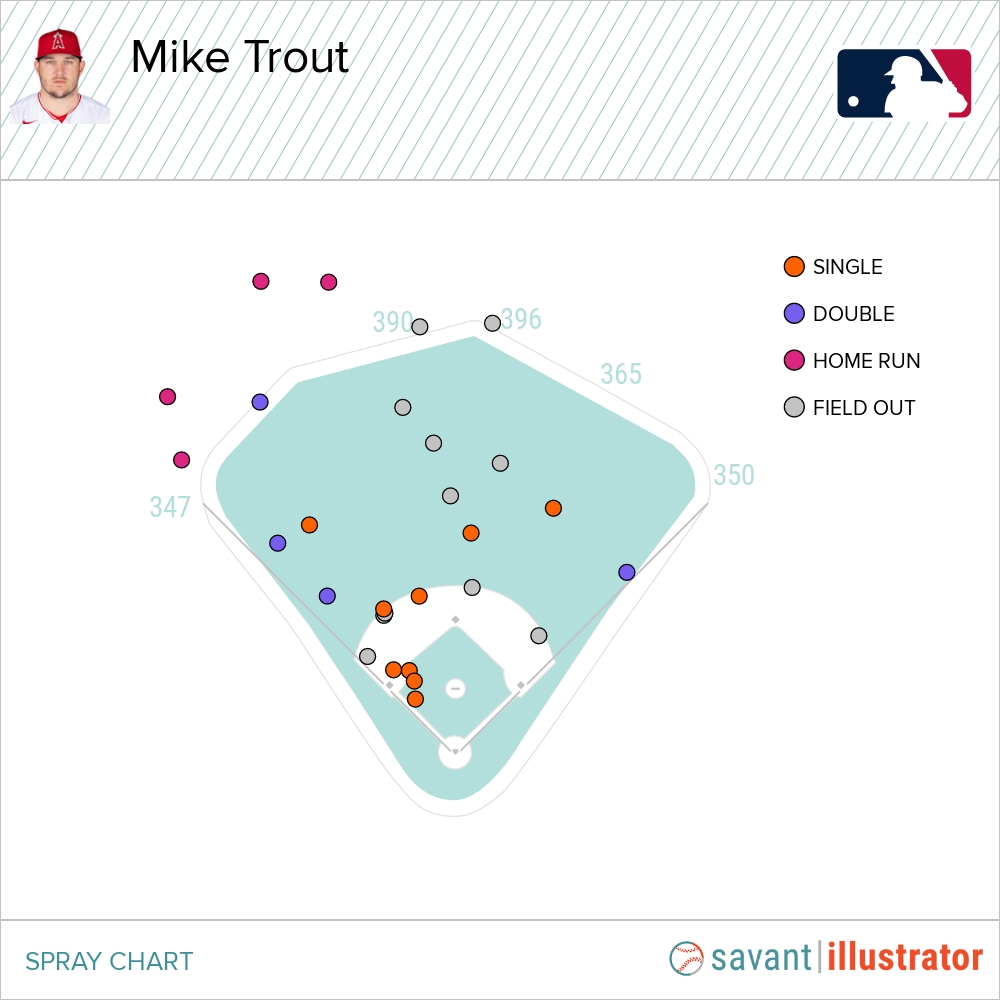
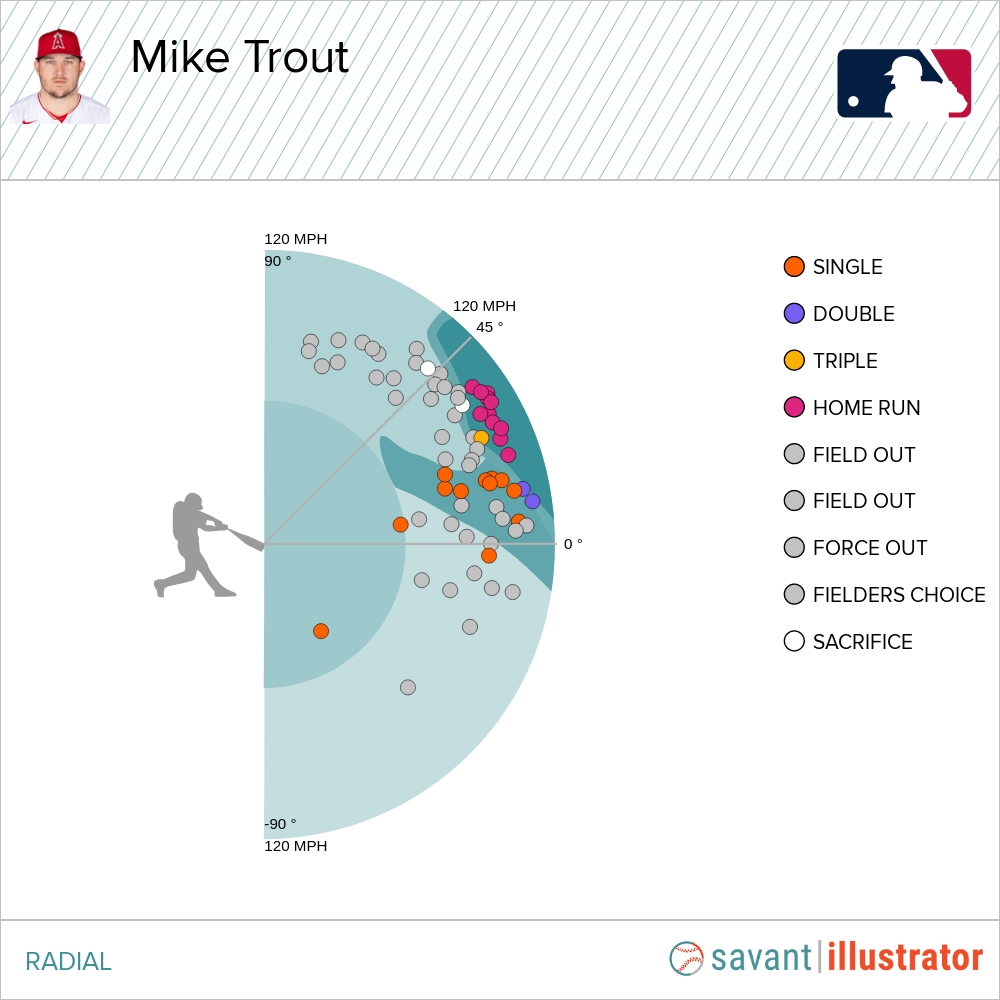
Ooh, now that’s a little more interesting! No worries if the numbers don’t spell it all out clearly—we can see the effect just by visualizing his batted balls:
Trout is pulling the everloving heck out of the ball, and he’s also putting it on the ground more than ever. That’s partially related to the steep drop in average launch angle (which is a terrible stat) you can see in his Statcast metrics up top, but I’ll get back to that shortly.
What (if anything) is most notable, in my opinion, is the drop in opposite-field hitting. Pull rate has traditionally been one of analysts’ early go-to indicators of a significant swing or approach change. (As much as “since 2015 can be considered a tradition, at least.) What’s interesting about Trout’s increase in pull is that his Straight% is essentially unchanged, meaning that almost all of his newly pulled balls are coming at the expense of ones he used to take the other way.
In some circumstances, this might be a clue that there’s a significant change happening. Similar to line drive rate, Straight% is a lot more prone to randomness and inconsistency than its pull and oppo counterparts. If big changes in the latter two are happening as a function of Straight%, they’re probably not as sticky as we’d like, unless there’s visible evidence of a mechanical change.
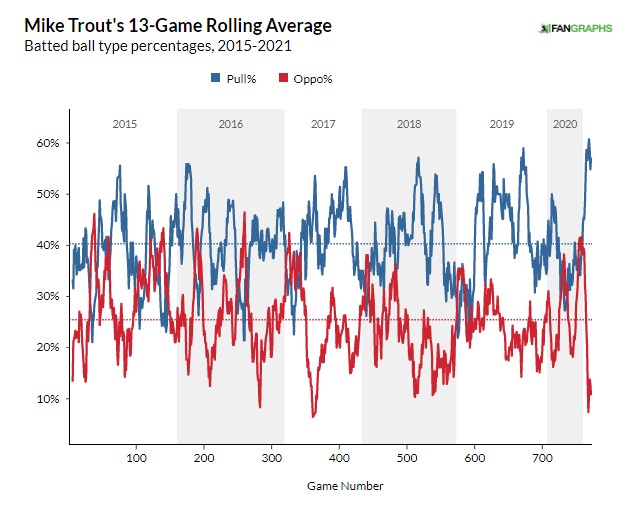
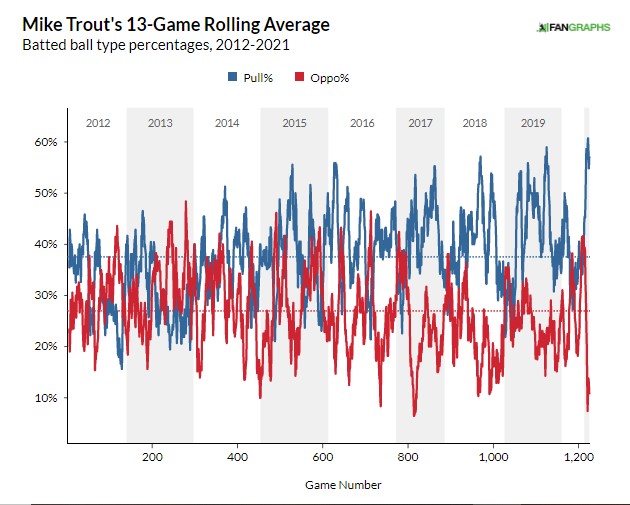
As a result, it’s worth noting that in Trout’s case, he’s not seeing a wild swing in balls up the middle, but borrowing from batted balls that were going opposite field in the past. And unlike the statistical extremes we’ve looked at so far, this isn’t something that’s been super typical for Trout in the past:
When we look at where those red and blue lines end up in the present, they’re in a place that they haven’t been in much before, if at all. Trout has certainly gone through stretches where he pulls it a lot, but he’s very rarely ever done it to this extent, even in as tiny of a sample size as what we have this season. And that’s just since 2015—if we take it back to his rookie campaign, this is an even more extreme iteration of Trout compared to his overall body of work:
Combined with that spike in whiffs, one might be led to conclude that Trout is simply selling out for more pull-side power. That’s one of several possible explanations, though it doesn’t line up very logically with the “struggles” he went through last season.
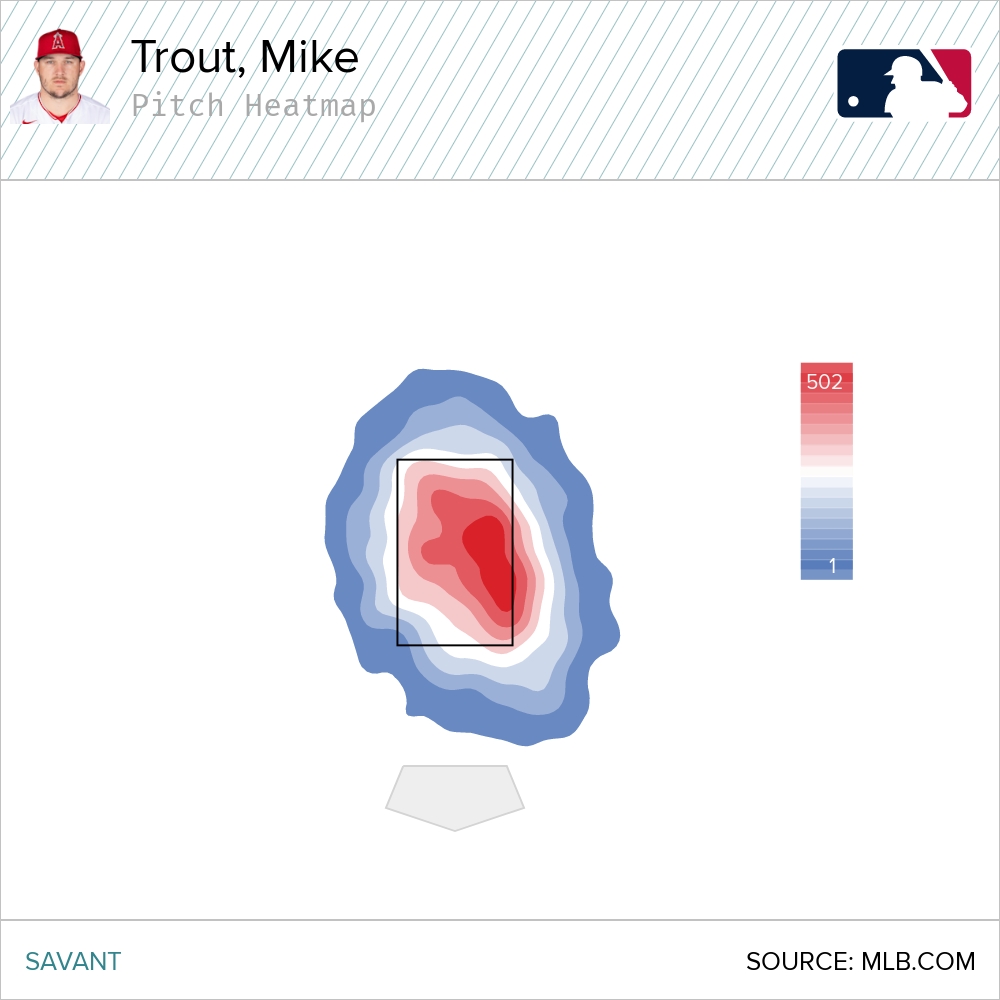
I think it’s also very possible that Trout is just taking what pitchers are offering him. Looking at pitch locations tells us that even though the mix he’s seeing is virtually the same, pitchers have been attacking him down the middle and in much more frequently than in the past. Here’s a map of where pitches went to Trout between 2018 and 2020:
The darkest red on that map straddles the outer edge of the plate, which follows conventional wisdom as far as how one would want to pitch to Trout: stay away, throw a ball if you have to, just don’t give him something he can turn on and drive in the gap over the fence.
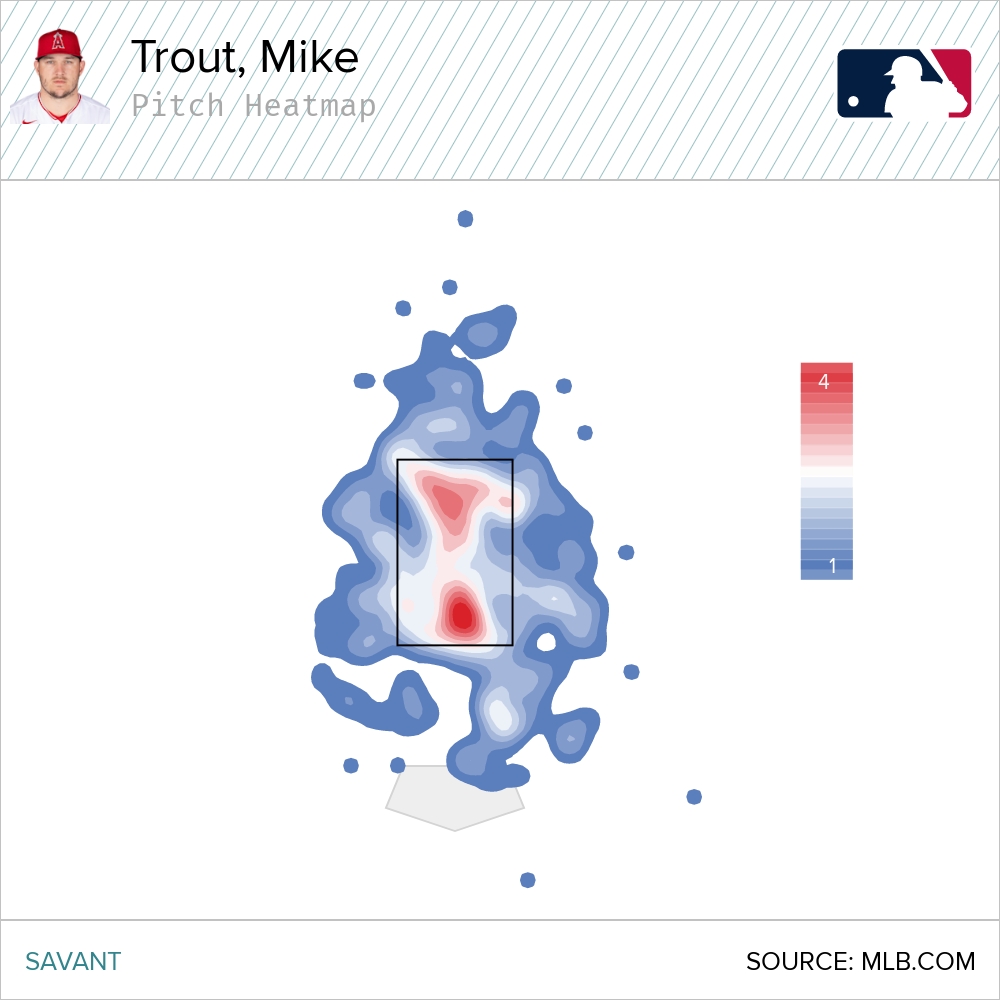
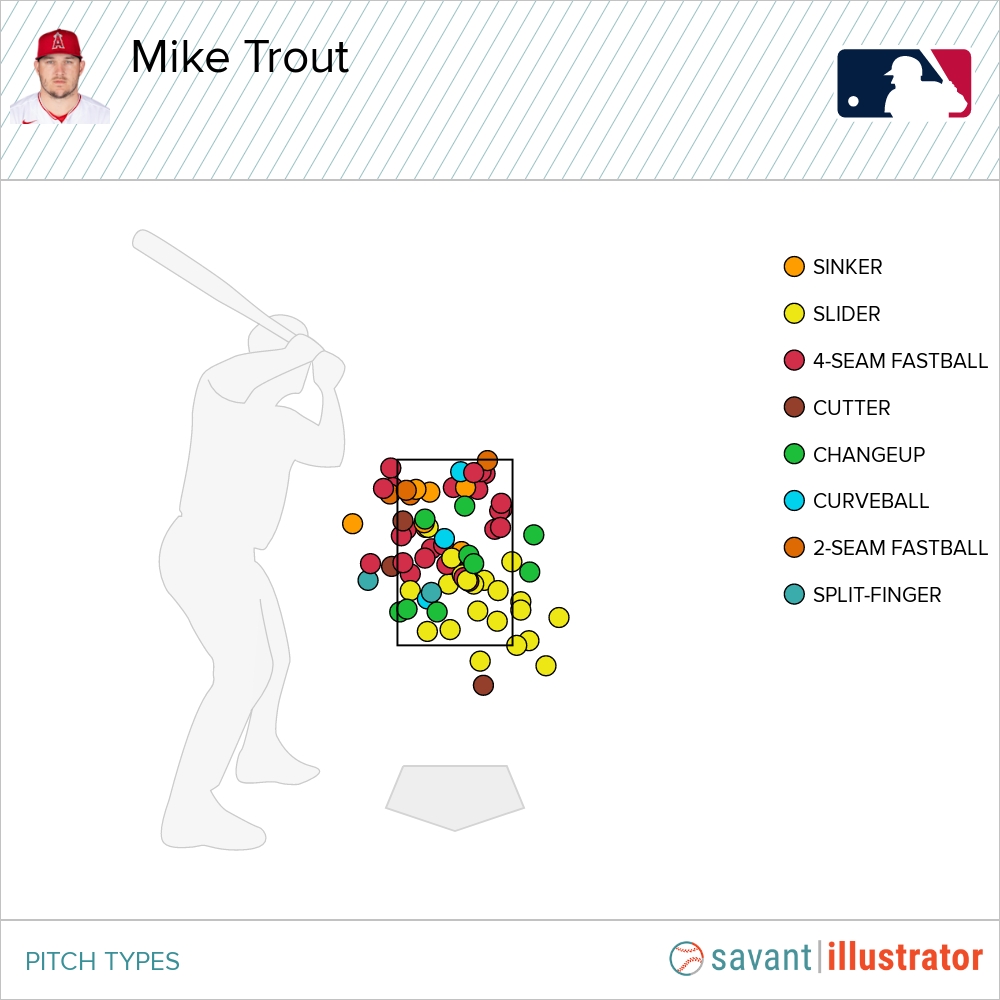
Overall, 18.8% of the pitches Trout saw between 2018 and 2020 were on the outer third of the plate, nearly 4% above league average. So far in 2021, though, that outer third rate is down to barely 10%. Here’s what that looks like through two weeks of the season:
Again, tiny sample. It looks like Trout is just getting more hittable pitches than usual, and being Mike Trout, he’s smacking the hell out of them.
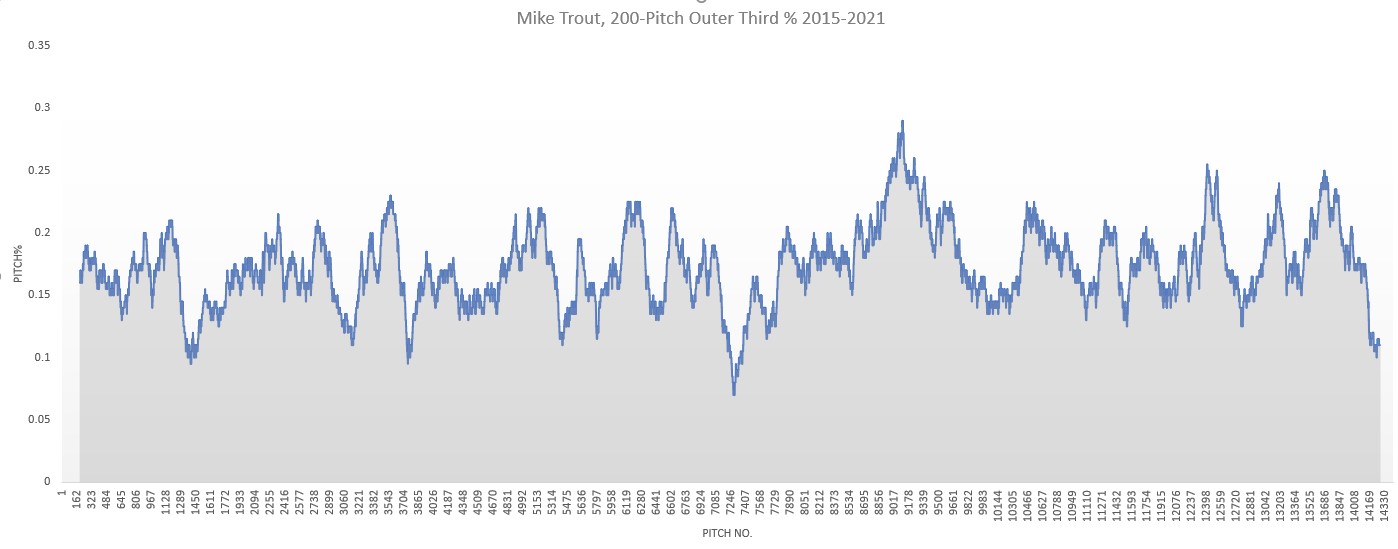
Nowhere on the internet gives us rolling graphs for how often he’s getting pitched outside, but that’s what Excel for Dummies is for:
It’s been a little more infrequent than the peaks and valleys of his other rolling charts, but this still isn’t anything novel. At the moment, it looks like he’s just fully taking advantage of pitchers perhaps being a little more erratic than usual.
Perhaps as a ten-year veteran, his pitch recognition has continued to improve to the point that he’s better than ever at picking up those wheelhouse pitches and turning o them. Because while I may be wrong, it doesn’t look like a whole lot has changed mechanically in his home run swing from last year to this one:
There’s one last thing left to cover with the batted balls, and it has to do with the weirdly low average launch angle I mentioned earlier.
Let’s take a look at the batted ball numbers again, but this time, paying attention to the first four columns rather than the last four:
| Season | GB % | FB % | LD % | PU % | Pull % | Straight % | Oppo % |
|---|---|---|---|---|---|---|---|
| 2015 | 37.9 | 20.9 | 37.2 | 4 | 35.1 | 35.5 | 29.4 |
| 2016 | 42.2 | 25.4 | 29 | 3.4 | 37.9 | 36.2 | 25.9 |
| 2017 | 37.7 | 29.1 | 23.4 | 9.8 | 37 | 39.2 | 23.7 |
| 2018 | 31.3 | 33.3 | 28.2 | 7.1 | 39 | 37.9 | 22.8 |
| 2019 | 25.4 | 36.2 | 29.4 | 9 | 41.5 | 34.7 | 23.7 |
| 2020 | 25.9 | 34.7 | 29.9 | 9.5 | 34.7 | 36.7 | 28.6 |
| 2021 | 35.7 | 32.1 | 28.6 | 3.6 | 53.6 | 35.7 | 10.7 |
If you were to look just at the groundball rate, you might be a little nonplussed, because we all know that the new gospel of Donaldson and Martinez is ground bad, air good. But even without noting that a 35% grounder rate is still well within the range he’s lived at earlier in his career, it looks like it might actually be a good thing here! Just like with batted ball direction, when we see notable changes in the kinds of balls in play a hitter is producing, we should also take note of which kinds a hitter is no longer producing.
With that in mind, we get a quick answer to where these extra grounders are coming from. He’s reducing the number of balls he puts in the air, but almost all of that reduction has come from his popup rate.
Now, grounders aren’t ideal, but they’re sure better than popups, especially with a hitter like Trout, whose groundball production is light years better than average. And exchanging the two is more or less what Trout has done to this point, without hardly touching the balls in the air that are actually productive.
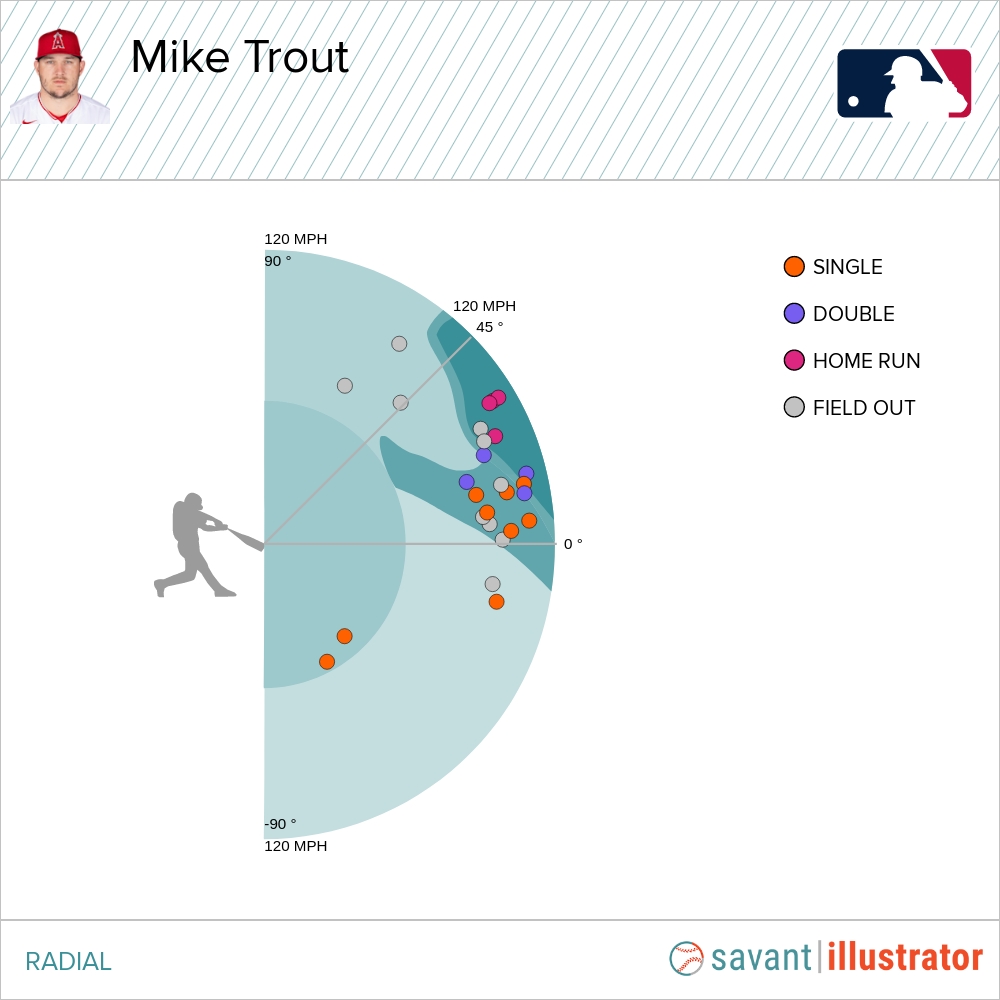
Going back to the Statcast numbers near the beginning gives us another way to look at it. We can see the same dynamic in the fact that despite the big (if not unprecedented) drop in average launch angle, his Sweet Spot% (the rate of batted balls hit at an “ideal” launch angle) has held steady and actually slightly increased. For another visualization, here’s a batted ball chart from the first month of last year compared to what he’s done so far this year:
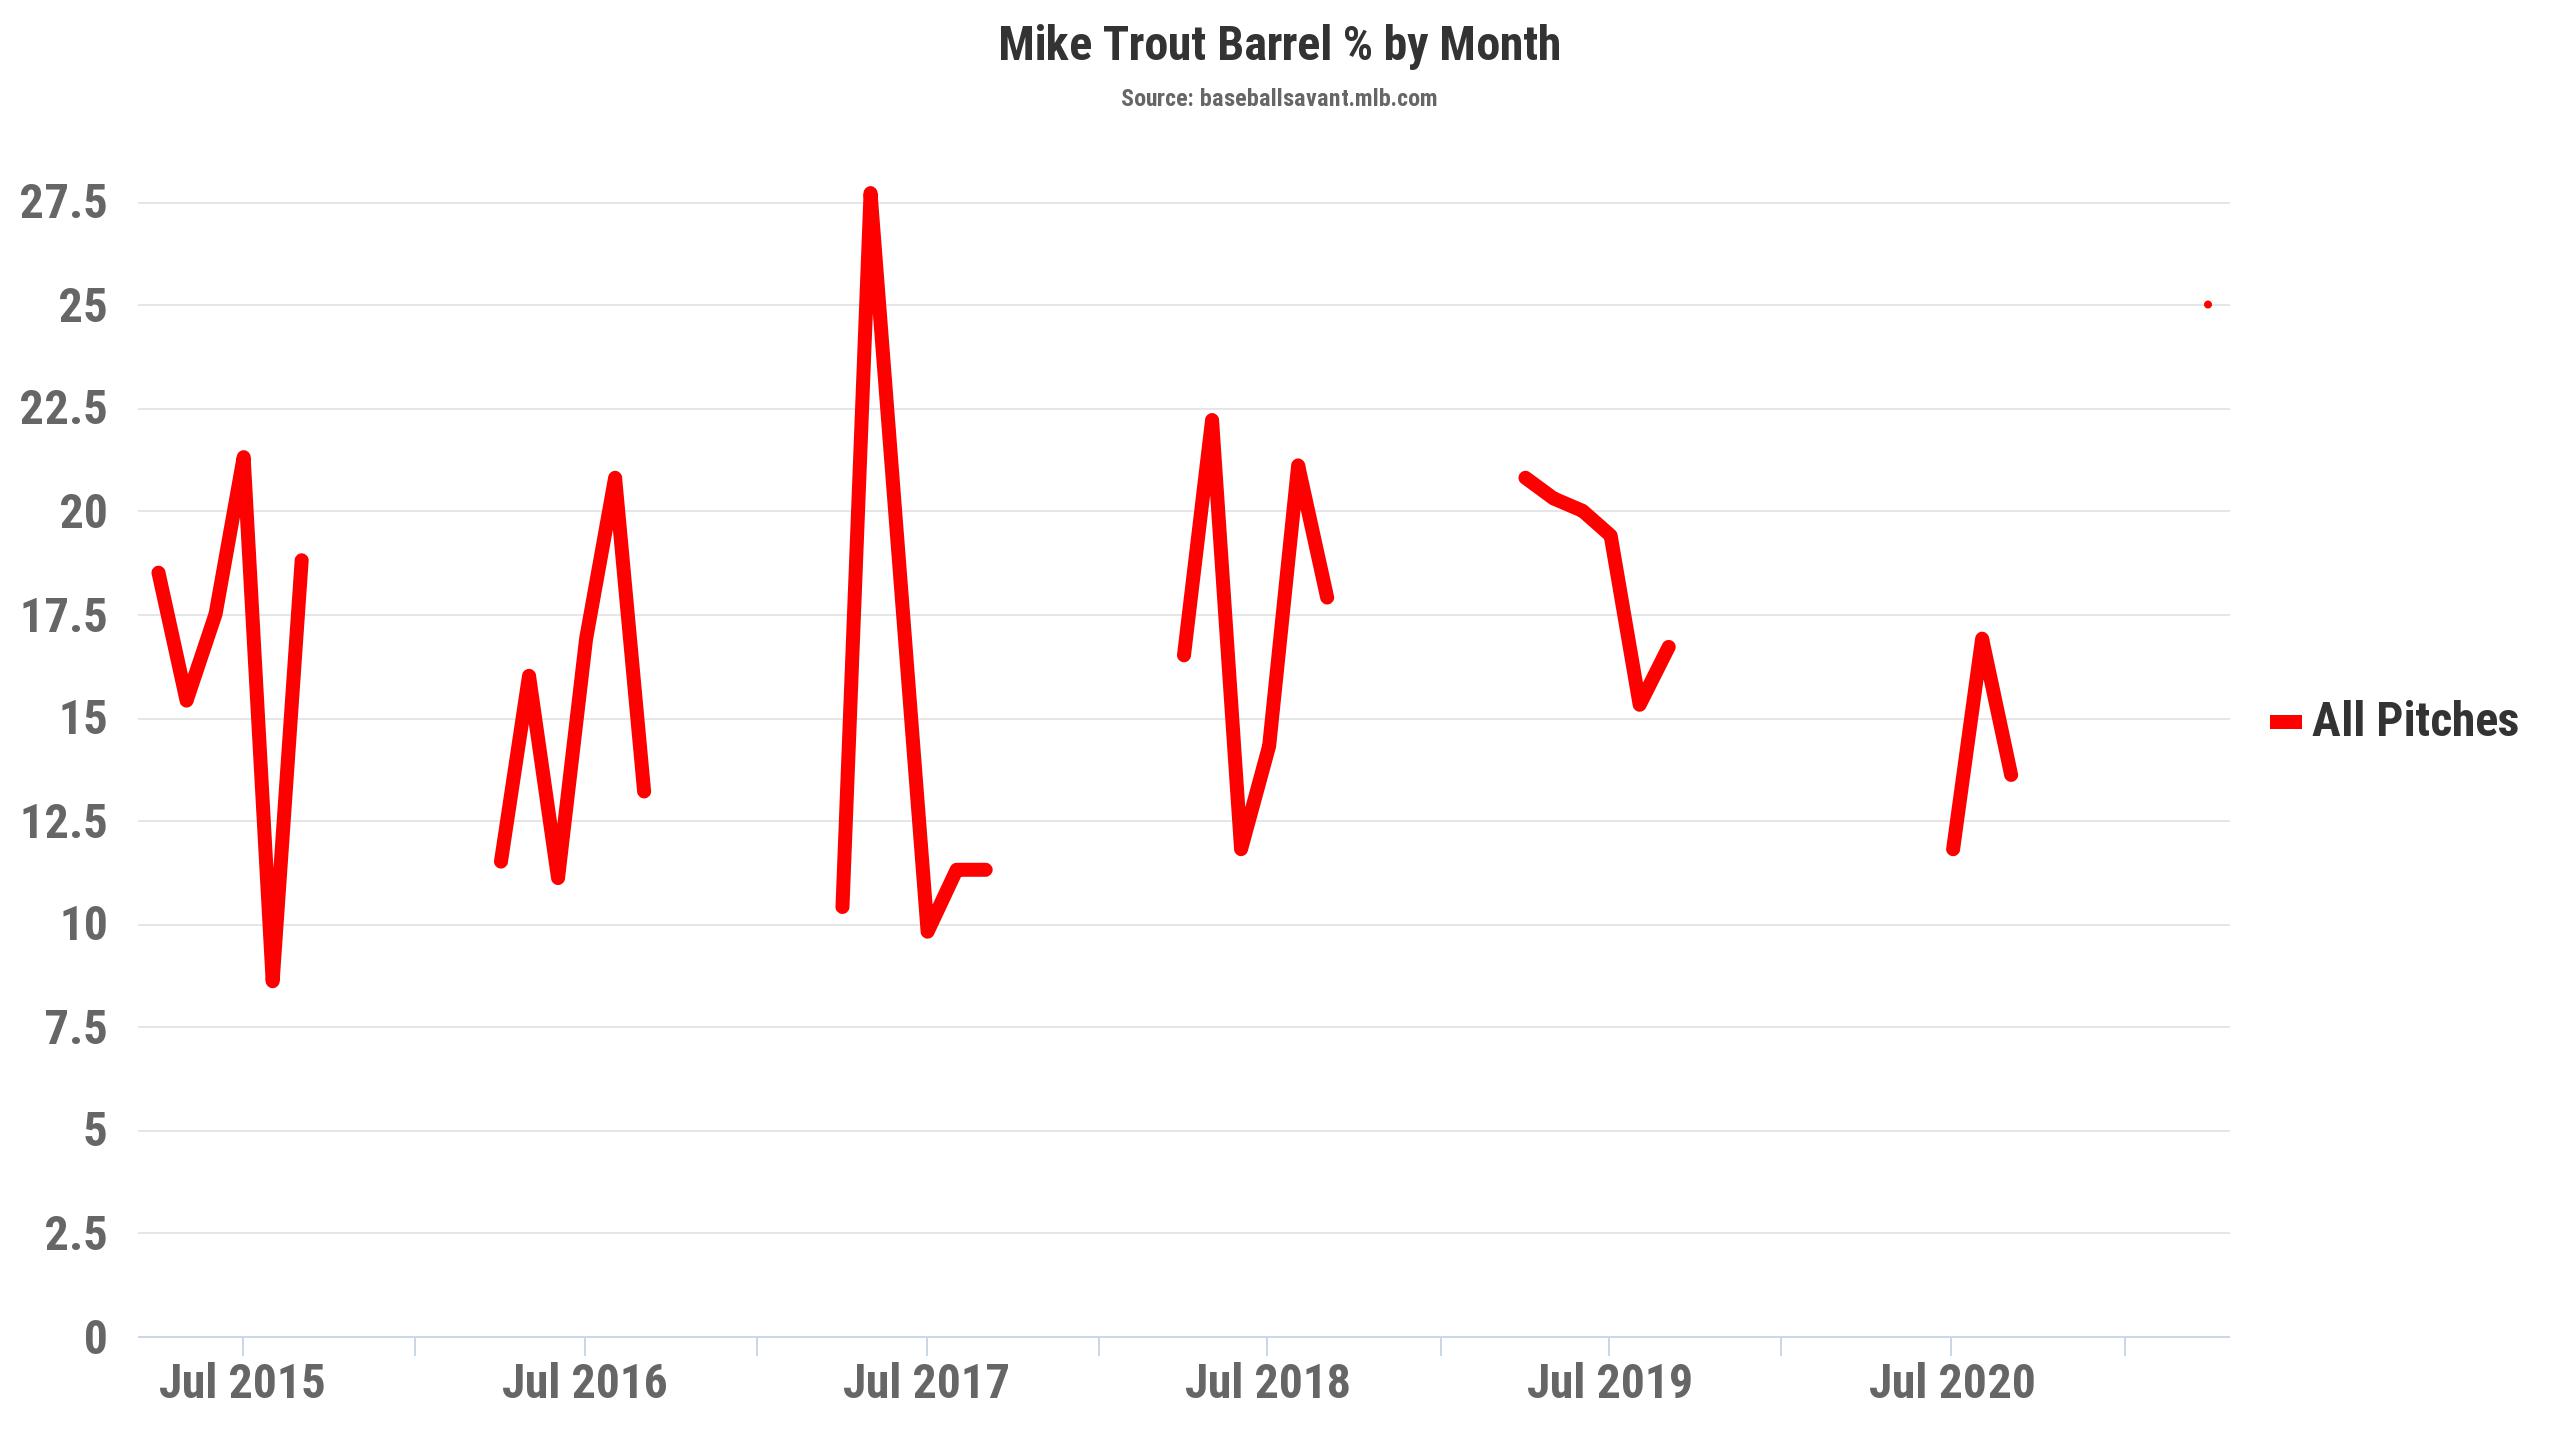
We still have a ways to go before the samples are even, but it’s clear that he’s getting under the ball a lot less than he was for a solid chunk of last year. Like the popup rate, the majority of the decreased average launch angle is coming from the elimination of much of that cluster of batted balls near the top of the chart that are typically automatic outs. After sitting at a career-high 34 degrees last year, his average launch angle on balls hit in the air has fallen to 27 degrees, which explains a lot of the absurd rate at which he’s been collecting barrels at, which has been excessive even by his standards:
I’m often skeptical about relying too much on barrels and barrel rate as a measure of offensive skill, but in this case, the numbers really don’t lie. He already hits a ton of balls in the most productive possible way, and now he seems to have taken his most unproductive batted balls and them into more of his most productive.
Wild stuff! Interestingly, his launch angle tightness (the standard deviation of a player’s launch angle, a rather brilliant concept introduced recently by Alex Chamberlain) has actually gotten higher, which is not the development you’d expect from someone narrowing down the kinds of batted balls they hit. It might mean something, it might not, but it might be worth looking into later!
It’s really hard to tell how real any of this is, or if there are any changes that are actually taking place. Honestly, I don’t really see Trout doing much of anything different on these two swings from 2020 and 2021, other than that he was ready to pounce on one fastball, and not so much the other:
However small the sample, it’s worth noting that the best player in the world is still finding ways to get better.
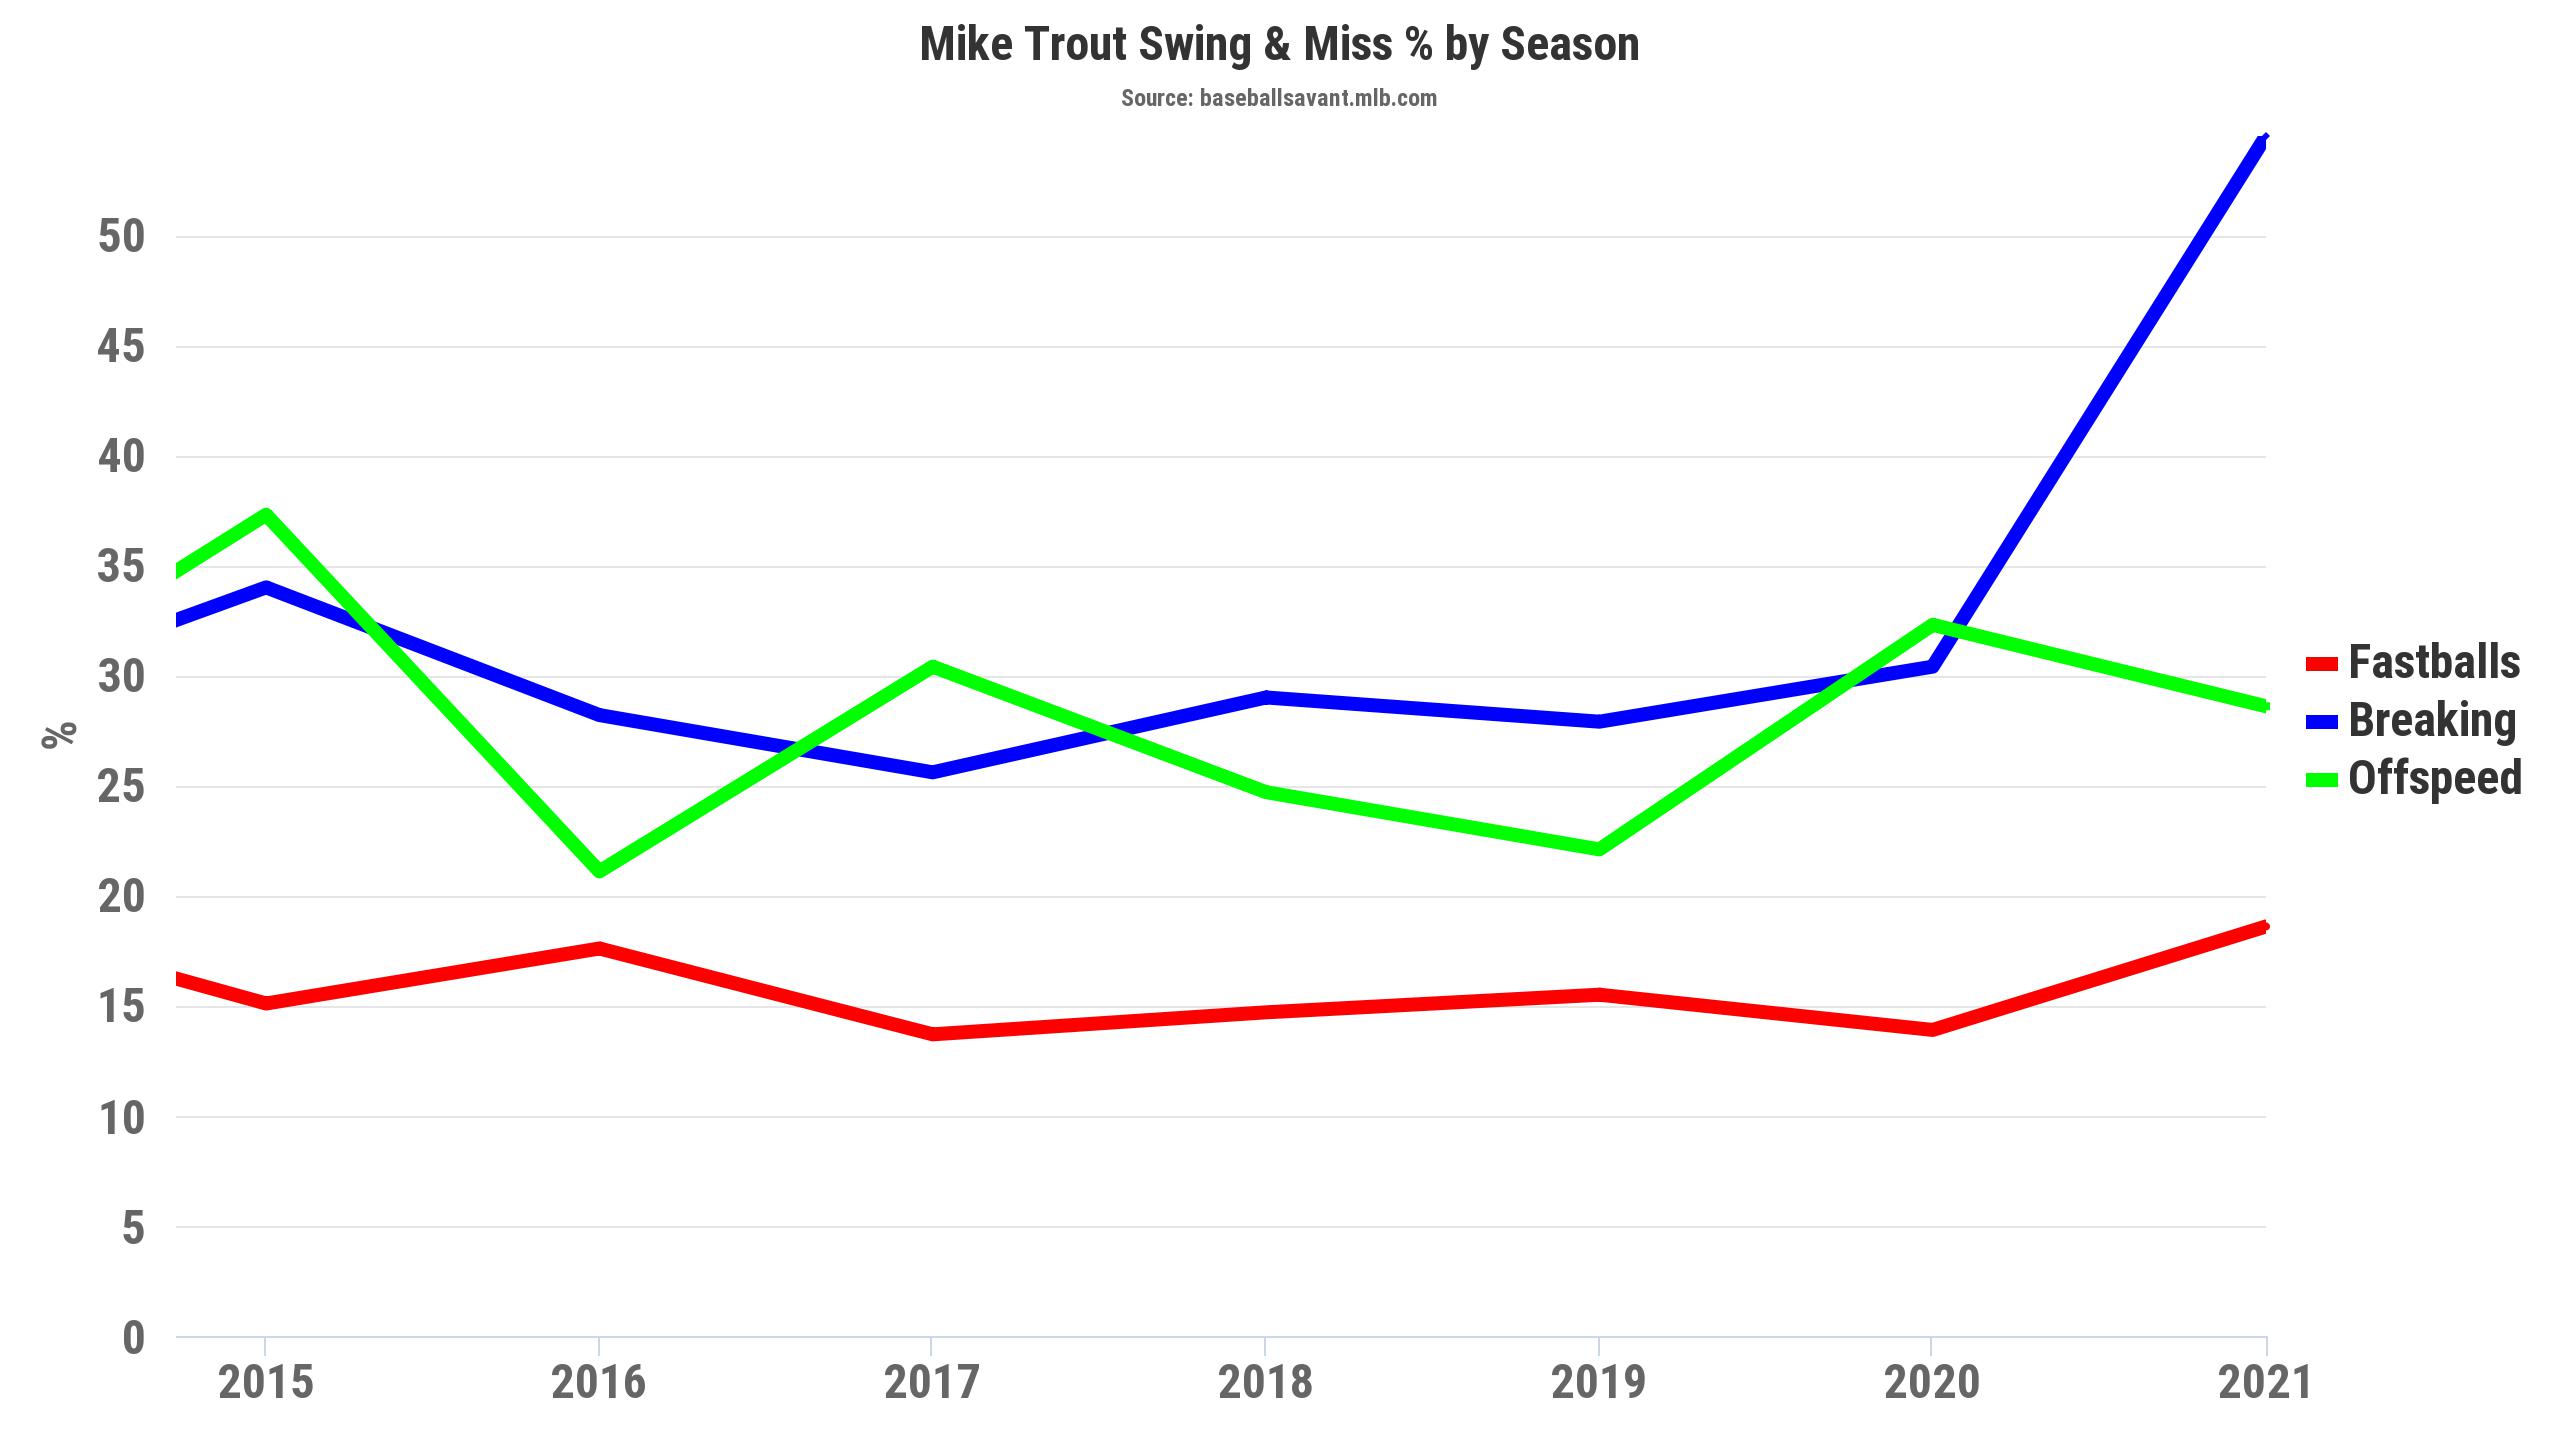
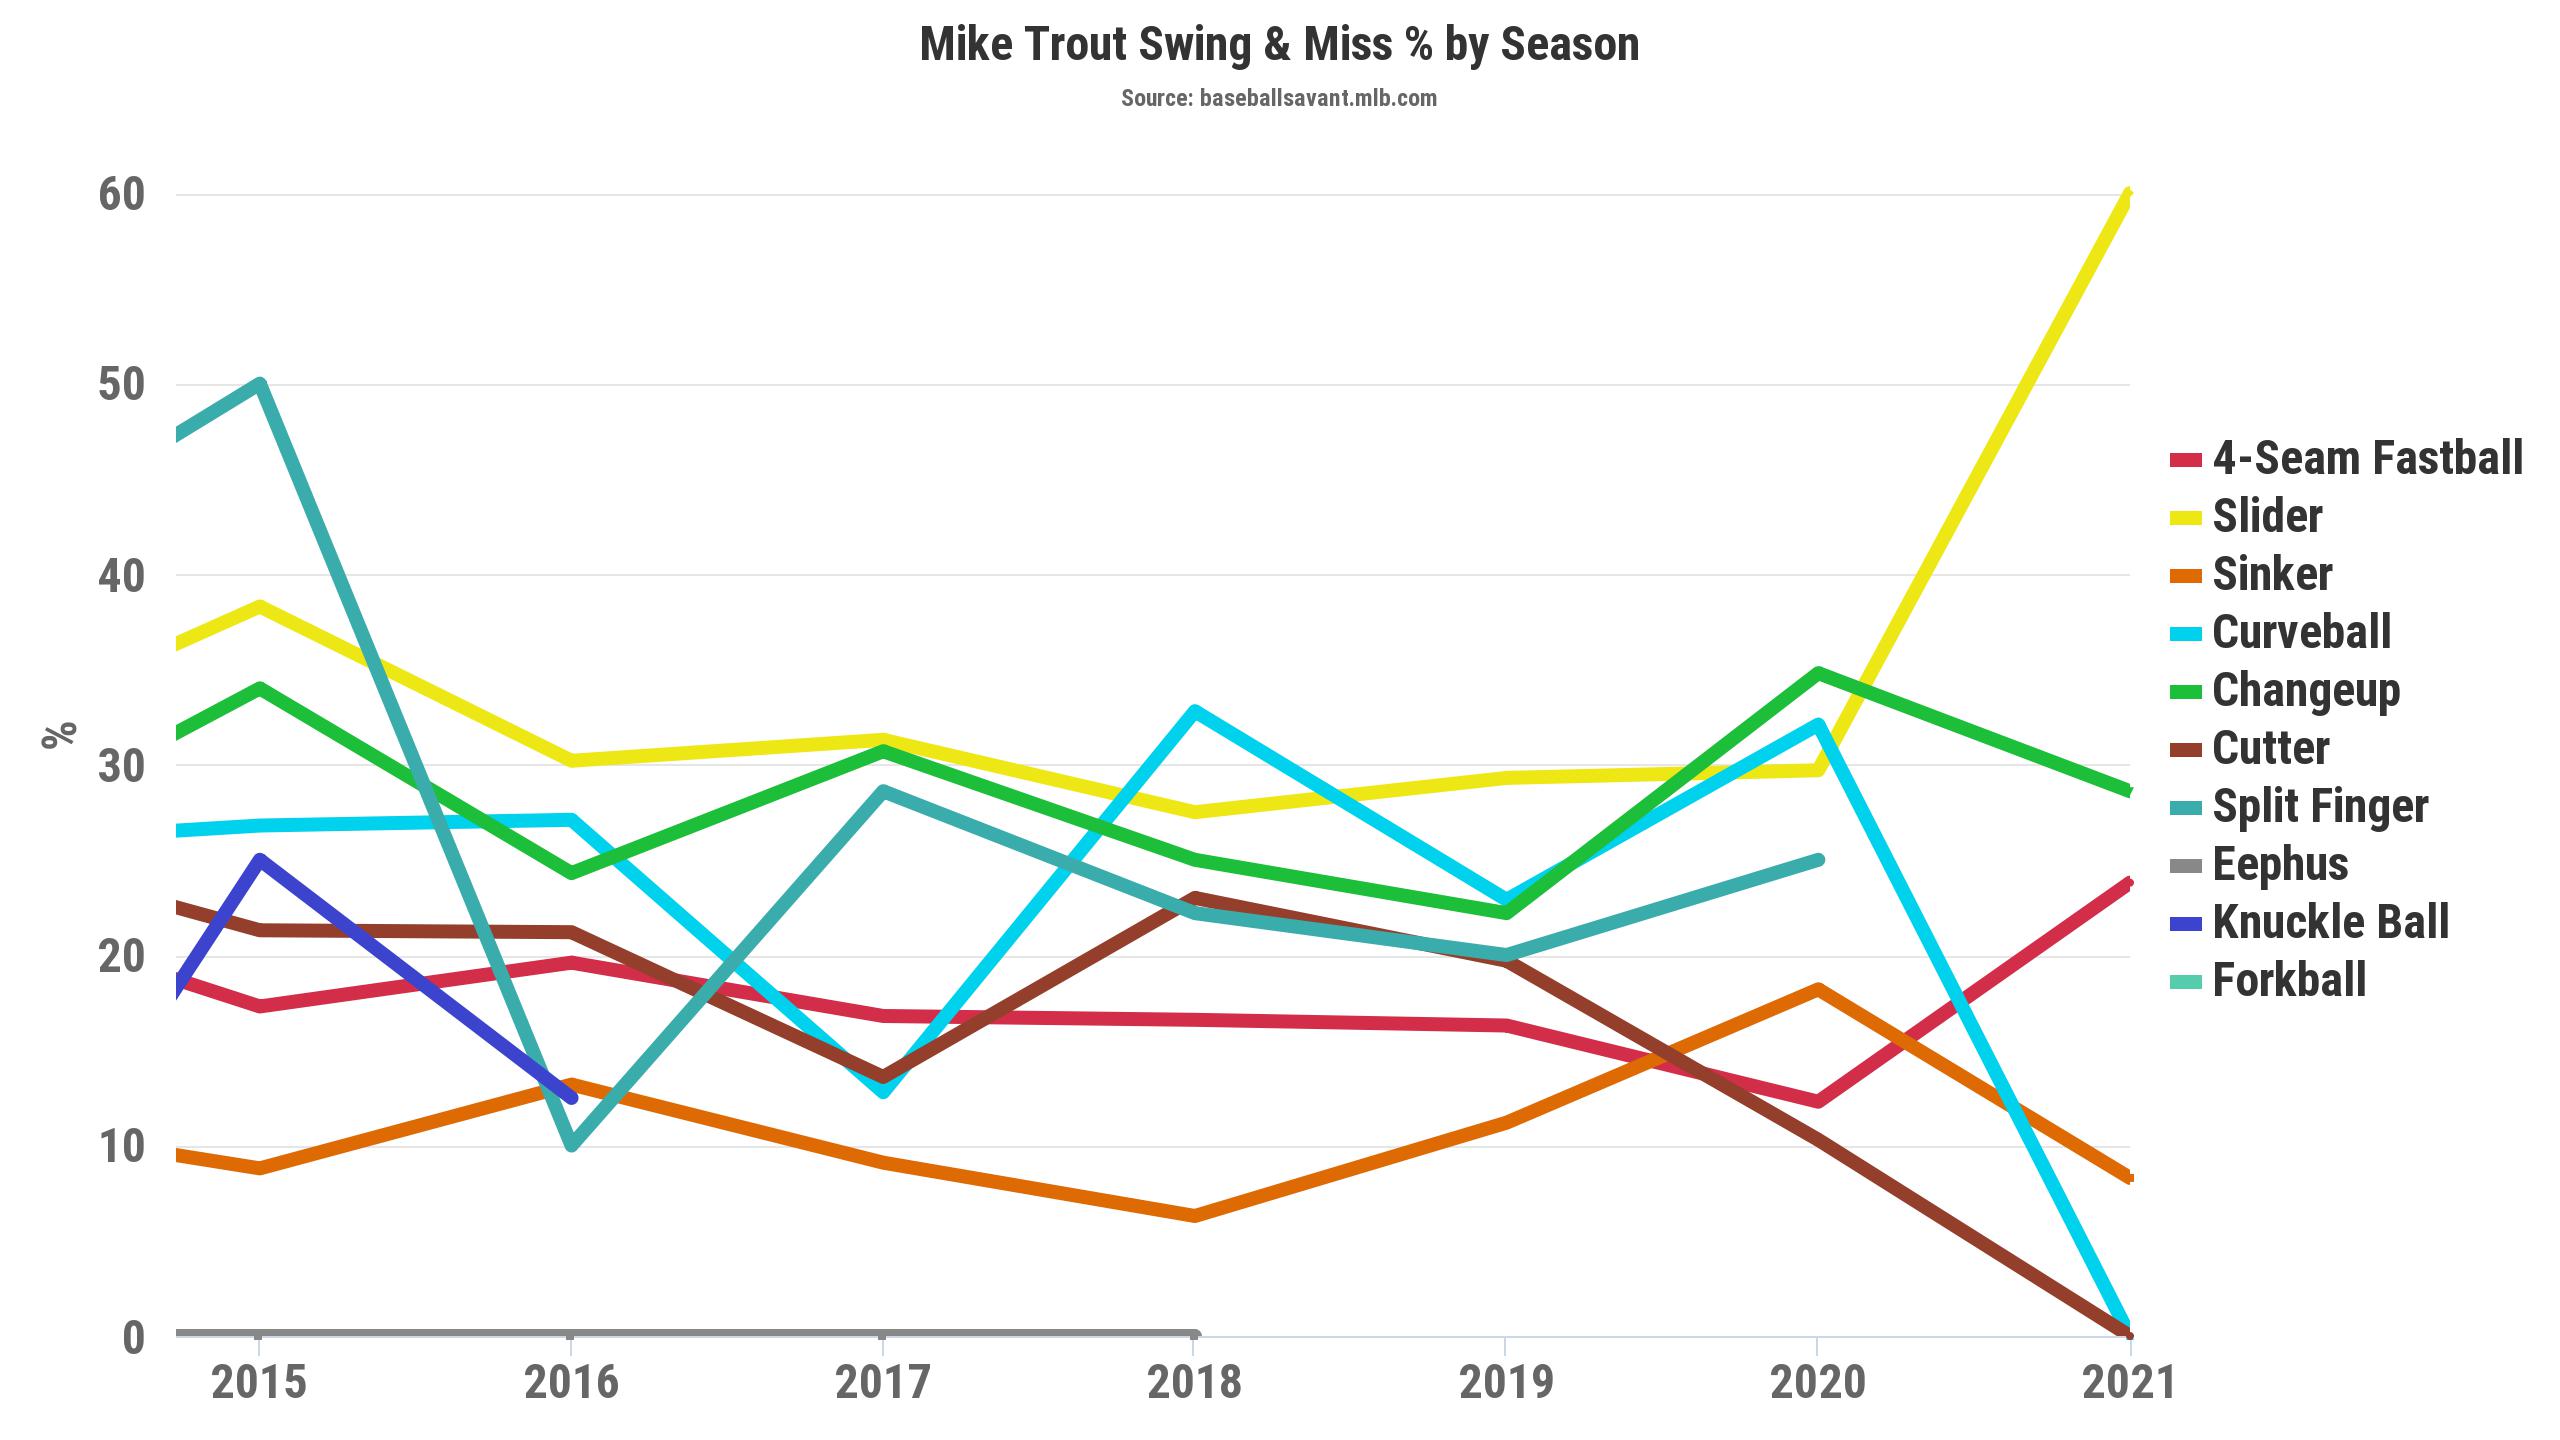
The last thing to keep an eye on so far is that whiff rate that, while nothing he hasn’t done for stretches in the past, isn’t something you want to have hanging around consistently, either. It doesn’t take much searching to figure out where those extra swings and misses are coming from:
Trout is suddenly having a lot of trouble hitting sliders. I’m already over 2000 words, so this isn’t the place to speculate about why that might be. Maybe part of this ideal contact surge involves sitting more on one type of pitch and therefore getting fooled a bit easier on others.
Pitchers haven’t been throwing him any more sliders than usual outside of the slight bump in usage rate that exists league-wide. But it might be worth noting that the pitches Trout has historically popped up a lot are also the pitches he’s suddenly missing a lot:
So it also seems possible that Trout is just exchanging better contact on most pitches by punting contact at all on the ones he barely does anything with anyway. I don’t know! Regardless, that slider usage is what I’d be looking at in the near future.
Will pitchers find a way to exploit this new weakness and start leaning on spinners a little more? And if that were to happen, will Trout’s otherworldly plate discipline let him turn that into an increase on an already incredible walk rate? We shall see!
So, there’s your April checkup on Mike Trout. As per usual: lots of good, not a lot of bad, and a few tweaks subtle enough that I’m not really sure if they exist despite having some kind of visible impact on his game. Whatever it may be, one thing is very clear to me.
There will certainly be a day when Trout his Jay-Z/Lil’ Wayne at the ’09 Grammys moments with Acuña or Tatís or Yermín Mercedes. That day, however, will probably not be in 2021. The weatherman is still the best player in the world. What else is new?
Photo by Keith Allison/Flickr | Adapted by Justin Redler (@relderntisuj on Twitter)


