“Tis but thy name that is my enemy;
Thou art thyself though not a double.
What’s a double? it is nor single, nor triple
Nor walk, nor strikeout, nor any other result
Belonging to an at-bat. O! Be some other batted ball;
What’s in a name? that which we call a double
By any other name would carry just as far.
So a double would, were he not a double call’d,
Retain that xISO perfection which it owes
without that title. Double, doff thy name;
And for that name, which is no part of thee
Take all the bases instead.”
That’s right, folks. We call that an adaptation! My mother is just mostly happy I finally put my theatre degree to some use. Proper use of one’s BFA aside, recently in the baseball world I have become incredibly interested in how we label things. Names have incredible power in what we do here. The difference between a fly-ball out and a diving catch are miles apart. One implies a mundane, poorly hit ball while the latter is a sure hit snatched from the hitter’s grasp by a spectacular play.
The results are the same, though. They both simply go down as an out. Ditto for plenty of other plays.
This week I came across a related topic that needed a little more investigation: When a ball hit well enough to be a home run ends up a double and how we put that into context of a player’s performance, especially if they aren’t hitting as many home runs as we are expecting them to.
I first came across this idea two days ago while watching my hometown Indians battle the Boston Red Sox. Zach Plesac was on the mound facing J.D. Martinez, who proceeded to do what the Martinezs of the world do to the Plesacs of the world:
The video comes courtesy of Baseball Savant, and when you take a look at the hit’s specific Statcast data, it paints a fascinating picture.
| Event | Distance | Direction | Exit Velocity | Launch Angle | 1B % | 2B % | 3B % | HR % |
| Martinez Double in 2nd Inning 5/28 | 395 Feet | Left Center Field | 108.6 MPH | 18 | 0.0% | 63.4% | 3.2% | 19.4% |
Based on the exit velocity and launch angle, it had a 19.4%—or nearly one in five chance—of being hit for a home run, and a near two in three chance of being hit for a double. The thing is, this hit doesn’t factor in the distance to the fence or the direction the ball was hit in. When you take those factors into consideration it seems highly likely that HR% increases incredibly.
So why did it end up a double? Note the giant green wall in the way. For those unfamiliar with Boston’s home park, this is the fabled Green Monster, which is an astonishing 37 feet tall. Instead of sailing the full 395 feet its trajectory dictates it should have gone, it clangs off the wall for a double.
Martinez did every part of his job. He hit what was almost assuredly a home run or at the very least a near-home run ball; he just had the misfortune of hitting it in Boston. He has no control over that monster being there, yet we view that hit solely as a double, which has a huge cascading effect. We’re talking about a potentially lowered home run total for the season, not to mention docking him the guaranteed run and RBI along with a lower slugging percentage.
Both a home run and a double are great results, but we place much greater importance on the home run when we evaluate the player. This led me to wonder if we should be taking the full context of that hit into consideration when looking at Martinez as a player, especially since he’s hitting fewer home runs than expected this year. Is he hitting for less power, or has h run into some bad luck when it comes to where he’s hitting his home run-caliber balls?
I went through and looked at the double in question, location, launch angle and distance and compared it to the dimensions of every park and found that the same batted ball had a real shot at leaving the yard in 27 of the other 29 ballparks in the league. Martinez was robbed of a home run simply by a circumstance of schedule.
So what does this have to do with anything? We can take this information and use it to help us better understand what is going on when we are concerned about a player’s home run performance. First I would like to take a look at some of the ballparks that have a tendency to rob hitters of their well-deserved home runs and dive into a few players who have potentially been suffering from this issue. I searched for doubles hit at least 330 feet (the shortest distance a home run would go if hit down the line) that were either barreled or labeled by Statcast as solid contact, and then I separated them by ballpark and eventually by player. Here are the top 15:
| Ballpark | City | Qualifying Doubles |
| Fenway Park | Boston, MA | 48 |
| Nationals Park | Washington DC | 47 |
| Coors Field | Denver, CO | 39 |
| PNC Park | Pittsburgh, PA | 38 |
| Progressive Field | Cleveland, OH | 35 |
| Kaufmann Stadium | Kansas City, MO | 34 |
| Oakland Coliseum | Oakland, CA | 34 |
| Citizen’s Bank Park | Philadelphia, PA | 34 |
| Globe Life Park | Arlington, TX | 34 |
| Target Field | Minneapolis, MN | 33 |
| Chase Field | Phoenix, AZ | 32 |
| Oracle Park | San Francisco, CA | 31 |
| Petco Park | San Diego, CA | 29 |
| Tropicana Field | Tampa, FL | 29 |
| Wrigley Field | Chicago, IL | 28 |
Part One – The Ballparks
Coors Field
Wait what? Coors? Really? The offensive haven loved by fantasy players everywhere and feared all pitchers far and wide? How could it possibly be robbing players of home runs? Because it’s huge. Look at its dimensions:
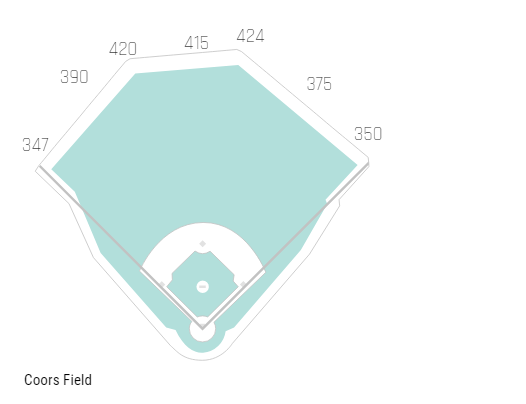
That is a huge ballpark. Look at that center field. At its deepest it’s 424 feet from home plate. Even a ball hit down the line still has to go 20 to 30 feet further than any other ballpark in order to get over the fence.
Speaking of fences it gets even more difficult once you add in the wall heights. Basically starting at the left field foul pole all the way to the 420 mark the fences are 13 feet tall. Then from there all the way to the 424 mark is 8 feet tall and finally, from the 424 mark, all the way to the right field foul pole is 17 feet tall! That’s a lot of fence. It feels like something the white walkers need an undead dragon to knock down as opposed to a baseball park.
This all leads to hitting a ton of doubles that normally would be home runs in other ballparks, altitude be darned. Using my criteria, 45 doubles have ALREADY been hit in Coors Field that would potentially be home runs in other parks.
Chase Field
You’re going to notice a trend in the parks we look at today. They’re all either huge, have towering walls or both. Much like Coors, Arizona’s Chase Field is both. You don’t realize it at first glance but it is enormous:
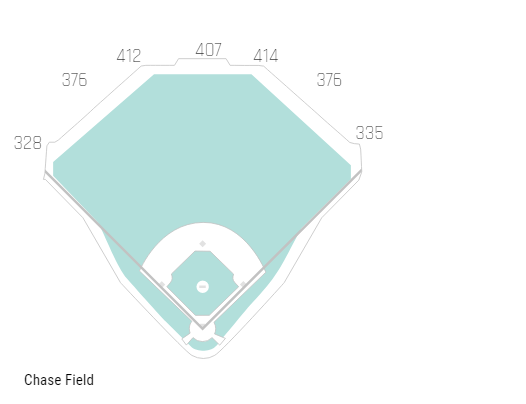
That’s just a long way you have to hit the ball for it to get out. This is also another park at altitude that has introduced a humidor to varying degrees of success. It’s worth noting that overall the distance and loft added by altitude tend to have the greatest effect on hits that aren’t home runs.
Chase Field also has a large wall in center that’s 25 feet tall but I don’t think that is as impactful as Coors’ fences because both the left and right field fences are a mere 7 feet 6 inches tall. Pulling the ball is the way to go in Chase Field. This is negated in some way though by the sheer size of the park. It’s pretty normal at the foul poles but center field is incredibly huge and this causes a pretty steep and rapid climb in the fence distance from home plate. That’s a long way to hit a home run and a ton of space for a deep ball to fall in for a double. There have been 32 doubles hit in Chase Field that fit my criteria.
Fenway Park
Ah, Fenway. Perhaps the most unique venue in all of sports, what a cool ballpark.
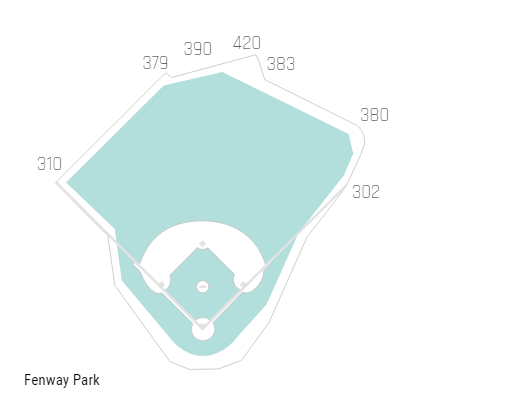
We’ll get to the walls in a moment, first check out the dimensions. If you can hit the ball literally down the right-field line that 302-foot distance to home plate can net you some easy home runs. Center field is super deep at its apex but has some pretty shallow dimensions otherwise at 379 feet and 383 feet. The crazy part is the right field wall will stay at 380 feet pretty much all the way to the foul pole where the wall veers sharply to that 302-foot mark we just mentioned. This is a prime recipe for doubles.
Normally if you hit a ball 10 feet off the right-field line you might have to hit the ball maybe 340 to 350 feet for it to get out but here you’d still have to the ball 380 feet! This leads to many doubles that would be home runs in a lot of other ballparks. From a defensive perspective, it honestly might be the most difficult RF in all of baseball.
Now, what about the fences? This is where things get interesting. Let’s start in right field where the fences from the 302-foot mark all the way to that 383-foot mark sit at a 3 to 5 feet. The fence surrounding the bullpen from the 383 mark to the 420 mark is 5 feet tall. Side note, I love this tiny fence height cause it leads to awesome catches such as this one from a few years ago:
Tangent over. I just can’t resist any opportunity to share that catch. Also so long as no one gets hurt (as far as I know no one has) it’s fantastic when home runs are hit there and the relievers have to scramble for cover like ants.
Anyways back to the fence heights. From the 420-foot mark to the 379-foot mark the walls are 17 feet high. Then we reach the big daddy, wall to end all walls, the Green Monster. We touched briefly on this before but this fantastic wall sits at a towering 37 feet. In order to hit a home run over the Green Monster you have to hit the ball so much higher to get over the wall. Here’s a great Hardball Times article on how much harder it is to hit a home run over the monster.
The average fly ball home run should make it over the Monster. It’s the line drive home run that feels the Monster’s wrath. This is kinda the crux of this article. The hitter hit a home run ball. I’m not saying we should give him credit for a home run or add runs or RBIs but as analysts, we should view that hit the same way we would a home run in terms of evaluating the player’s power (or missing power in the cases we’re about to see). For further evidence of Fenway’s home run-swallowing tendencies, 48 doubles were hit in Boston that fit the base criteria I set out earlier.
Globe Life Park in Arlington
Having touched on on Coors, Fenway, and Chase Field, you would notice that most of the stadiums we’ve talked about are traditionally considered hitter’s parks. I think it’s worth noting that the size and shape of these parks are what help create a lot of that batting emphasis but it can also work against the hitters in a different way than a pitcher’s park does. They lend themselves to the overall offense being elevated just not AS home run heavy as we think it would be. Globe Life Park is right there as well. Check out its dimensions:
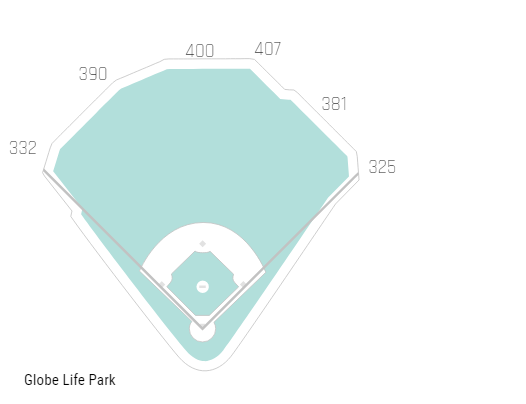
Another day, another huge park. While the center field isn’t the deepest we’ve seen so far, look how wide it is. It’s 400 feet deep for quite a while. It’s 390 feet in left field and 381 feet in right field in places that are usually closer to 350-370 feet so it is a deep and wide park that then sharply cuts back to normal depths at the corners.
How about the walls? Here, the fences aren’t nearly as imposing, a mere 8 feet in right and center field while being 14 feet tall in left field. The main feature at work here for our purposes are those deep fences that seemingly surround the entire field. 34 doubles have been hit so far in 2019 that fit my criteria.
PNC Park
We have three more I want to look at before we talk about the players, but here’s our first pitcher’s park. PNC was one of our top contenders in doubles that fit our criteria with 38 total home run potential doubles. PNC has many of the same qualities that we see in Arlington in that it is very deep and very wide:
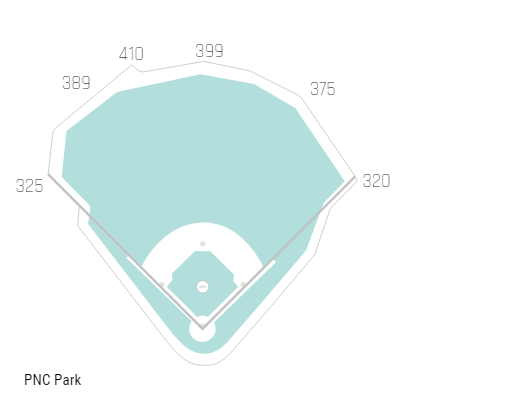
That’s just a whole lot of outfield. Being a right-handed pull hitter in this park must be pretty rough. 410 feet to left-center field is a long, long way to have to hit a ball. It’s also an incredibly deep power alley so while it might not lead to a ton of home runs, the fielders are pretty spread out so doubles abound in PNC Park. On to the walls, left field to left-center field is only six feet tall, with center field bumping up to 10 feet and finally, right field gets all the way up to 21 feet.
Progressive Field
Another ballpark marked by a very distinctly tall outfield wall. First though the dimensions:
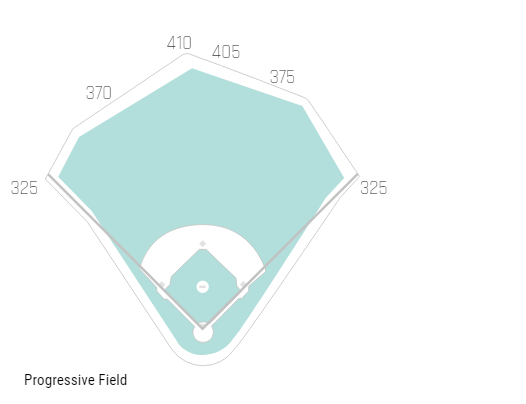
It’s not an absurdly huge park, but it still has some decent size to it. Mainly it’s that triangle from the 370-foot mark to the 375-foot mark to the 410-foot mark that is really wide and deep. The real home run gobbler here is the left field wall itself. It stays pretty deep at 370 feet, but the main issue is its height. Dubbed the “Little Green Monster” this wall sits at 19 feet tall or about half the size of its Boston papa, but it also sits almost 60 feet further back. So you not only have to hit the ball 370 feet, but it also has to clear a 19-foot wall which really limits line drive home runs. 35 doubles have been hit here so far that fit our criteria.
Nationals Park
OK, last one. Nationals Park sounds like a Yosemite-style destination and holy moly do the dimensions back that up:
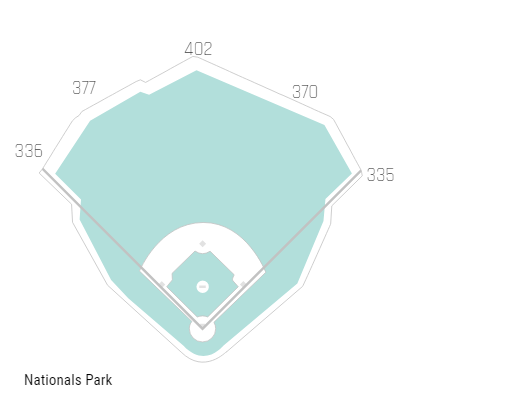
That outfield is just absolutely enormous. Like you might find the last remaining pack of wild wolves left in America roaming somewhere in center field it’s that big. I think the right fielder and center fielder communicate via cell phone they’re so spread out.
It’s pretty darn deep too. It’s pretty easy to imagine how Nationals Park swallows balls that would normally be home runs and turns them into doubles. The fences in right field are 16 feet 9 inches which rivals Cleveland’s Little Green Monster and are 10 feet 9 inches everywhere else. This was No. 2 in our rankings of parks that have doubles that fit our criteria with a whopping 47.
Part Two – The Players
So now, of course, the question is what do we do with this information? Oftentimes when a player is hitting fewer home runs, it’s for obvious reasons. They could be hitting fewer fly balls, their launch angle/exit velocity could be down, they’re barreling the ball less often or they’re striking out way too often.
If there’s no obvious explanation, one of the first things I do is check how many doubles they have. If they happen to have more doubles than you would expect then I take the information in Part One and use it to evaluate the player’s doubles and see if any of them were home run balls based on their distance, whether it was barreled and its spray chart location to determine if it’s possible the player got unlucky and hit a home run ball that was turned into a double by the park they happened to be playing in. When I started looking at all the data for this piece I was astonished by some of the results.
This has been an interesting season so far for Trout. He’s been relatively disappointing (for him) so far this season while still being a five-category stud. Here are his baseline stats this season:
| AVG | HR | OBP | SLG | OPS | 2B |
| .284 | 13 | .458 | .585 | 1.043 | 14 |
The thing is the HRs are down right? If for the sake of easy math you are willing to grant the premise that we are essentially one-third of the way through the season that puts Trout on pace for 36 HRs which is down from last year (but still awesome). Yet look at his doubles total. He’s on pace for around 42 doubles which would be a career-best by about three doubles. This made me wonder if Trout might be the perfect test case for our exercise. I ran his doubles through the Statcast criteria we set up in the beginning of the article and here’s what we got:
| Number | Distance | Spray Chart Direction | Number of Parks Where It Could Have Been A HR | Park It Was Hit In | Launch Angle | Exit Velocity | HR% |
| 1 | 331 | Left Center | 0 | LAA | 25 | 94.7 | 8.5% |
| 2 | 333 | Left Field Corner | 9 | DET | 16 | 92.1 | 1.7% |
| 3 | 343 | Left Field Corner | 26 | TEX | 24 | 98.3 | 20.6% |
| 4 | 365 | Left Center | 13 | BALT | 16 | 108.5 | 7.9% |
| 5 | 369 | Center | 0 | OAK | 17 | 106.7 | 4.8% |
| 6 | 370 | Right Center | 27 | LAA | 20 | 103.9 | 11.4% |
| 7 | 372 | Right Center | 27 | OAK | 23 | 101.2 | 20.6% |
It’s important to remember two things. The process involves a decent bit of eye-balling. We’re not going to get definite numbers, so take a look at the spray chart location/exact location on the spray chart, the distance and give it your best guess. The second is that while I spoke a lot about the wall height in Part One, I only really factored them in for the extreme cases such as Fenway, Progressive Field or Coors.
One last thing worth noting is that while at first glance the HR% isn’t that compelling, remember that number doesn’t factor in Spray Chart Direction so again you kinda have to go with your gut on some of this. We’re focusing more on context so it’s okay to make a judgment call if you need to. Mainly I included HR% because it can really help you get an idea of which doubles are more likely to be home runs than others at a glance.
So let’s break this chart down. By my gut, of the seven doubles Trout has hit so far this season that met the criteria, three of them would have had a good chance of being a home run in 20+ MLB ballparks, two of which have a 20.6% chance of being a home run based on their Statcast data alone. I’m willing to eliminate the first two due to low probability and hit location.
On the other hand, I’m counting No. 3 based off both the Statcast HR% and its spray location. If you look at the batted ball location it was pulled pretty much down the line and would have likely cleared most left field walls by about five to 10 feet. It just so happened to be hit in Texas which as covered earlier has abnormally deep left field walls. So that’s one.
Trout didn’t pull No. 4 enough so it doesn’t have the distance to get out based on its spray chart location. If it would have gotten out in closer to say 17 or 18 parks I likely would have counted it as well. No. 5 is clearly out. Then I think it’s pretty obvious we should include No. 6 and No. 7. In fact just to illustrate my point I want to include the video for No. 7:
See how that ball hits 3/4 of the way up the rather large wall in Oakland Coliseum (I couldn’t find the height for the wall, but it looks like it’s at least 12 to 15 feet.) It makes it seem pretty obvious that ball would have left the yard at that distance if not for the tall wall. That is exactly the kind of hit we are looking for in this exercise. So of the seven doubles that qualify, I’m willing to say three had an above average shot of being a home run in another location. Even if one or two of those turn out to be true don’t we feel a lot better about Trout’s HR output if he has 15 HRs instead of 13? Let’s do a few more.
Here’s a slugger who has gotten off to a slow HR start as well.
| AVG | HR | 2B |
| .292 | 11 | 11 |
Calling Fenway Park home I had a hunch that when we dove in deeper we might see the Green Monster (and Fenway’s dimensions) robbing him of a few home runs early on. Let’s see if I’m right.
| Number | Distance | Spray Chart Direction | Number of Parks Where It Could Have Been A HR | Park It Was Hit In | Launch Angle | Exit Velocity | HR% |
| 1 | 362 | Right Center | 17 | CHI AL | 19 | 106.7 | 7.5% |
| 2 | 376 | Left Center | 23 | CHI AL | 20 | 106.5 | 29.2% |
| 3 | 395 | Left Center | 29 | BOS | 18 | 108.6 | 19.4% |
| 4 | 428 | Center | 27 | BOS | 25 | 111.6 | 100.0% |
No. 3 is the hit off Plesac from the opening paragraph in case you were curious. Check out that last one with its 100.0 HR%. Here’s the video:
It would have easily been out if not for that elevated wall and easily would have been out of pretty much every ballpark in the country. So by my count that’s three I’d absolutely include and one I’d definitely consider. We’d feel a heck of a lot better of Martinez if he had 14 or 15 HRs right? Bingo.
OK, one more and we’ll wrap it up. This is one is pretty interesting. No player has had his HR total hurt more by his home park than Dahl. Here’s his stat line so far:
| AVG | HR | 2B |
| .318 | 5 | 14 |
Like Trout, 14 doubles is great and puts him on pace for roughly 42 doubles, but we certainly expected more than 5 HRs (15 HR pace) at this point in the season right? Let’s see just how bad Coors is sticking it to him:
| Number | Distance | Spray Chart Direction | Number of Parks Where It Could Have Been A HR | Park It Was Hit In | Launch Angle | Exit Velocity | HR% |
| 1 | 383 | Right | 24 | Denver | 99.1 | 26 | 36.9% |
| 2 | 385 | Right Center | 22 | Milwaukee | 104.5 | 23 | 49.2% |
| 3 | 392 | Right Center | 19 | Denver | 106.8 | 24 | 92.1% |
| 4 | 397 | Center | 22 | Atlanta | 105.4 | 21 | 26.7% |
| 5 | 399 | Left Center | 22 | Denver | 105.5 | 20 | 31.9% |
| 6 | 406 | Center | 29 | Denver | 102.4 | 34 | 64.9% |
| 7 | 408 | Center | 26 | Denver | 105.5 | 25 | 77.8% |
| 8 | 414 | Left Center | 29 | Denver | 104.7 | 29 | 78.1% |
I’d honestly count each and every one of these as potential candidates. Watch the video of the 414-foot shot:
He hits it 414 feet and it lands on the freaking warning track. That’s how enormous Coors Field is. It’s nuts. That’s a home run pretty much anywhere. If even half of these ended up home runs Dahl would have 9 or 10 home runs while batting .318 and we’d be raving about what a breakout player he is.
While this is by no means conclusive it seems pretty obvious that the ballpark a player hits in can greatly affect results. This is the perfect example of digging deeper into base stats to add additional context.
This is not meant to be definitive, but it can absolutely be a tool in our toolbox that can shine a better light on how we understand power hitting and the various factors that are out of a player’s control. Next week I’m going to take a look at the reverse and see if there are ballparks that tend to elevate a player’s doubles into home runs and find some players that have benefited from it.
(Photo by Cliff Welch/Icon Sportswire)

“For those unfamiliar with Boston’s home park, this is the fabled Green Monster.”
Everyone reading this knows the green monster. Just a FYI, as it kind of throws off the flow when you talk to us as though we don’t know basic things.
Love your work in general, just constructive criticism.
Thanks so much for the feedback and for reading, I’m really glad you like my work! That’s absolutely, totally fair. I often think one of the harder things sometimes when writing these is drawing that line between assuming my audience knows too much or that they know too little, I just overcompensated in the latter direction. Once you point it out I totally see it. I’ll try to keep an eye on it in the future! Thanks again!
How does this mix with the juiced ball and the record # of home runs this year?