Chad Pinder, closing in on his 27th birthday later this month, doesn’t have a particularly eye-catching professional resume. The right-handed utility man’s career rate stats, spread across partial seasons from 2016 to 2018, rest at a decent-yet-unspectacular .247 batting average and .441 slugging rate. His minor league numbers look similarly passable, with a career .781 OPS on the farm. He’s also never hit more than 16 home runs in any professional season.
But there is much more than meets the eye with Pinder. Inconsistent playing time, coupled with a large serving of bad luck at the MLB level, is obscuring the potential of a player who has 30+ home run upside. While his major-league slugging rates don’t jump off the page, they’re backed by Statcast figures that put Pinder in the upper echelon of the game’s power hitters. Moreover, a natural third baseman out of college that converted to a shortstop in the minors, Pinder is athletic enough to play at every position on the diamond. This versatility has already endeared itself to Oakland Athletics manager Bob Melvin and it is a quality that will allow Pinder to amass significant plate appearances on a stacked Oakland roster.
Pinder’s progression reminds me of another Oakland late bloomer: Josh Donaldson. Both players possess alike handedness, size, and positional background, as well as a similarly slow ascent to MLB relevance. After showing promise in the low minors, Donaldson’s career looked in doubt after he posted a below-average AAA season as a 25 year old in 2011. Undeterred, he re-tooled his swing and, a mere two years later, concluded the 2013 season with an MVP-caliber 7.2 fWAR for the Athletics.
Pinder, fresh off winning MVP of the AA Texas League in 2015, posted a disconcerting 93 wRC+ in AAA as a 24 year old in 2016. But he rebounded the following season and forced his way onto the Athletics roster, swatting 15 home runs in 309 plate appearances. He followed that up in 2018 with another 13 home runs in 333 plate appearances, with improved plate discipline and overall offensive performance to boot.
Given his already-strong power figures, combined with plate discipline that has shown consistent improvement, Pinder is poised to take the next step in 2019: advancing from a novelty player to a top-flight hitter. And while he probably won’t reach the same heights as Donaldson—few players do—Pinder will establish himself as a force to be reckoned with inside an already intimidating Athletics lineup.
Big Boy Pop
Since 2017, Pinder has amassed an impressive 28 home runs through 642 plate appearances. One of those home runs was a 460-foot (or 483-foot, depending on the source) blast to left center in Oakland that measures as one of the longest homers ever hit in Oakland-Alameda County Coliseum’s 55-year history.
https://gfycat.com/tameneighboringhuemul
Pinder’s May 2017 two-run jack marked just the fourth time in Coliseum history that a player reached the second-level plaza section of center field, with Mark McGwire, Larry Walker, and Jarrett Parker serving as the previous qualifiers.
While we shouldn’t overanalyze one home run, Pinder’s ability to send a ball 460-480 feet to center field during a game indicates that he possesses a high power ceiling. The aforementioned Donaldson agrees, tweeting that Pinder has “big boy pop.”
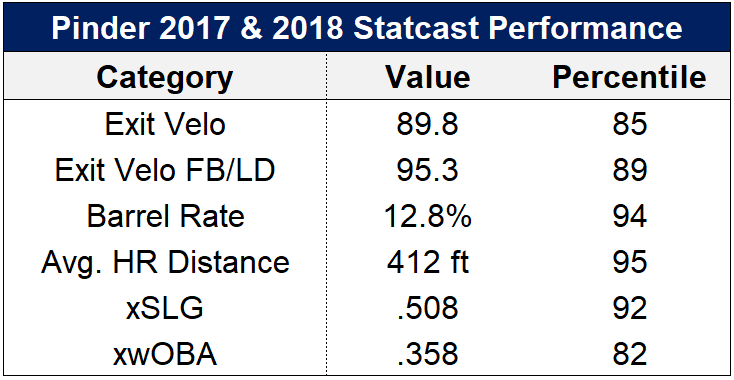
Statcast also agrees with that sentiment. Over the last two years, Pinder is in the 80th+ percentile in virtually every relevant batted ball authority metric and xStat. Perhaps most impressively, his 12.8% barrel rate ranks in the 94th percentile, supported by an exit velocity on fly balls and line drives that ranks in the 89th.
His .508 xSLG checks in ahead of names like Donaldson, Francisco Lindor, Christian Yelich, and Gary Sanchez. Pinder’s xwOBA, an all-inclusive stat that accounts for walks and strikeouts in addition to batted ball authority, clocks in a bit lower at 82nd percentile due to his 28% strikeout rate since 2017. However, despite issues with plate discipline, Pinder’s expected aggregate offensive performance still exceeded that of Jose Altuve, Mitch Haniger, Carlos Correa, and Daniel Murphy in that span.
Bad Luck?
Most of the players mentioned above have vastly outperformed Pinder in the box scores over the last two years. Unfortunately for Pinder, his actual slugging percentage and wOBA significantly trail his expected numbers.
Out of 299 qualifying hitters since 2017, Pinder’s wOBA minus xwOBA differential is the sixth worst in baseball. Pinder’s neighbors at the top of the list are a mixture of Detroit Tigers players—who reside in a home ballpark that likely overestimates xStats—and older hitters who underperform their xStats because of slow foot speed and significant shifting.
Pinder, as a young righty with decent speed and a well-rounded spray chart that doesn’t draw many shifts, seems like an outlier. What gives?
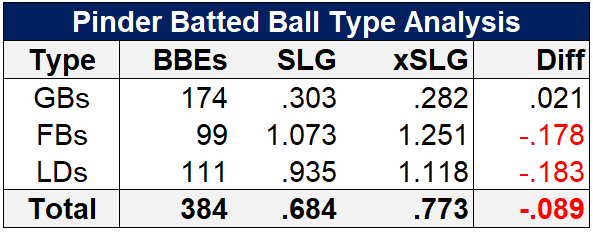
The explanation lies in a severe underperformance in slugging rate on fly balls and line drives, with Pinder’s actual SLG trailing his xSLG by approximately 180 points for both batted ball types.
My first thought was that perhaps Pinder’s home ballpark is to blame, converting a disproportionate share of well-hit flies and liners into outs. But that doesn’t seem to be the case. Fellow Athletics righties Khris Davis, Matt Chapman, Marcus Semien, and Mark Canha do not suffer from the same issues, actually outperforming their xSLG in aggregate since 2017. Oakland Coliseum also displays a fairly neutral overall park effect on fly balls and line drives.
The next question is if there is some systemic issue in Pinder’s fly ball and line drive profile, or if he’s simply the recipient of some bad luck over one full season’s worth of plate appearances.
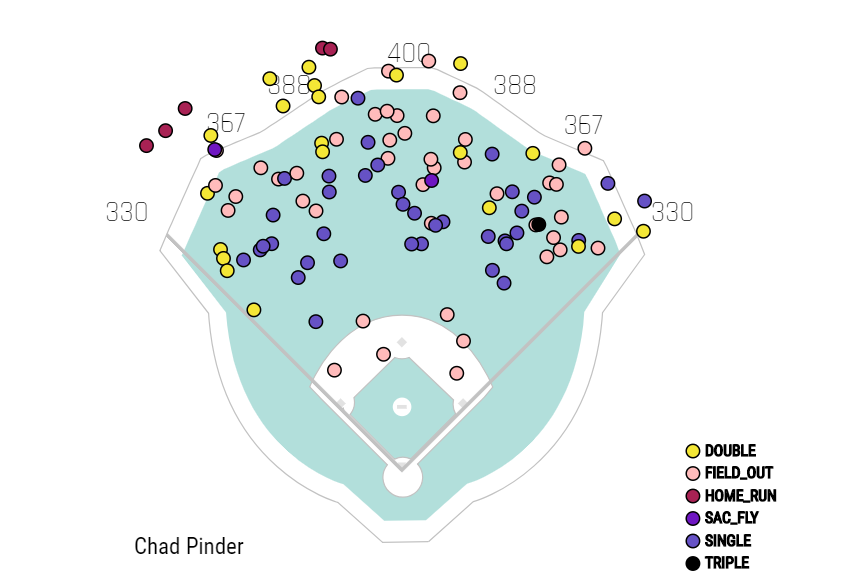
The above spray chart highlights all of Pinder’s line drives over the last two seasons. Based on the differential between his AVG and xAVG, he was likely short-changed by five or six hits. While combing through the highlight videos on Pinder’s line drives, you see a lot this:
https://gfycat.com/GivingCaringKusimanse
It’s also possible that Pinder might have also been robbed of some home runs to left center on liners, instead only achieving doubles, but it’s difficult to see how this would necessarily persist going forward. I would bet on Pinder’s line-drive SLG regressing closer to his xSLG going forward.
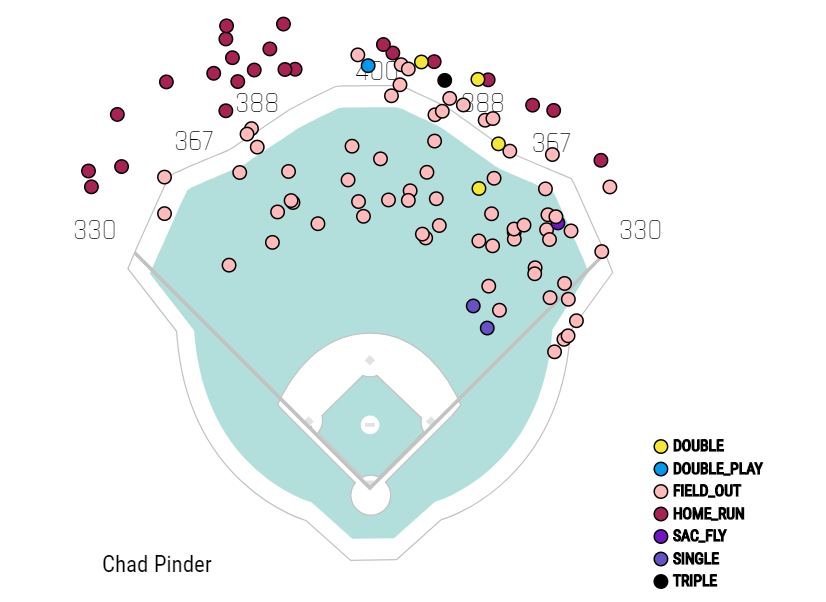
Pinder’s fly-ball spray chart might tell a slightly different story, accentuated by a cluster of field outs to deep and right center. Baseball Savant’s xStats make no adjustment for the direction a ball is hit, meaning that a 110 mph, 380-foot flyout to center is valued identically to one that sails over the right field wall for a home run. Could Pinder be sending a disproportionate share of his hard contact to the deepest parts of the ballpark, a bias that could result in serial xStats underperformance?
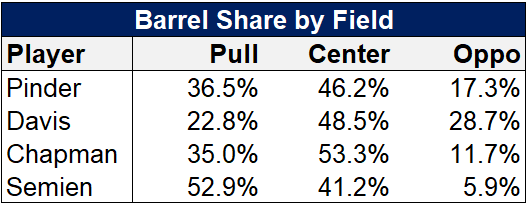
It’s difficult to say. From a visual standpoint, it certainly seems like Pinder hit a fair amount of fly balls to deep center. But Pinder’s share of barrels (balls hit at the ideal exit velocity and launch angle for extra-base hits) to center field, at 46.2%, isn’t substantially different than his fellow righty-swinging teammates. He also hits a greater share of his barrels to the pull side—the best area of the field to hit home runs—than perennial sluggers Davis and Chapman.
This will be a situation to monitor going forward in 2019; however, there is no conclusive evidence that Pinder is doing anything to warrant the significant gap between his actual and expected readings in slugging percentage and wOBA. Fluky things can happen in small sample sizes and Pinder’s 642 plate appearances in 2017 and 2018 are not nearly enough to tease out the role of luck in his batted ball performance. For instance, Manny Machado underperformed his xSLG by 46 points in 2017, only to overperform by 22 the following year. If Pinder can retain his xSLG and xwOBA levels in 2019, he will likely see a big increase in production from positive regression alone.
Swing and Miss
In addition to some bad luck, Pinder’s batting line has been tempered by difficulties making contact, evidenced by a career 27.8% strikeout rate and a 13.9% swinging strike rate. While owning a strikeout rate in the high-20% range is increasingly common in today’s landscape, it puts undue pressure on batted-ball performance to drive offensive value. If Pinder could bring his strikeout rate closer to the MLB average of 22%, his offensive production would increase substantially and also prove more consistent on a week-to-week basis. While shaving five percentage points off a strikeout rate is no easy task, there is reason to believe that Pinder is heading in the right direction.
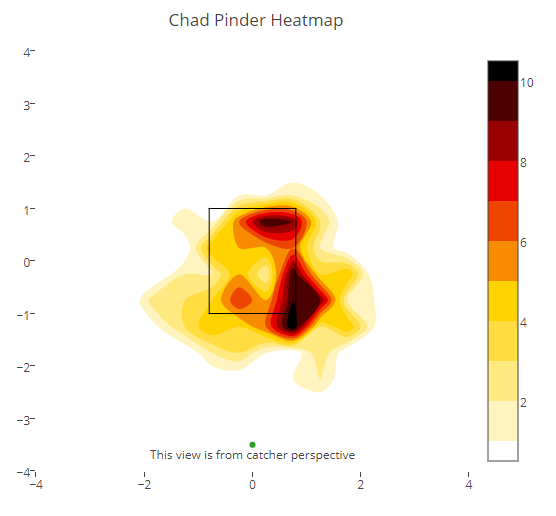
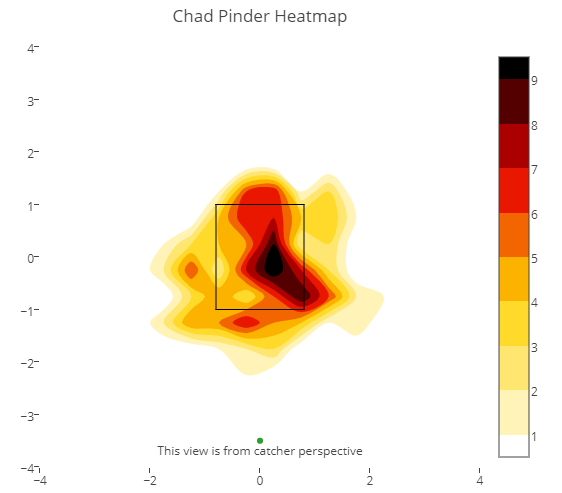
In 2017, Pinder struck out at a 29.8% rate with an unsightly 0.20 BB/K ratio. He improved those metrics to 26.4% and 0.31, respectively, last season. Pinder’s year-over-year improvement was based on a more selective approach to swinging at breaking pitches off the plate, as his whiff rate on breakers dropped from 37.7% to 30.1%. Heatmaps of Pinder’s whiff tendencies, with 2017 and 2018 represented below, highlight this phenomenon.
Notice how the large, dark area just off the bottom right part of the plate reduced significantly from year-to-year, a result of his whiff improvement on sliders and curves down and away. However, 2018 wasn’t all roses for Pinder, as he struggled to make contact on fastballs in the strike zone. Pinder’s fastball whiff rate of 25.3% is well above the MLB average of 19.2%. Pitchers started to wise up to Pinder’s occasional struggles against fastballs, increasing their usage rate from 58.3% to 60.0% from 2017 to 2018.
I’m confident that Pinder can improve in this regard with more time and experience. First off, and perhaps most importantly, he is a cerebral player who is aware of and trying to actively remedy his flaws, as highlighted in a December 2018 interview with FanGraphs’ David Laurila. Secondly, I believe that Pinder possesses an advanced batters eye, despite what his early-career strikeout rates might show.
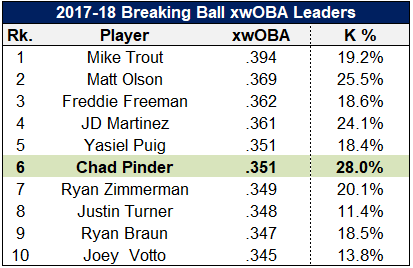
Over the last two years, Pinder owns the sixth-best xwOBA against breaking balls, surrounded by impressive company in the top 10. The ability to hit breaking pitches is indicative of a hitter with a refined approach, one who is able to react to what is being thrown rather than just employing guesswork. It would stand to reason that these players would strikeout less in general. Surveying the strikeout rates of the rest of the hitters in the top 10 supports this view, as a majority rest in the teens or low 20% range. Pinder’s 28.0% strikeout rate stands out on the high end.
Pinder’s 2019 showing in the Cactus League gives further reason to believe he can cut his strikeouts going forward. In 34 spring plate appearances, Pinder struck out a mere two times, for an absurdly low 2.9% rate. Daniel Rosenheck, a writer for The Economist, produced research in 2015 showing that changes in several spring stats, particularly hitter strikeout rate, can be predictive of future regular season improvement. Although it’s only 34 plate appearances, the fact that Pinder’s spring strikeout rate improvement is so extreme gives hope that he has discovered a lower long-term baseline moving forward.
Conclusions
Chad Pinder, in spite of mediocre surface-level minor and major-league stats to date, profiles as a definite breakout candidate heading into 2019. Over his first two years in the bigs, Pinder punished baseballs with the acumen of an advanced power hitter, scoring 85th+ percentile showings in most meaningful Statcast metrics. The central reason his career MLB OPS rests at an unexciting .753 is related to the poor luck he’s received on balls in play, with slugging and wOBA reading well below their expected levels. Pinder stands to improve in all the meaningful counting and rate stats in 2019 based on positive regression alone; however, if he adds improved plate discipline into the mix, the sky is the limit.
Featured Image by Justin Paradis (@FreshMeatComm on Twitter)

I’ve been struggling between Pinder and McMahon in OBP league. Pinder’s 3B elig is sneaky. Your article says it all. Make the swap?
Go with Pinder. He has 28 HR in one full season’s worth of PA and great Statcast figures. Meanwhile, McMahon is a complete wild card at the MLB level.
It certainly looks like Pinder will get an even greater opportunity to display his prodigious pop with Olson going down. Here’s hoping he takes advantage of it.
That 405-foot “double play” dot is just cruel.
Great stuff. Pinder has moved to the top of my “potential adds” list.
However, is a 1.7% increase in fastballs statistically significant? He saw 1,209 pitches last season, so +1.7% is, in effect, 21 extra fastballs over 110 games.
Good catch! It’s certainly not a huge jump, but I think it was indicative of the scouting report getting out on him a bit. He’s certainly not bad against fastballs overall (roughly league average), but he’s a much better breaking ball hitter relatively speaking (top 10).
Wow- just checked and in my league he qualifies at that most barren position (after catcher), second base.
Many thanks…
You like Pinder more than B.Lowe for 2019?
They’re similar players, but I like Pinder more because of the solid baseline he’s established at the MLB already.
Would you dump Asdrubal Cabrera for Pinder?
Yes. Cabrera is very underrated this year, but think Pinder has better upside.
Is Pinder a good add in a 10 team league if i need HRs and RBIs from the 2b slot?