Pitch tunneling has become a polarizing topic in the game of baseball and something that has become more prevalent in recent years. There is no dictionary definition for the term, but luckily, some very smart people have been able to put it into layman’s terms. As SABR President Vince Gennaro describes it: “Think of a pitcher that has two different pitches in his repertoire that he throws out of a very similar release point and their pathway initially is very similar but at some point they diverge significantly.”
Essentially, pitchers are disguising pitches and putting hitters even more on their heels, as if hitting weren’t difficult enough already. Just take a look at the image below:

Business Insider released a great video on the science of hitting a 95 mph fastball. The green area above is the amount of time (125 ms) it takes for a hitter to gauge a pitch. Absurd. It takes 300-400 ms just to blink.
In a recent study, Contribution of Visual Information About Ball Trajectory to Baseball Hitting Accuracy, published in Plos One, researchers from multiple universities in Japan stated that: “As a pitched ball travels near the home plate, the angular velocity of eye movement required to track the ball exceeds the physiological limit of the human eye [12,26].” Now, add pitch tunneling to the long list of advantages a pitcher has in any given at-bat. While hitters are relying on anticipating trajectories to determine pitches, pitchers are working feverishly to throw off hitters’ timing.
Tunneling is just another reason to get lost in the wormhole that is pitching concepts, and boy, did I get lost. It took a ton of research, film, graphs, and images for me to really get an understanding of the concept. Fortunately, some great baseball minds have put out a ton of information on pitch tunneling that I will link at the end of this article.
The objective of my research is to identify starting pitchers around the league who were exceptional at pitch tunneling in 2018. I landed on a couple guys you would expect to be on a list like this and one you probably would have never guessed. I also aim to display ways to understand pitch tunneling through multiple types of GIFs, plots and images that may help forward research down the road.
Disclaimer: You may not be familiar with some of the terms in this article, so I’d like to define them before we delve deeper. Thanks to Baseball Prospectus for making a difficult concept seem somewhat understandable:
Release distance — This stat tells us exactly how far apart two back-to-back pitches are released. This is the true distance between pitches, meaning it is the exact amount of space between the ball on release.
MLB Avg.: 2.60 inches.
Pre-tunnel max(imum distance) — This stat tells us the distance between back-to-back pitches at the decision-making point, as seen from the batter’s point of view. This is the perceived distance between the pitches as seen from the batter’s viewing angle. Becuase this isn’t the exact distance between two pitches, it will sometimes be smaller than the release distance.
MLB Avg.: 1.54 inches.
Pre-tunnel max time — This stat tells us when the second pitch in the pitch pairing is at its greatest perceived distance from the one preceding it. With the shift to earliest and greatest differential, this time tells you how much remaining flight time the pitch has before reaching the plate. This number will always be greater than 0.150 (or 150 ms), and the closer this number is to 0.150, the later the pitches separate in flight.
MLB Avg.: 0.169 (169 ms).
Plate distance — This stat tells us how far apart back-to-back pitches are from each other at home plate. This is the true distance between the pitches at the plate.
MLB Avg.: 18.2 inches.
Flight time differential — This is the absolute value of the difference in the flight time between the two pitches under consideration. As a result, this provides an insight into how a pitch changes speeds between back-to-back pitches by looking at the total flight time of Pitch 1 vs. Pitch 2.
MLB Avg.: 0.026 seconds (26 ms).
Plate: PreMax ratio — This ratio highlights the difference between the perceived distance prior to the tunnel point and the true distance at the plate for the second pitch in a pairing. This ratio highlights how much of a pitcher’s difference in plate location comes from movement after the batter’s decision-making point.
MLB Avg.: 11.9 (11x).
https://gfycat.com/leanthickayeaye
| Player | RelDist | PreMax | PreMaxTime | PlateDist | FTimeDiff | PlatePreRatio |
| Bumgarner | 1.13 | 1.61 | 0.171 | 18.94 | 0.0313 | 11.8 |
Madison Bumgarner is one of the best in the business when it comes to pitch tunneling (HM: Jon Lester). The number that jumps out here is his RelDist, which was approximately 1.5 inches less than league average, something special. Imagine being Brandon Dixon, stepping into the box against MadBum and seeing this changeup (83.3 mph), curveball (77.1 mph) sequence that are coming from almost the exact same plane. Filthy.
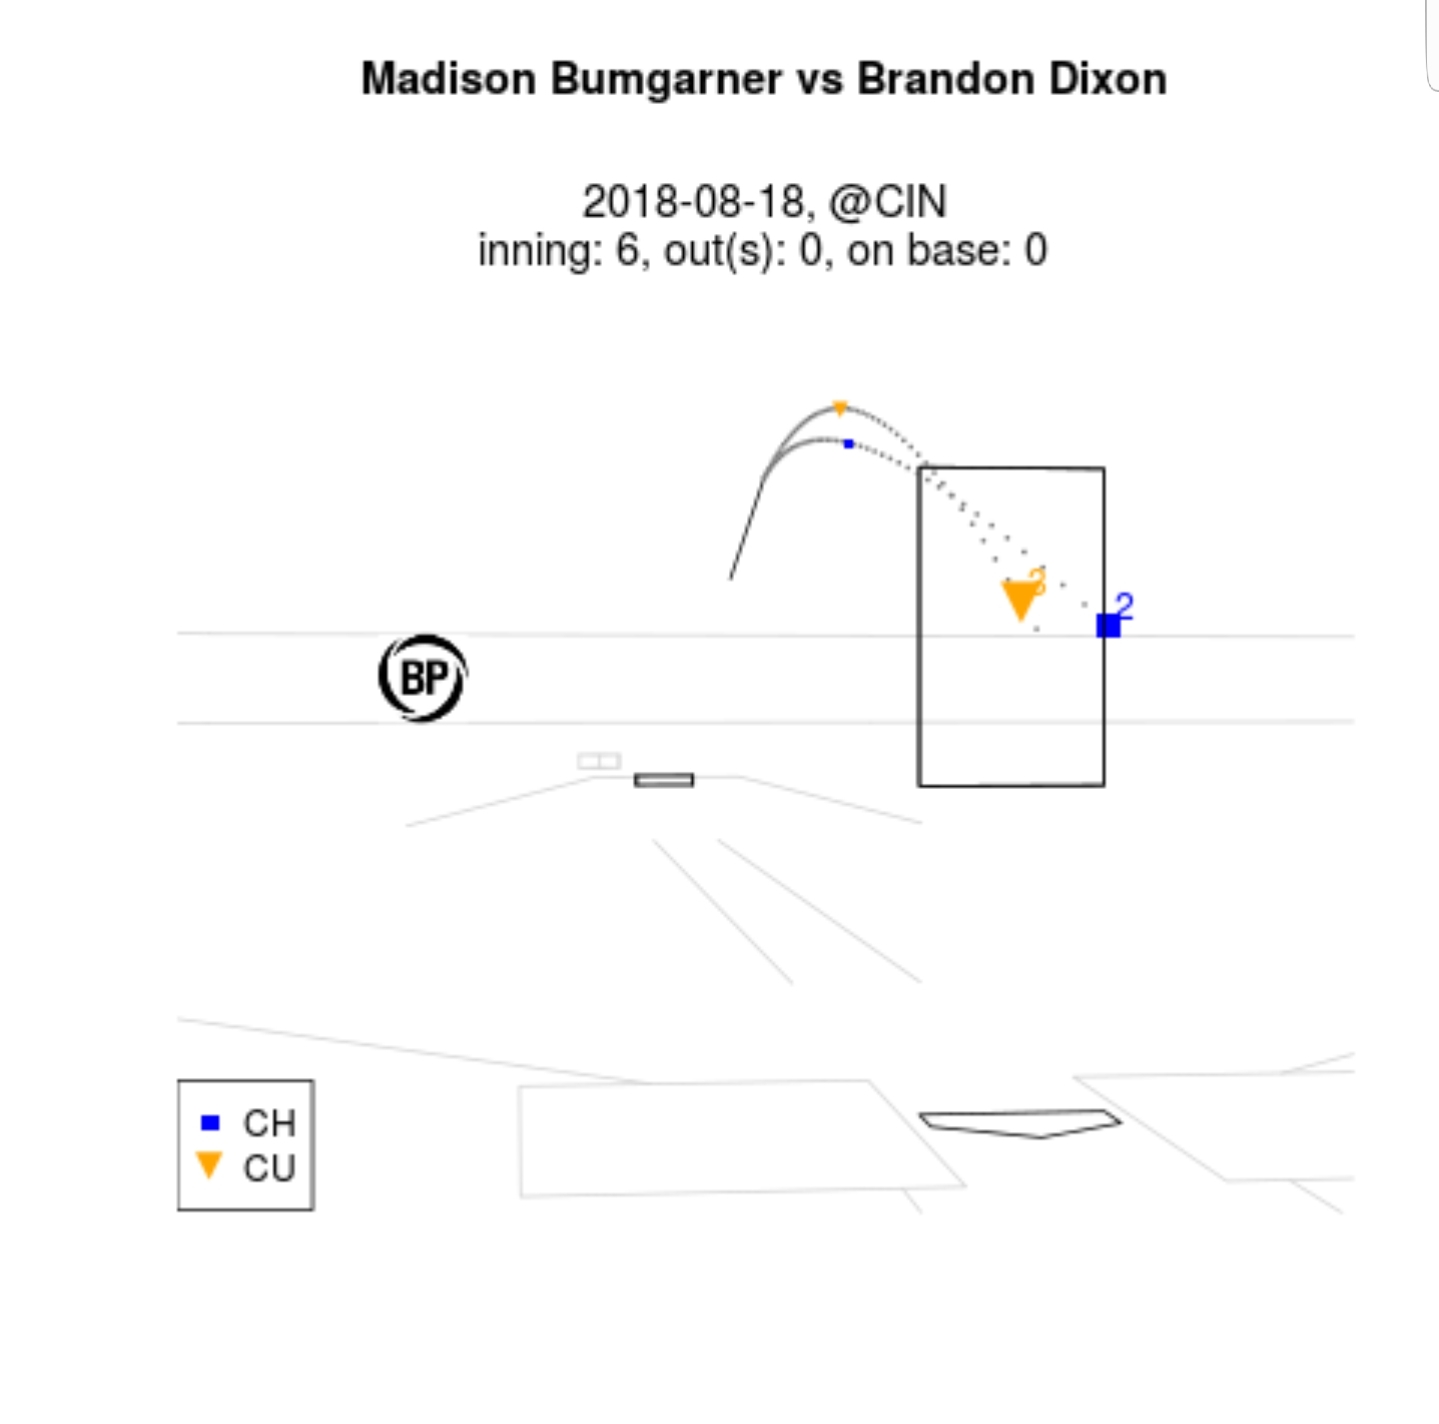
This is a really cool feature on Baseball Prospectus called the Interactive Matchup Tool. The grey dots are the flight path, while the shape indicators represent the tunnel point for each pitch. Digging deeper into this Dixon at-bat, you can see that the flight paths for each pitch overlap with each other while the tunnel points are almost touching but have totally different landing spots. Pitch tunneling at its finest.
https://gfycat.com/softlawfuliguana
| Player | RelDist | PreMax | PreMaxTime | PlateDist | FTimeDiff | PlatePreRatio |
| deGrom | 1.36 | 1.31 | 0.166 | 17.09 | 0.0178 | 13.1 |
It would only make sense for the reigning National League Cy Young Award winner to be elite at pitch tunneling, right? With a 0.0178 FTimeDiff, Jacob deGrom sits more than 8 ms less than the average pitcher. That means that the flight time between any two of his pitches is so minimal that the batter has an even less chance to make contact.
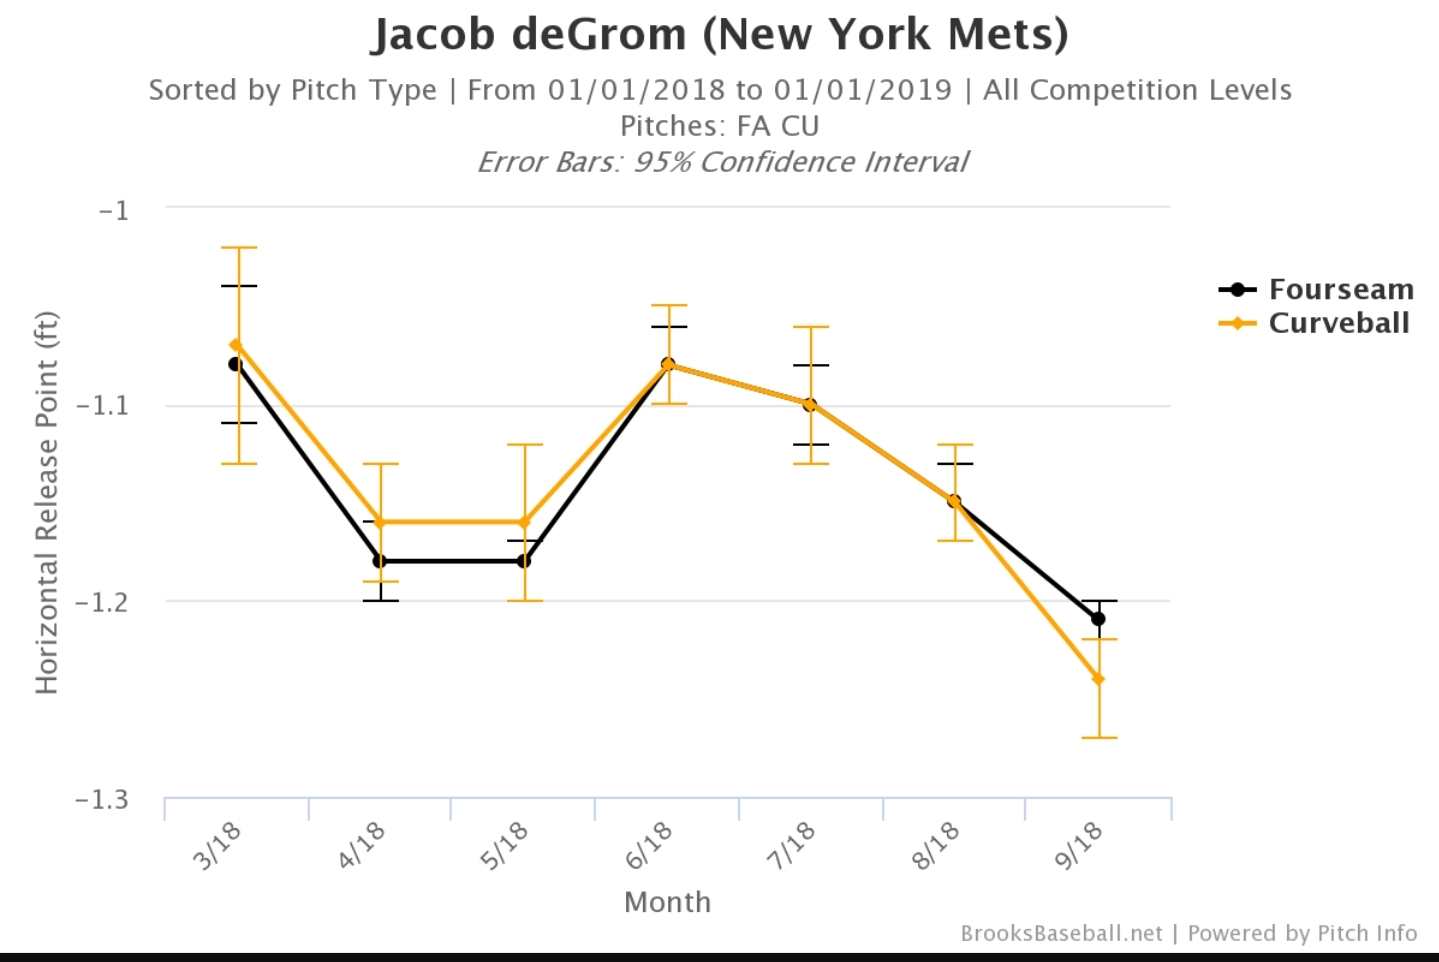
Like Bumgarner, deGrom was also extraordinary in the RelDist category. If you log on to Brooks Baseball, you can decipher the release points (horizontal or vertical) for each pitcher down to each pitch. As you can see in the graph above, deGrom really mastered this concept from June on. The horizontal release point between his fastball and curveball (the two pitches displayed in the GIF) were identical for three consecutive months. Try guessing right against that.
https://gfycat.com/frayedmelodicgadwall
| Player | RelDist | PreMax | PreMaxTime | PlateDist | FTimeDiff | PlatePreRatio |
| Bieber | 1.20 | 1.59 | 0.172 | 17.81 | 0.0302 | 11.2 |
Shane Bieber is an interesting case study being that he is only 23 years old with just 114.2 major league innings under his belt. After hours of research, I realized how uncommon it was for a guy this young to be this good at pitch tunneling. Like deGrom, Bieber’s best pitch tunneling comes with the use of his fastball and curveball. It is astonishing to think that the break on the curveball above to Yoan Moncada came from the same path as the fastball that ends up middle away.
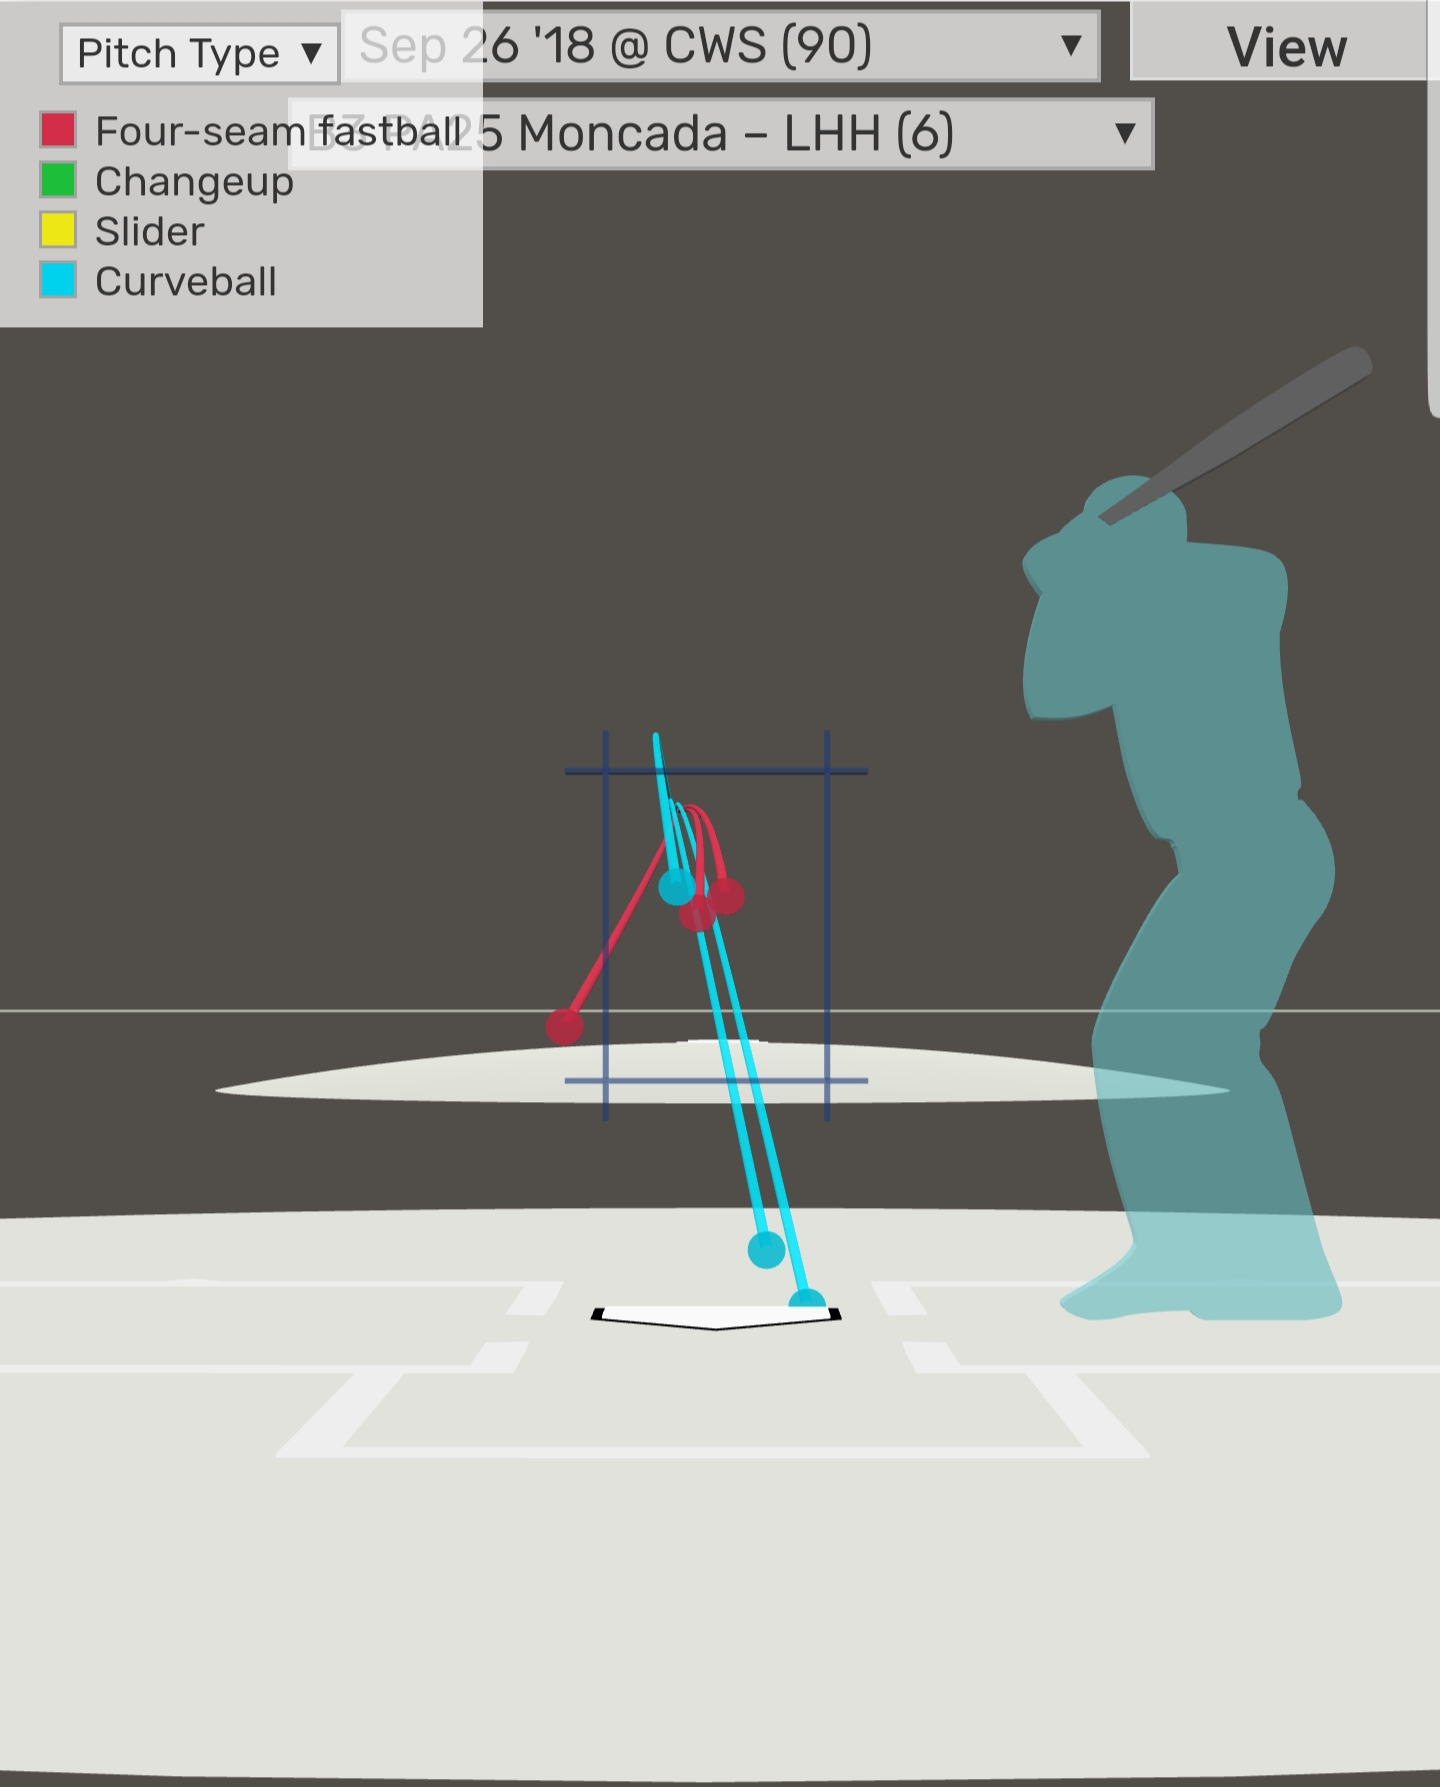
Ahead of the curve like always, Baseball Savant has an unbelievable feature on Statcast called 3-D pitch visualizations. You can toggle the views between umpire, catcher, pitcher, RHH, LHH, overhead, zone and even the first- and third-base sides. The image above is from the LHH view of Moncada. Almost all of the pitches in the graphic are coming from the same tunnel, to the point where it became a guessing game for Moncada. Bieber Fever, everybody.
https://gfycat.com/shadyjubilantfowl
| Player | RelDist | PreMax | PreMaxTime | PlateDist | FTimeDiff | PlatePreRatio |
| Strasburg | 1.23 | 1.55 | 0.170 | 18.51 | 0.0267 | 11.9 |
This might be my favorite GIF of them all (sorry, Anibal Sanchez). It’s hard enough for a pitcher to get a hit in general, but when you have a guy showing fastball (94.3 mph) followed by a curveball (80.6 mph) at the knees that follow through the same tunnel — SHEESH. Just from the human eye, you can see that the curveball starts in the same place as the fastball, does a little bit of dancing and ends up landing in almost the exact same spot. Disgusting.
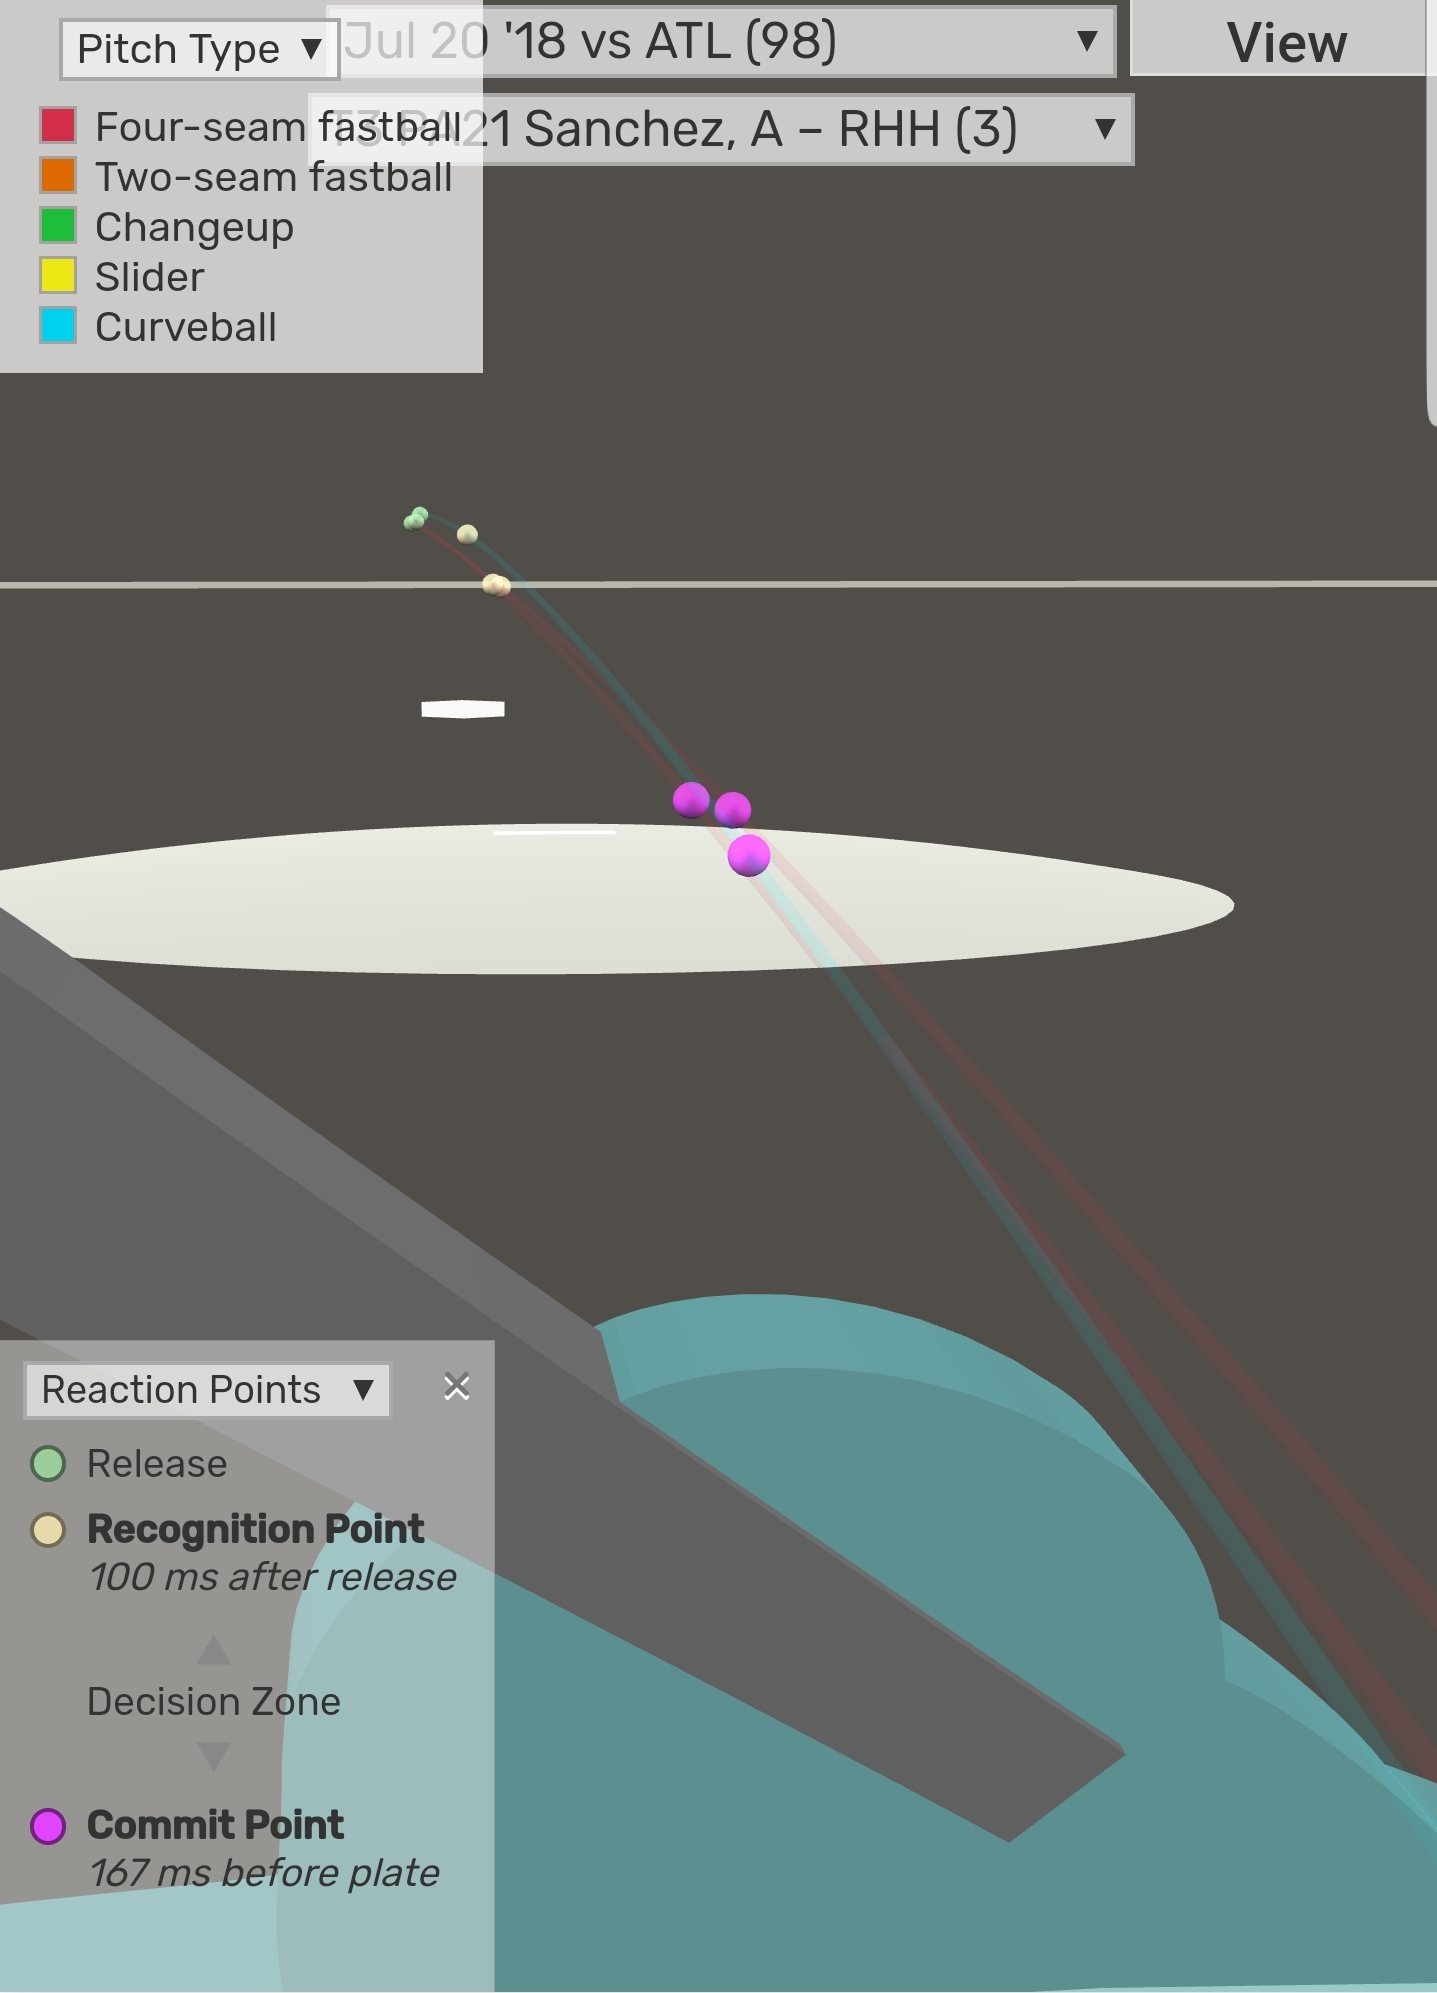
Using Statcast’s 3-D pitch visualizations once again, this time using the reaction points feature, it gives you a little more insight into the mind of the hitter. This image not only shows you the release point but also the recognition point, the decision zone, and the commit point. If you follow the faint blue and red lines in the image, you can see that by the time Sanchez has to commit to a decision the different pitches look exactly the same. Magic.
https://gfycat.com/bothsandyauk
| Player | RelDist | PreMax | PreMaxTime | PlateDist | FTimeDiff | PlatePreRatio |
| Gaviglio | 1.32 | 1.62 | 0.165 | 18.20 | 0.0182 | 11.3 |
I was just as surprised as you to see Sam Gaviglio appear on any RelDist list. Not only that but his PreMaxTime and FTimeDiff were both better than league average. It was also pretty interesting to see him on this list because he primarily shows two pitches, neither of them being a four-seam fastball.
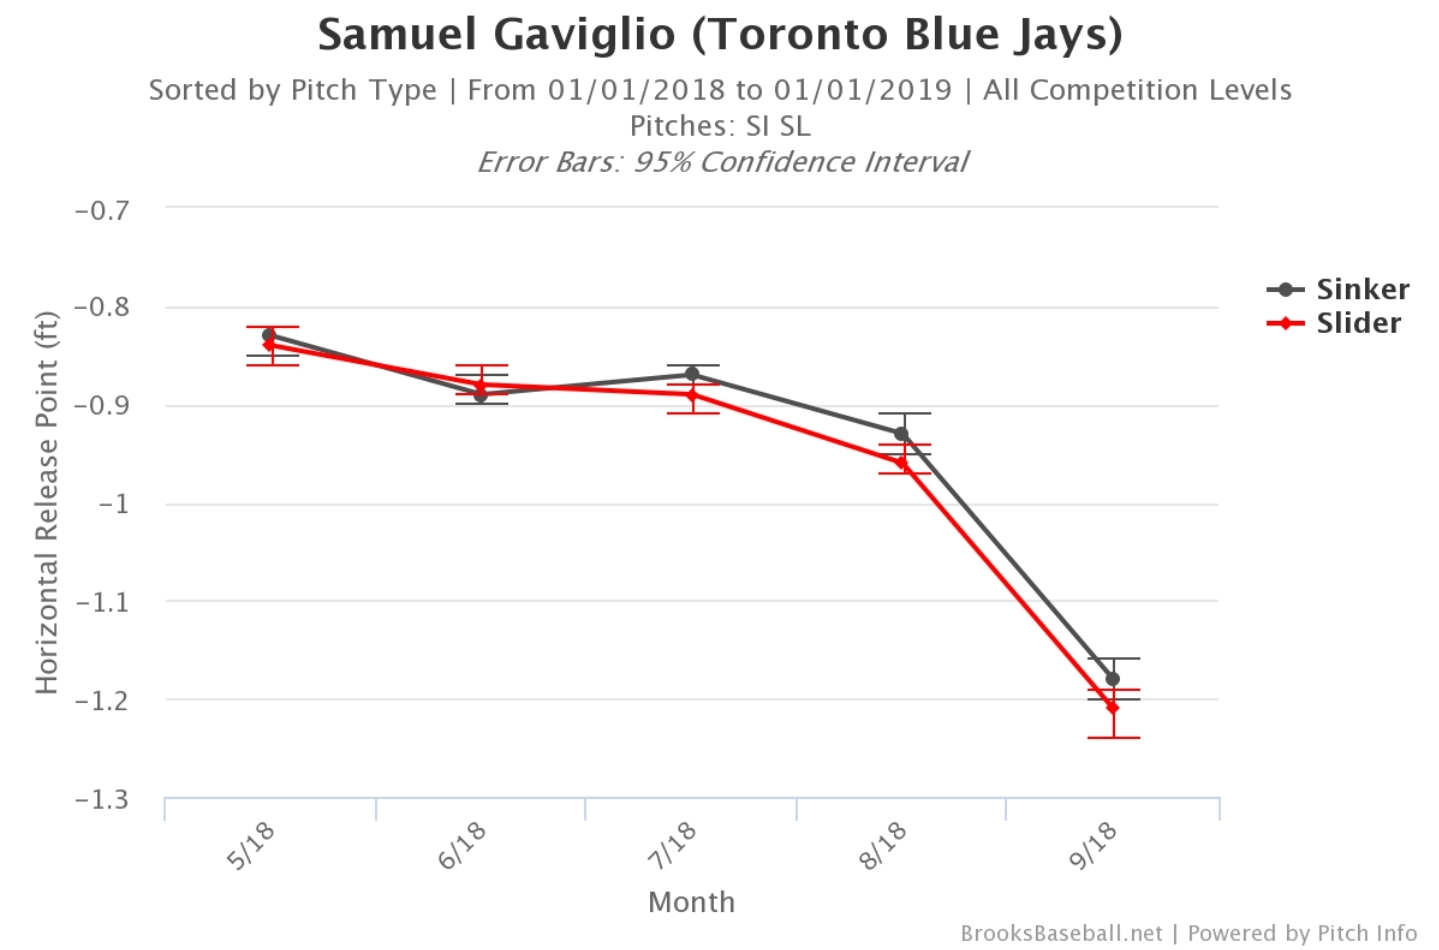
Gaviglio doesn’t have any success with his sinker (-15.4 pVAL), but it may be the reason his slider (5.2 pVAL) is such a good pitch for him. The release points are essentially the same, and it’s pretty evident he disguises his good pitch with his bad one. Just another layer to peel back when discussing pitching concepts.
Conclusion
Hopefully I made it easier for you to understand the concept of pitch tunneling a little bit more than you did before reading this article. Also, I hope that I brought to light some really cool interactive tools that you can find on various baseball websites.
If you are intrigued by the idea of pitch tunneling, Nick Pollack wrote a great article on ranking baseball’s center-field camera shots. You can utilize this to enhance your viewing experience of pitchers and even the pitch tunnels they are using.
This is not an easy skill for pitchers to learn, however. Daniel Mengden of the Oakland Athletics told me that pitch tunneling is “extremely hard to learn and maintain throughout an entire outing.” While this is a relatively new concept, it is evolving rapidly. By this time next year, I’m sure somebody out there will have made significant strides in the research, and it will give another aspiring writer and baseball fan like myself something to analyze.
That’s the beauty of baseball: The game is always changing. Cleveland Indians outfielder Greg Allen told me, “just as they adjust, hitters will as well,” and it seems that will be the case until the end of time.
Thank-yous
Without the GIFs, editing, feedback, insight, and images from the people below, I would not have been able to write this article:
Michael Augustine (@AugustineMLB)
Dave Cherman (@DaveCherman)
Justin Paradis (@FreshMeatComm)
Daniel Mengden, Oakland Athletics
Greg Allen, Cleveland Indians
Vince Gennaro, SABR President
Nick Pollack (@PitcherList)


Mike – this is truly some fantastic stuff.
What do you think is the most important stat here? By my read, it’s PreMax Time.
It might also be helpful to see some examples of bad tunneling to get some perspective on the difference.
Interestingly enough, it’s not just subpar pitchers that are on the bottom of the RelDist list. You have your guys like James Shields but you also have your guys like Joey Lucchesi. Keep in mind this isn’t the be-all-end-all when projecting a pitchers success. Just another layer.
Awesome question.
In my opinion, it would be between PreMaxTime, FTimeDiff or RelDist. The reason PreMaxTime is so important is because it messes with the hitters timing so much. FTimeDiff can really keep the hitter on their heels by making their commit “window” even smaller. I consider RelDist the first stop in the assembly line.
I’m not sold on pitch tunneling as anything more than a photocopy repeatable delivery without changing focal point, and possessing the required stamina to do so. It’s simply starting every pitch with the same initial trajectory, and that is done by repeating delivery perfectly, and not using different focal points for different pitches.
This is why maddux was so incredible throwing 89, max, and how mo became the goat with but one pitch. Late break kills. Big break is sexy, but you pretty much give up the ability to disguise trajectory (the whole “this guy is getting by on his stuff” thing).
Anyway, I just think pitch tunneling is a way to put a term on the skill of having the exact same delivery and release on every pitch.
…if only lester could do this throwing to first.
You’re addressing the RelDist, which is obviously where it all begins, but it’s a small part of the skill. Part of what makes deGrom so incredible is his Flight Time (driven by his elite velocity). He not only has a tremendous RelDist, but his flight time plays a role in the distance that the pitches remain disguised INSIDE THE TUNNEL. Zack Wheeler also does an excellent job of this with his four seamers/slider/splitter and Trevor Bauer has tremendously long tunnels with his high fastballs and knuckle curves.
If you throw the pitches from the same release point but they split recognizably before those 150ms have expired, good hitters will see that and have success. So, as important as release point is, it’s still a small skill inside of the larger skill of tunneling. And to Mike’s point, it’s an INCREDIBLY tough skill to master that very few are are beginning to.