(Photo by Kevin Abele/Icon Sportswire)
Jon Gray currently has a 2.1 WAR, good for 12th in baseball for qualified pitchers. He’s averaged about 2.5 wins in his 3-plus seasons with the Colorado Rockies and holds a 99 ERA- and a 77 FIP-. So far in 2018, Gray has the highest ERA of any qualified starter in baseball as well as the lowest LOB% (61.2%, league average 73%). He also has the highest ERA-FIP difference (2.74) which is a much larger spread than the pitcher that follows him. His current SIERA is top-20 caliber making his ERA even less legitimate.
Too weird to ignore.
To start, let’s check in on his ERA/FIP trends for 2018. When dealing with FIP, you recognize the three true outcomes and assume league-average defense that strips away any factor of luck. Gray has been striking out hitters more in 2018 but also issuing some extra walks. He’s allowing one home run per nine innings, just .08 higher than his average. Chart 1 demonstrates an early correlation between K/BB rate and ERA followed by another once he hit game 10. Notice the stabilized FIP that starts around game eight. Between games three and seven, we see Gray had an ERA/FIP bubble. His K/BB rate increased, then slowly returned to his career average, while his ERA continued to climb. Are we seeing the spoils of bad luck? Gray’s BABIP is really high; a good 0.30 ahead of the next stater’s average.
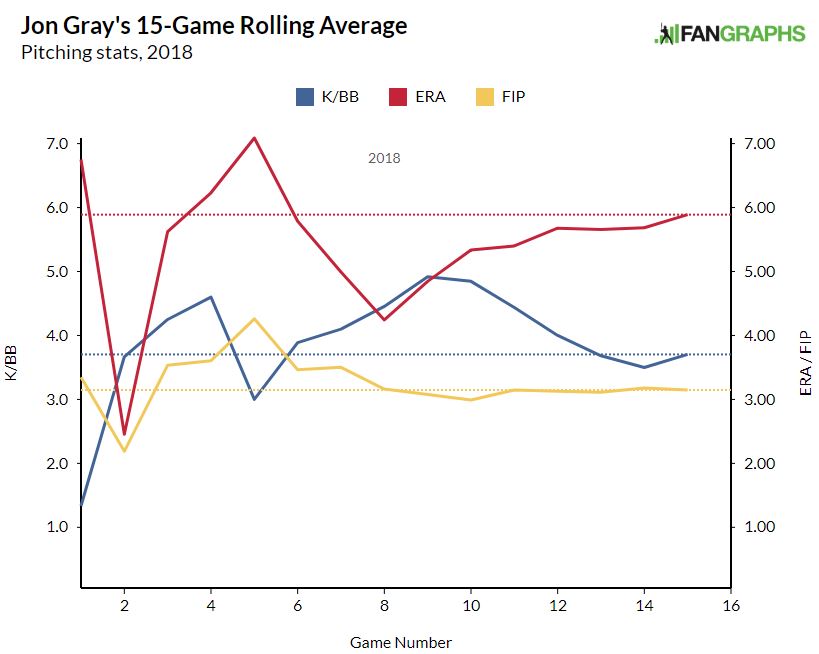
CHART 1
What about Gray’s BABIP in terms of contact type? Out of pitchers with at least 1000 pitches, his BABIP on line drives is about league average, top 30 when it comes to ground balls, and second with a .290 on fly balls. The latter is a big problem. He and leader Zack Wheeler (.300) are far ahead of the rest of the pack on fly ball BABIP; Aaron Sanchez follows them with a .216.
Part of the reason Gray was generally successful last year had to do with the fact that he induced a lot of ground balls and had a 28.4% hard-hit rate. This year, his grounder rate is down nearly 5% and his hard-hit rate has elevated roughly 7%. Giving up hard contact through the air is a recipe for disaster no matter where you pitch, but more so at Coors.
Is it his pitch selection that is attributed to the high BABIP? Chart 2 shows his arsenal hasn’t seen much fluctuation; not since earlier in the season, anyway. Keep in mind that BABIP isn’t steady game to game and that Gray’s BABIP on his three main pitches are all relatively the same.
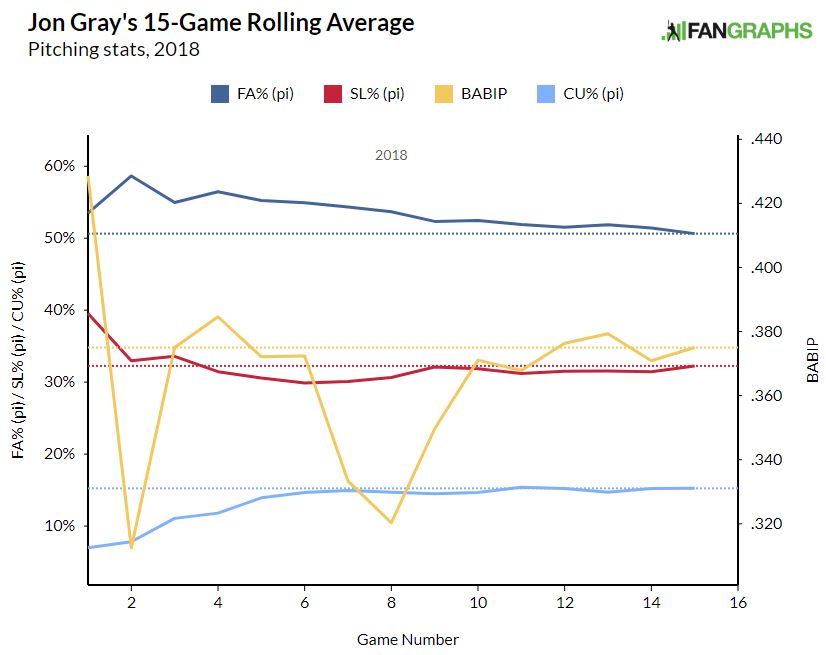
CHART 2
Gray throws primarily a four-seam fastball and slider but he mixes in a curve along with a few random changeups. This season, Gray has dropped his fastball usage by 7% in favor of his slider and a small bump in curveballs. That’s a wise decision as Gray’s fastball regularly produces a .300-plus batting average against. In his injury-shortened 2017 season, his fastball (-0.29 wFB/C) wasn’t as bad though not especially good, either.
Back in 2013, Eno Sarris had an interview with then Rockies starter Jhoulys Chacin where they discussed the need to pound breaking pitches at Coors because of the elevation factor.
Speaking of Coors, Gray is about 50/50 when it comes to starts this year and the current home/away ratios haven’t deviated much from his career splits, as you can see in Chart 3. The biggest difference is clearly the almost 2 earned run span between Coors and his road starts (he hasn’t been the victim of bad matchups, either). Gray has a nearly 3:2 split for his career when looking at home and away starts and doesn’t see a marked improvement when pitching as a visitor.
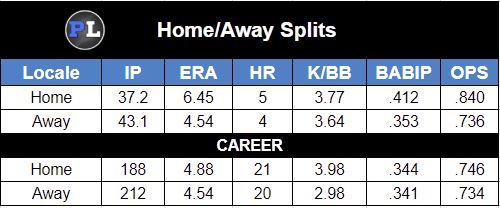
CHART 3
Knowing Gray’s fastball use, that got me thinking about how fastballs effects strikeouts and groundouts, both throughout the league and specifically at Coors. Using qualifying starting pitchers since 2015, there is a small positive correlation (13%) between fastball usage and strikeout rate while there is a better (negative) relationship (30%) between fastball usage and groundballs. Using that data against Coors Field shows slightly stronger relationships in both categories.
Sticking with the general theme of fastballs, the issue with Gray’s bears elaboration.
The league-average spin rate on a four-seam fastball is somewhere in the neighborhood of 2300 RPM. Gray’s fastball spin rate has fallen from 2082 in April (95.5 MPH), down to 2040 (95.1 MPH) in May, and the month of June has seen the spin rate drop to 1977 RPM (94.8 MPH). All of those spin figures are below league average. Lower spin rate simply means the ball will vertically break a lot more, almost mimicking a two-seam (or sinking) fastball. That decrease in spin rate from April to June comes with a 1% drop in SwStr%.
Making matters worse, there is no adjustment his release point to compensate for the decrease in spin; Chart 4 plots the minimal change in 2018. This is speculation but I’d assume that he’s not really placing the ball where he wants to once it gets to the hitter’s commitment point; it’s breaking into the sweet spot of the strike zone.
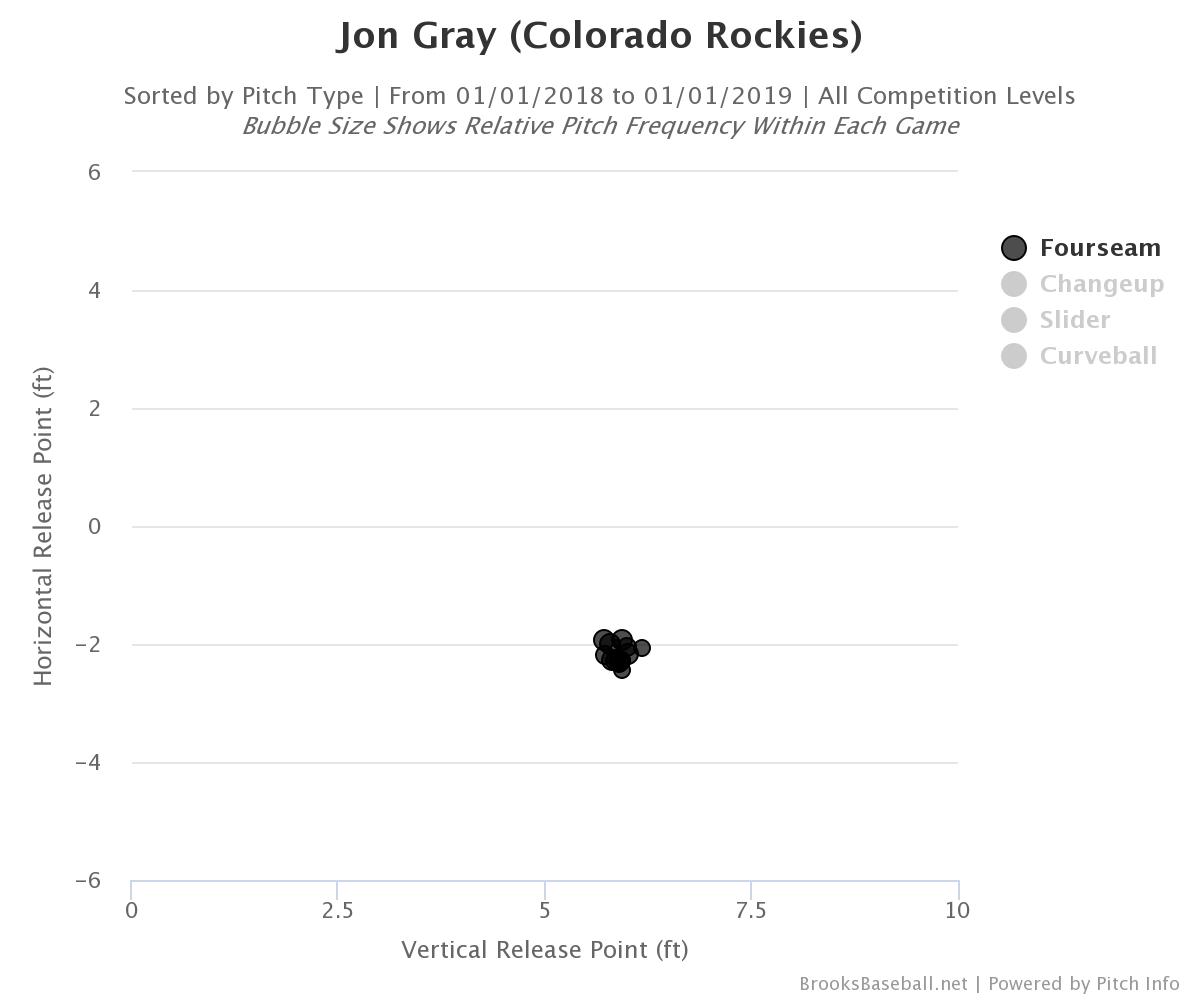
CHART 4
When comparing release points, both vertically and horizontally, this is where things get more problematic. Note the gap between both slider and fastball (Gray’s main two pitches) release between 2016 and 2018. 2016, being his best season, shows he disguised his pitches very well.
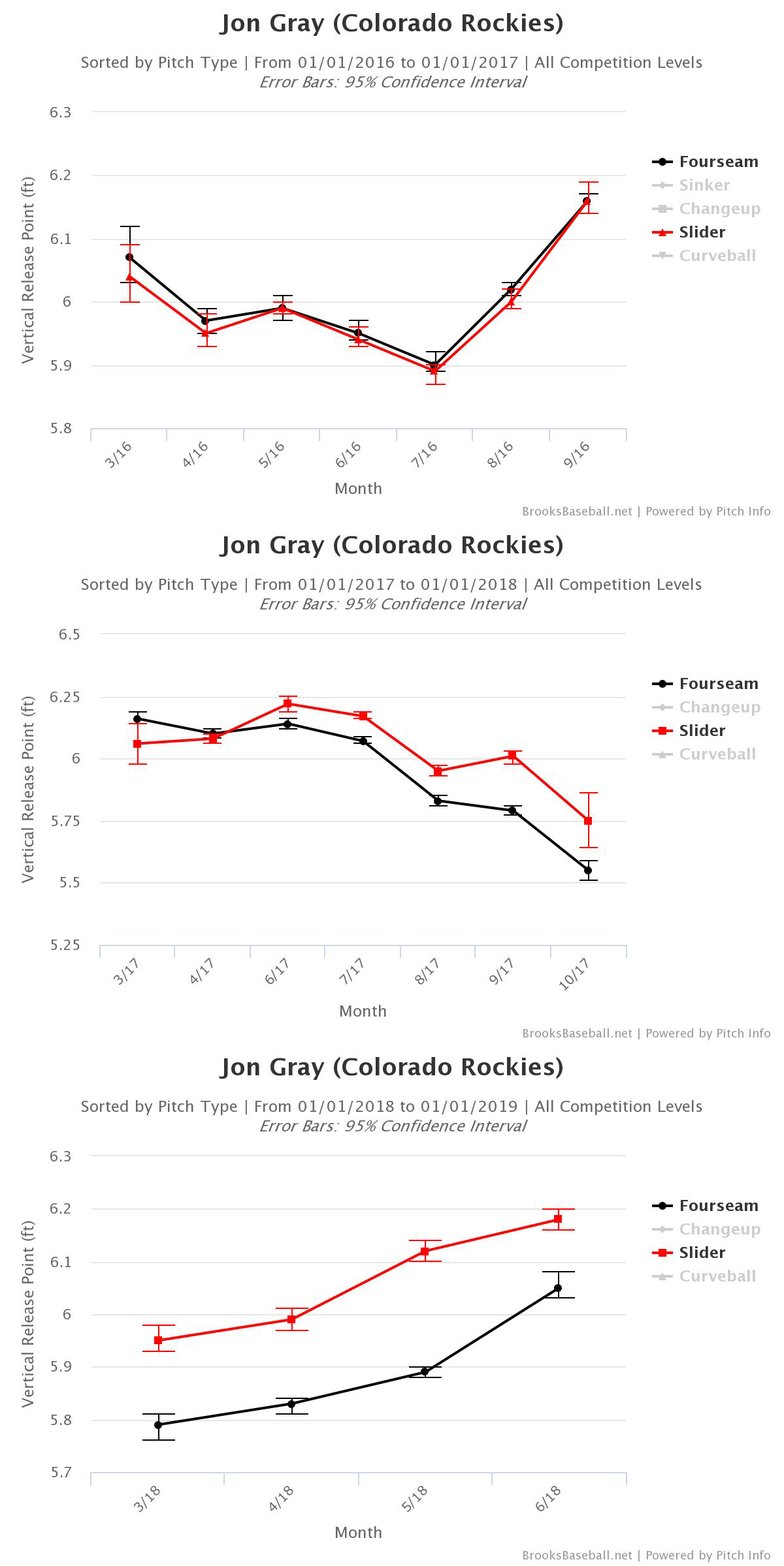
CHART 5, Vertical Release
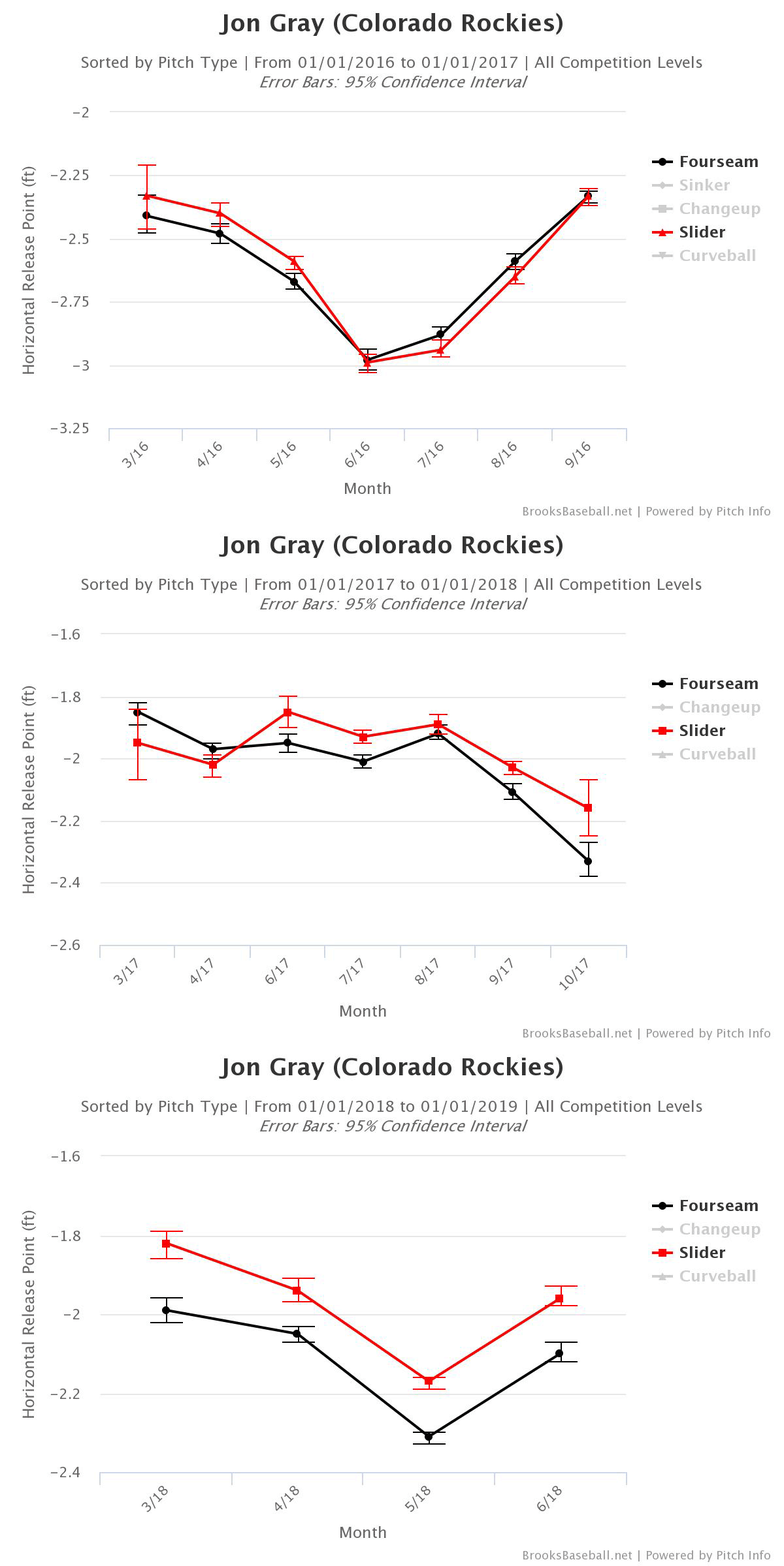
CHART 6, Horizontal Release
This isn’t simply bad luck despite what BABIP and FIP might be trying to tell us. What we see happening in 2018 is that Gray is ‘tipping’ his pitches with the noticeable difference in release points; perhaps some mechanical issues that deserve a closer look. Hitters are able to tell what is coming which makes it easier for them to react with good contact, thereby running up both Gray’s BABIP and, ultimately, ERA. With the decrease in the spin rate on his fastball, making the (back) spin that comes with throwing a fastball more recognizable, he’s giving hitters yet another clue as to what is coming.

Thank you for this, Michael. This confirms two things: 1. He’s tipping his pitches. and 2. Its pissing me off.
My question is, why are the pitching coaches blind to this?
Haha! Thanks for reading.
Yeah, meet me in Denver and we’ll confront them!
I don’t know, man. Max Scherzer has a pretty big difference in the release point between his slider and fastball. It doesn’t seem to be helping the hitter much.
Very true. But, I don’t think those two pitches from Gray are even in the same building as Scherzer’s. Have to take movement/break/extension into consideration as well.
Check out Gray’s 2018 splits by men on base. 31% K-BB%, 1.82 FIP with the bases empty. 6.8%, 4.91 with men on base. 2016, the year you highlighted as his best: 20.4%, 3.30 with bases empty; 14.0%, 4.00 with men on. I don’t think he has a pitches tipping problem. I think he has a stretch problem.
Check out his splits with bases empty vs runners on. He’s got an elite 31% K-BB rate with the bases empty, and near-league-worst 6.8% K-BB rate with runners on. Up until this year he has maintained his K-BB% with runners on better than league average (18.5% to 15.5% drop in his K-BB% with runners on, vs league average drop of 15.4% to 11.8%). So this is completely new for him, and there’s no reason to believe it will last. He doesn’t have a fatal flaw in his ability from the stretch. His 61% LOB rate will consequently rise (he’s been at 74% the past two seasons). It really just does appear to be bad LOB% luck.
Good points. He completely folds under medium/high leverage. LOB rate is somewhat like BABIP and will normalize.
I am seeing the vertical and horizontal release point comparisons for 2016 but not 2018. Great analysis, I have picked him up and dropped him twice and will let him figure it out on the wire.
Right. I saw that, too. Trying to get it fixed.
Seems to work on mobile?