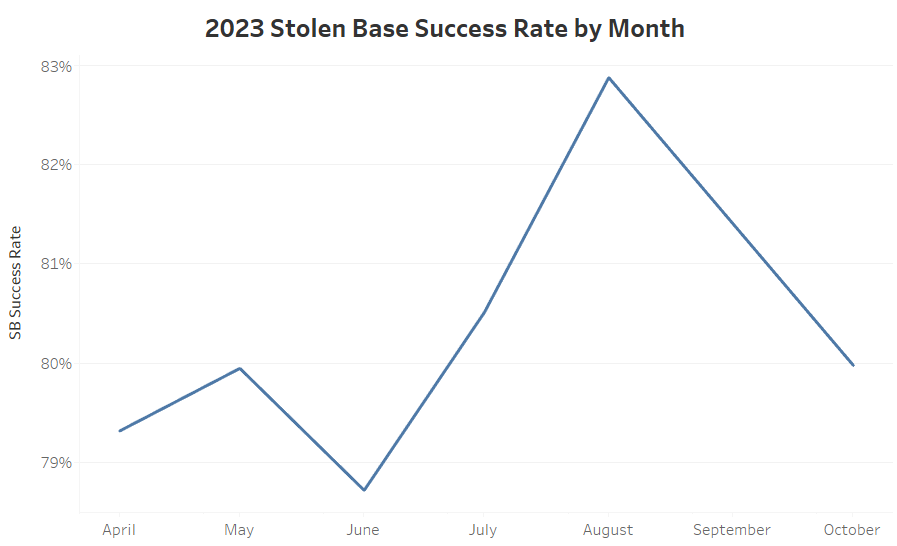
Stolen bases were just about all anyone could talk about last year. Baserunners ran rampant (say that three times fast) and brought MLB their much-needed excitement. The 3,503 stolen bases were a 41% increase compared to 2022. Though it took some teams time to figure out the break-even number for their players, we saw stolen base success rates improve as the year went on.

Given an offseason to analyze a full sample of data, conventional wisdom suggested more teams would be ready to run wild this year. To date, runners are attempting steals two percent more frequently than last year, but that doesn’t necessarily mean success. Successful stolen bases are actually down slightly, from 0.72 SB/G to 0.71 SB/G.
Last year, runners improved after the season started as there were fewer attempts, meaning that teams quickly figured out who could run and who couldn’t under the new rules. Though not included in the data, August and September’s success rates were 83% and 80%, respectively. This season, we’ve seen the rush of stolen base attempts spike earlier in the year.
Players ran wild early but weren’t necessarily rewarded. Success rates have been lower this year than in every month of 2023. Ben Clemens looked at the surprising stolen base rates early in the year and hypothesized that 2023 might’ve just been closer to the stolen base equilibrium than anyone imagined. With attempts up and success down through the first half of the year, it already seems that way.
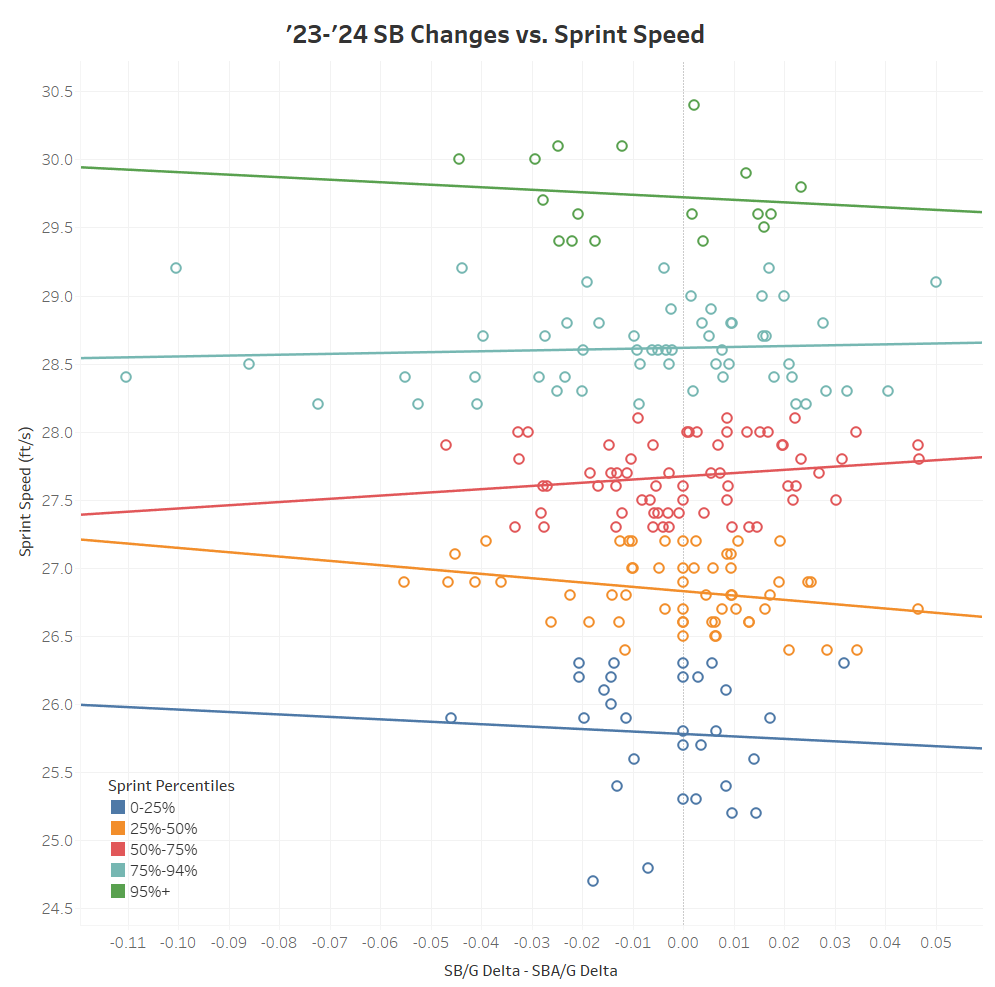
I was also curious about changes among player types. Last year, I wrote about who is stealing more bases with the new rules and found that the elite runners were unstoppable and above-average runners succeeded more. To look at year-over-year changes, I pulled a sample of players with at least one stolen base across at least 40 games in both 2023 and 2024. I looked at improvements by taking SB/G and subtracting SBA/G, so any player with a positive SB/G-SBA/G is stealing more but attempting less.

There is only one sprint speed bucket with a statistically significant correlation: 25%-50% sprint speed percentile. The 25th-50th percentile is seeing a legitimate but small improvement among slower runners. Other than that, all of the data is noise. There are a few outliers in the 75%-94% bucket as players who have taken a massive step backward (just every Washington National) but the elite runners have more or less maintained their ground.
Now looking at the defensive side of the stolen base, some weird things are happening. According to Baseball Savant’s pitcher running game leaderboard, pitchers have been significantly worse at preventing base advances. In 2023, pitchers accumulated 6 stealing runs (good), and in 2024, pitchers are at -3 stealing runs (bad). Given that stolen bases are down, that seems odd. Though all of the data looks pretty identical year-over-year (as it should), one item stands out.
 The runner’s lead distance gained on stolen base attempts (distance gained from the start of delivery to release) is five inches shorter than last year. While the average distance at the pitcher’s first move is the same, runners aren’t covering the same distance as they were last year. With most stolen bases being a bang-bang play at the base, five inches can be the difference between out and safe more often than not.
Why are runners covering less ground? Well, I couldn’t find a great explanation other than that slower runners are running more frequently. The 25%-50% sprint speed bucket has been the biggest gainer in stolen base attempts per game than any other group by a significant margin.
I think this puts us in a rather underwhelming conclusion to the immediate stolen base question. Outside of the rare outlier, I think we’ve already settled into the stolen base parameters for most players. The rules mostly benefitted the above-average and elite runners, but the stolen base thresholds have already been determined.
