


There’s nothing better than checking the day’s scores to see your team winning. Winning big? Even better. But for many of the cynical baseball fans out there, you almost roll your eyes when you see your team is up 11-0 in the 7th inning.
You think, “We should’ve saved those runs for tomorrow.”
And sure enough, your team loses 2-1 the next day. Somehow, this happens every time.
With no clock limiting the scoring atmosphere in baseball, teams cannot sit on the ball and waste time, like in basketball, football, or soccer. Every hitter is expected to give 100% when they step up to the plate and teams must record 27 outs on the pitching side. Inherently, this results in moments where there is a skewed scoreline that makes the game entirely uncompetitive. If you’re lucky (and a baseball sicko), you might get to see a position player pitch.
Additionally, lineups stay largely intact from one day to the next, which means there’s not necessarily a significant personnel change from the 10-run game to the next. Unlike on the pitching side, where a pitcher can get blown up, and an ace is on the mound the next day.
But did those runs really need to be saved for tomorrow?
Quick disclaimer on what you’re about to read: Although this data was taken from the last three seasons, there is no predictive value from one season to the next. Is this a fun reason to get annoyed (or appreciate) your favorite team? Sure. But this is merely a fun data dive that’s not meant to be taken too seriously.
Runs Per Game After Scoring 10+ Runs
Over the last three seasons, there have been 1082 instances of a team scoring 10 or more runs. The Dodgers and Astros have both scored 10+ runs the most, at 53 and 52 times, respectively. Other top teams include the Padres, Blue Jays, Rays, and Braves. All of these teams have been known for their strong offenses over the last few years, so this makes sense. On the other end of the spectrum, the Pirates have the least amount of 10+ run games with 19, followed by the Mariners, Tigers, Athletics, and Marlins. Again, all teams are known for not having strong offenses, and there are only 2 combined playoff appearances among them over the last 3 seasons.
As a league, the average runs per game (R/G) was 4.62 across all games from 2021-2023. In games after scoring 10+ runs, the league average runs per game was 4.55, 0.07 runs less than the normal average. So at a league level, technically a small number of runs could be saved for tomorrow, but this is rather insignificant. I also don’t think any conclusions can be made here, as my interest in this research stems from being an annoyed Cardinals fan who constantly (and annoyingly) believes they can save runs for tomorrow.
On the team level, I compared teams’ runs per game after scoring 10+ runs to their total runs per game from 2021-2023. The table below can be sorted by any of the columns.
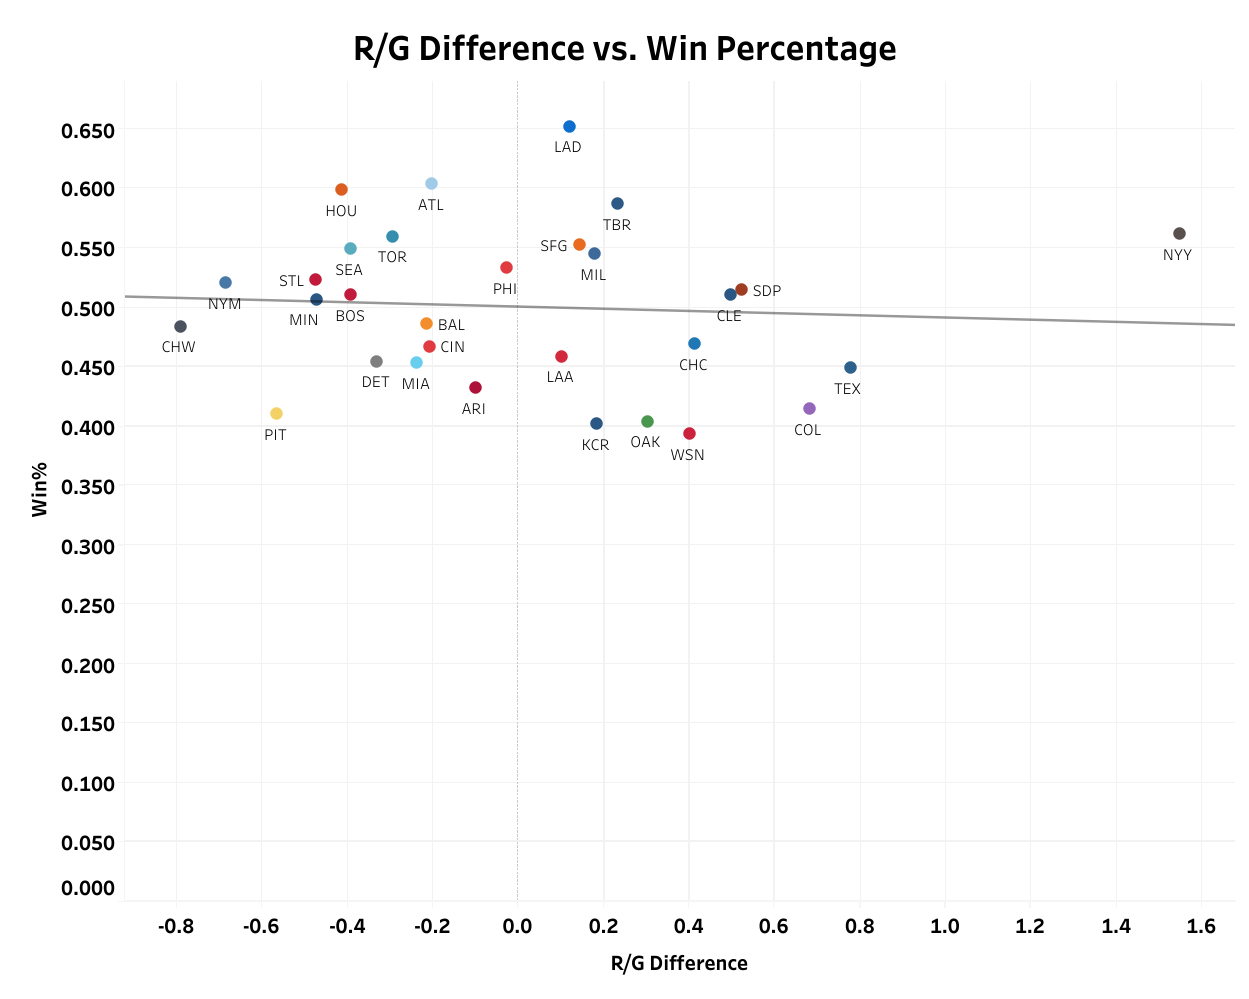
The Yankees stand alone at the top as an outlier, scoring 1.55 more runs in the game after scoring 10+ runs, which is bizarre. Colorado being near the top makes sense, because there’s a higher likelihood of them scoring 10+ runs at home, and that same run environment exists the next day.
For the most part, there doesn’t seem to be rhyme or reason to where teams rank on the list. My Cardinals’ pessimism is deserved seeing them at the bottom of the list, but it feels like pure luck. When comparing the team’s win percentage with the runs per game difference, there’s no correlation at all between the two. There’s a -.004 R-squared value that’s not statistically significant.
While there’s no correlation here, there is a correlation between runs per game after scoring 10+ runs and win percentage.
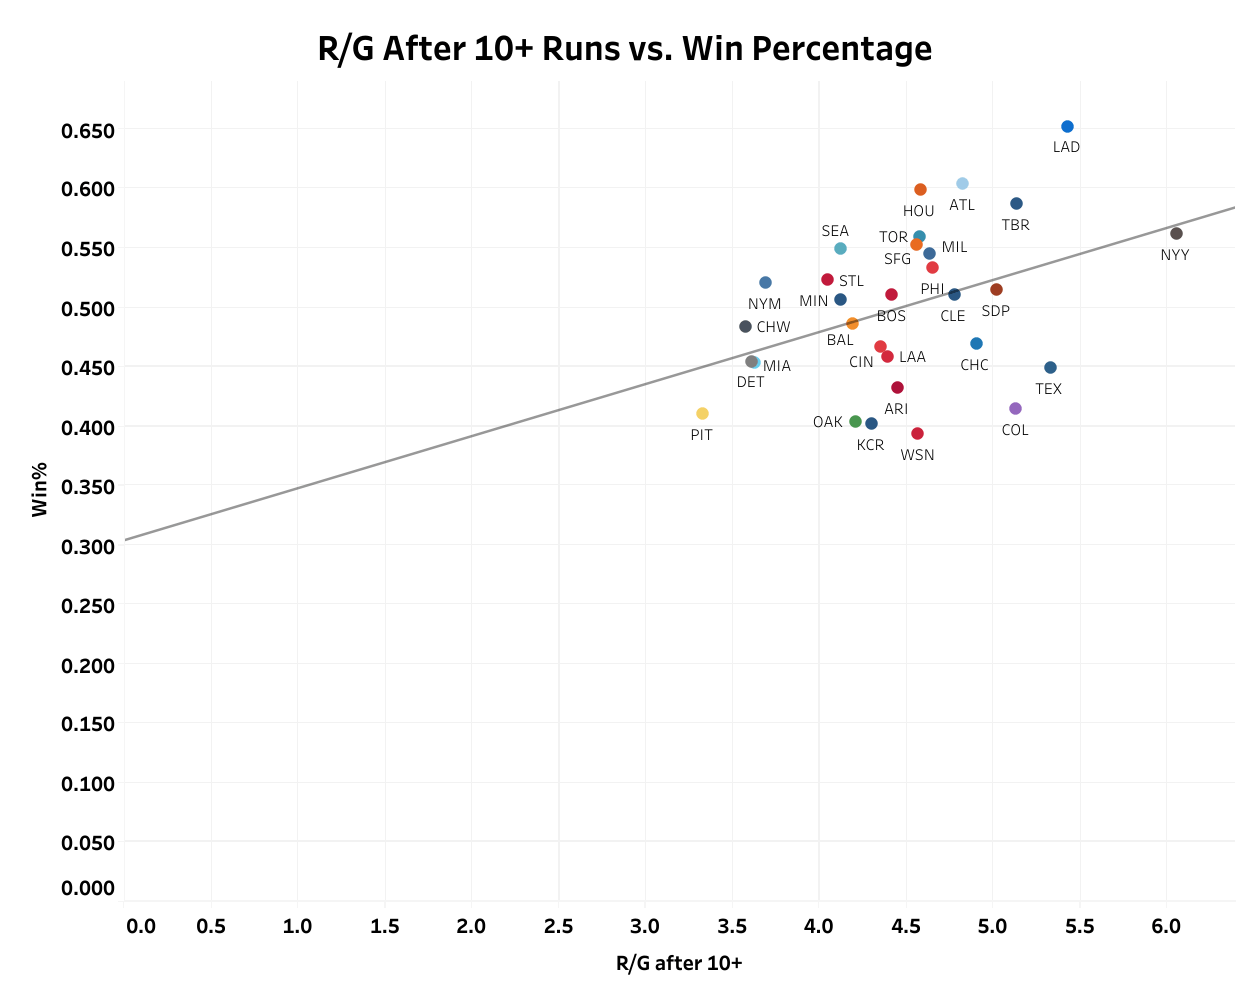
This has more of a clear trend, and the results are statistically significant. A .16 R-squared value indicates that there’s a slightly positive correlation between winning more games after scoring more after 10+ run games. This is pretty intuitive, as, generally, more scoring leads to more wins.
Win Percentage After Scoring 10+ Runs
Pivoting to the win percentage side of this research shows that scoring more after scoring 10+ runs, or vice versa, doesn’t have a direct effect on winning. Here are all of the team’s win percentages from 2021-2023, and their win percentage in games after scoring 10+ runs. The table below can be sorted by any of the columns here too.
There’s a greater disparity in win percentage after scoring 10+ runs simply due to the smaller sample size, but there are a few teams who see drastically different results than what their R/G difference says. First, the Yankees remained at the top as the team with the most improved win percentage after scoring 10+ runs, and three of the four bottom teams remained the same (CHW, NYM, and STL).
However, the Tigers, for example, lost 0.33 runs in the game after scoring 10+ runs but won those games at a .608 clip. On the other hand, the Guardians improved their runs per game by 0.5 but dropped from a .510 winning percentage to a .378.
Plotting the two differences on a graph indicates that there’s a small positive relationship between scoring more in games after scoring 10+ runs and winning in those games, which, again, comes down to the fact that scoring more runs is always going to help teams win.
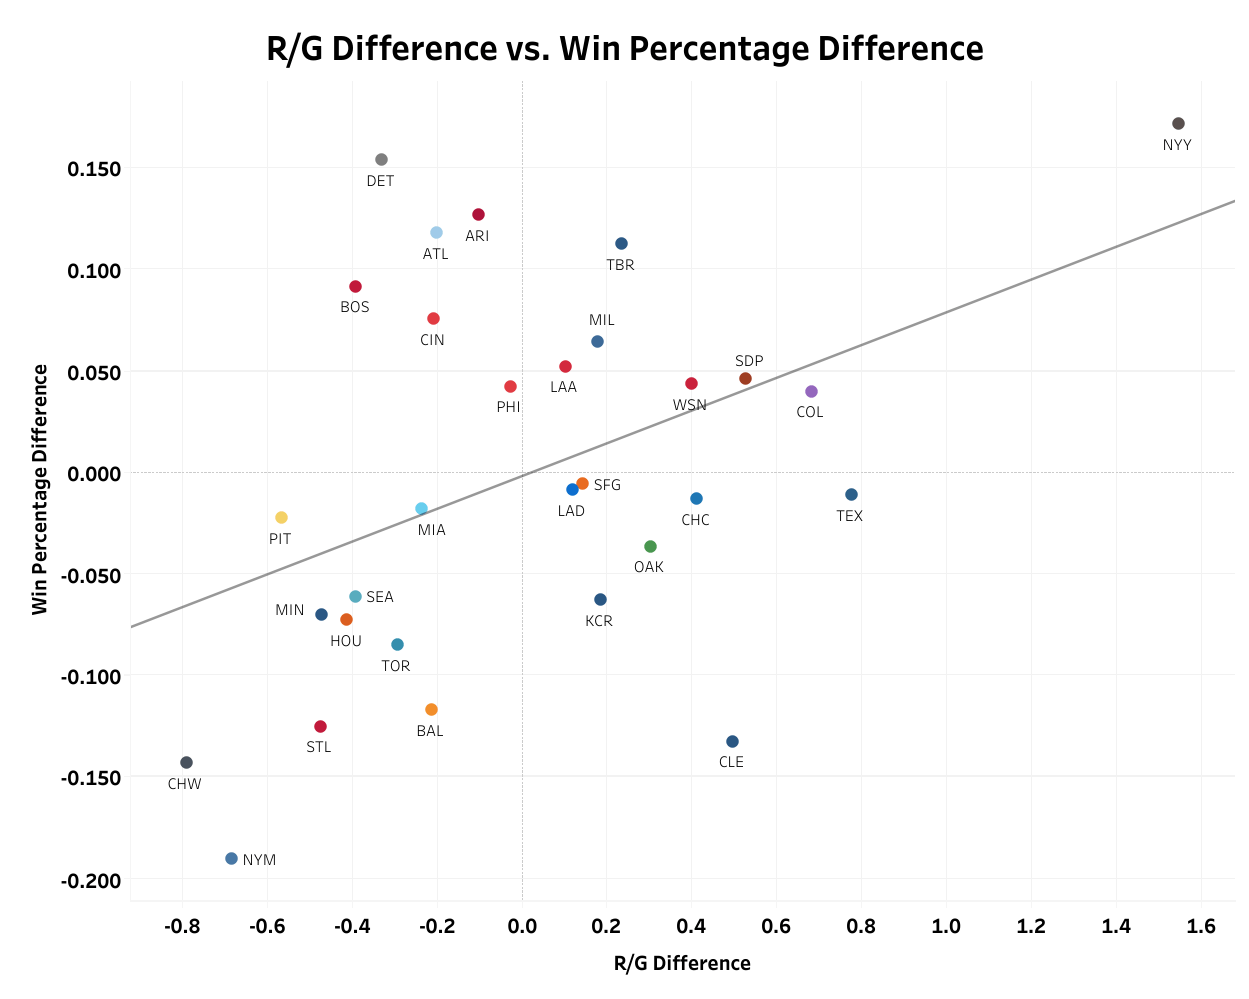
Overall, 17 teams saw a decrease in win percentage in the game after scoring 10+ runs, compared to 13 that gained win percentage after scoring 10+ runs. Fourteen teams increased their runs per game average after scoring 10+ runs, but there is a lot of crossover between those who got better or worse by win percentage.
What does this mean going forward? Well, the key takeaway is that Yankees fans shouldn’t complain about saving runs and their Subway Series foes should be doing all of the complaining. Next time your team scores 10+ runs, just remember that your team probably isn’t that much worse the next day, so they might as well score as much as they can that day.