


Pitchers get outs in a few different ways, with the most important of course being strikeouts. From there, pitchers can be bucketed into separate categories based on their batted ball profile: groundball, fly ball, or more average in both aspects. The combo of whiffs and balls pounded into the dirt is the ideal foundation to look for, but there are plenty of pitchers that have had great success while being more fly ball oriented.
Pitchers with low release points and above-average vertical ride on their fastballs often fool hitters by inducing swings underneath the ball, leading to frequent whiffs or weak contact in the form of pop-ups and weak fly balls. Think of Joe Ryan, Bryan Woo, among others.
The air ball prototype can be prone to variance, however, as fly balls and line drives are the most valuable batted ball types, and what hitters train for. All pitchers are dependent on the defense behind them, and there can be some dramatic swings year to year.
For this exercise, we’ll examine four pitchers who fall into the fly ball cohort, defined as having a fly ball rate above the league average of 38.5%. Specifically, we’ll focus on two pitchers with above-average ERAs (below the 2024 league average of 4.09) and two with below-average performance (ERAs above 4.09), to explore what separates successful fly ball pitchers from those who struggle, as well as some things that have gone against them this year regarding performance on balls in the air. Every pitcher included throws a high rate of four-seamers, it makes why their fly ball rates are higher.
The league average for air ball out rate this season is 67.9%, with the best team being the Padres at 71% and the Rockies being the worst at 62.9%.
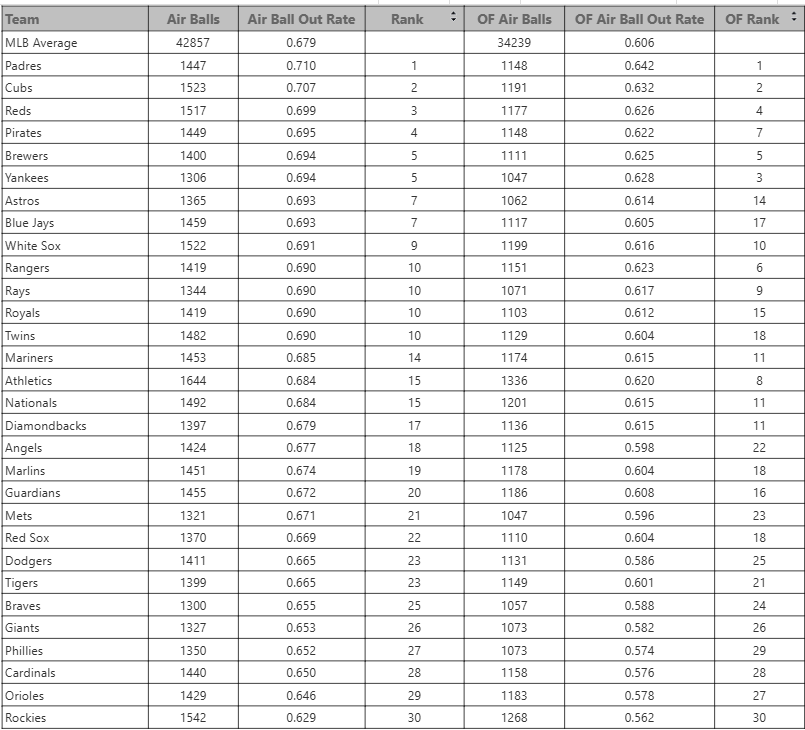
Here are the top 25 pitchers this season in air ball out rate (min. 50 flies and liners):
And there are 27 pitchers this season with an out rate at or below 60%:
Imanaga clearly is included in the group with an above-average ERA, despite his recent blowup against the White Sox. He owns a 3.12 ERA, 1.04 WHIP, and a 12.2% K-BB% in 78 innings this year.
Since debuting last season, Imanaga has the fifth-highest fly ball rate in baseball (min. 200 innings). The lefty has also been one of the most effective as he’s one of 16 starters with an ERA below 3.00, holding a 2.97 ERA, 1.03 WHIP, and an 18.3% K-BB% in 251.1 career innings.
It’s a pretty consolidated mix for Imanaga. He heavily relies on his four-seam, throwing it roughly 50% of the time to both hands. Then, he’ll lean on his devastating splitter against righties while throwing the sweeper away to lefties most of the time. He creates deception with a lower 5.4′ release height, while generating 18.5 inches of vertical break, which is a strong number when adjusting for his release height.
That unique trait, despite his 91 MPH fastball velocity ranking bottom 10 among starters (min. 70 innings), makes for a lethal combination of a high pop-up rate (12.3%) and swinging strike rate (11.9%). There are only five other pitchers to match those numbers this season:
This has enabled him to have very good air ball out rates over the past two seasons, at 72.8% last year and up to 77.7% this year, which ranks 22nd out of 316 pitchers. In terms of average exit velocity on balls in the air, Imanaga is in the middle of the pack at 91.9 MPH. Of course, that is also a major credit to the Cubs’ outfield defense behind him. The Cubs outfield ranks fifth in the big leagues since the start of 2024 with 36 Defensive Runs Saved. Additionally, they have the third-best air ball out rate as a team in that same time frame at 69.9%.
There are perhaps some warning signs with Imanaga, as his low velocity will likely always keep his home run rate below average. The strikeouts are down a bit, and his 4.86 xFIP is a bit concerning and a sizable difference from his 3.62 mark last year. And his 86.5% Left On Base% is among the highest in the league, signaling some regression most likely. But the strong defense behind him and established results keep the floor high.
Abbott is one of the more confounding pitchers in the league, as he lacks standout stuff or anything unique, but his results are impossible to deny. His 2.13 ERA is third best in baseball this season (min. 90 innings), and he is just behind Imanaga in ERA leaders since the start of 2024 with a 3.07 ERA, which ranks ahead of bona fide aces like Hunter Browm, Logan Gilbert, and Logan Webb.
Abbott has one of the more extreme fly ball rates this season at 48.2%, and that’s been a consistent theme so far in his career. He ranks in the top 20 among all pitchers in air ball out rate this year at 78.1%, following a strong 2024 at 74.3%. Great American Ballpark is perceived as a hitter’s park due to its small dimensions, but that can also play in the pitcher’s favor a bit, as there is less ground to cover, leading to more catchable balls potentially. And while Abbott is more average to slightly above average in terms of generating strikeouts, he is effective in overall contact suppression and generally locates all of his pitches well. He is one of 16 starters with average or above average Location+ marks on at least five pitches (min. 90 innings).
His 89.6 MPH average exit velocity allowed on balls in the air is one of the better marks in the league. He’s supported by a team defense that ranks third in baseball in air ball out rate since his debut season in 2023, at 69.2%. Interestingly enough, the Reds’ outfield is actually bottom 10 in Defensive Runs Saved in that span at -25.
The left-hander is just owning right-handed hitters this season, allowing just a 0.285 xwOBA. He’s inducing a good amount of whiffs (12.2% swinging strike rate), but more than anything, he isn’t allowing extra base hits. Roughly 69% of his hits allowed to right-handers this year have been singles. Comparatively, that number was at 52% last season and 55% in 2023.
The duo of his fastball and changeup has been deadly. When thrown in succession, that combo has produced outstanding results. He’s able to tuck in the heater high and tight to jam righties while also throwing the changeup off the plate for weak contact off the end of the bat. He uses the fastball on the outer third as well to effectively set up and tunnel with his changeup.
When throwing a changeup, the pitch that follows a fastball, he has held opponents to a .483 OPS with a 20% swinging strike rate and a 39% chase rate. When throwing his fastball right after using a changeup, he’s held opponents to an even better .343 OPS with a 16.3% swinging strike rate and 37.3% chase rate.
Cease is unfortunately included in the below-average ERA category, as his results haven’t been quite as strong this year with a 4.59 ERA and 1.30 WHIP, but a 20.9% K-BB%, identical to his 2024 mark, where he had a 3.47 ERA and 1.07 WHIP.
Cease is essentially a two-pitch pitcher with a four-seamer and a slider. The right-hander has one of the most over-the-top arm angles in the league at 50 degrees, which helps him to have high ride on his fastball. And he throws his bullet slider hard at 89.1 MPH, which allows it to be platoon neutral and eat up lefties. There is some natural volatility with two-pitch guys, as if they lose feel for one of their pitches in an outing, they are essentially out of options.
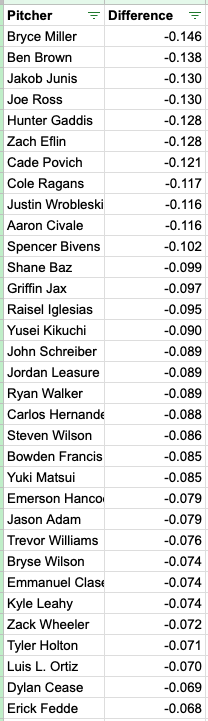
Cease has experienced one of the more drastic flips in air ball out rate from 2024 to 2025. It was at a well-above-average 71.4% in his first season in San Diego, and in largely the same environment, that number has dipped to 64.5%, which ranks 239th out of 316 pitchers. Here are the biggest year-to-year differences from 2024 to 2025:
San Diego outfielders ranked 22nd in Defensive Runs Saved in 2024 with -8 in Cease’s strong inaugural campaign. In 2025, oddly enough, they’ve been collectively one of the best defensive outfields in baseball, ranking fourth best with 13 Defensive Runs Saved.
Cease allowed harder contact on average on balls in the air in 2024 than he currently has in 2025 (92.2 MPH avg. exit velocity in 2024, 91.2 MPH in 2025). His underlying metrics are essentially the same as last season, with the exception being a rise in BABIP to .319, which is above his career mark of .293. Plus, the home run rate has spiked this season, with his highest HR/9 and HR/FB% since 2020. He also has some of the best collective peripherals of his career, with a career-best 3.37 xFIP and 3.35 SIERA. It’s just one of those bad luck seasons, it seems.
Flaherty’s results have fallen back to earth a bit in 2025 after one of his best campaigns in 2024 between Detroit and Los Angeles. He holds a 4.77 ERA, 1.29 WHIP, and still a strong 19.9% K-BB% in 103.2 innings.
An important indicator of success for Flaherty throughout his career has simply been his fastball velocity. When he throws it harder than 94 MPH, he has strong results and underlying metrics. When under 94 MPH, things get a little murkier. This season, Flaherty has the lowest average fastball velocity of his career at 93 MPH, and that feels relevant with how frequently he throws it.
His ground ball rate has cratered to a career low 34.1%, and his fly ball rate has ballooned to a career high at 46%. So despite owning the best strikeout rate of his career, he has the highest HR/9 (1.65) since his rookie season (1.69). He’s already allowed 12 home runs on his four-seamer, his most since 2019 with a few months still remaining in the season.
His air ball out rate has actually improved from 2024 to 2025, going from 64.4% between the Tigers and Dodgers last year to 66.7% this season. He’s near the top of the list in average exit velocity on air balls (92.6 MPH), while he suppressed hard contact better last year, with a 90.4 MPH average exit velocity.
Both the Tigers and Dodgers ranked in the top half of the league in outfield Defensive Runs Saved last season, with the Tigers being the 7th best. Concerning team air ball out rate, both teams were in the top five as well.
The Tigers have dropped down to 22nd in outfield DRS this year, and down to 23rd in air ball out rate as a team at 66.5%. Similar to Cease, Flaherty has strong peripherals with a 3.64 xFIP and 3.51 SIERA for the year. His performance on balls in the air is part of the explanation for why the surface-level results aren’t quite as peachy as last year.
