


Baseball is a matchup dependent sport, a truism underscored by fantasy managers’ focus on pitcher streaming and daily fantasy. They know that outside of the outliers — that is, the truly elite and the truly terrible pitchers — the quality of the day’s opposing hitters is as important a variable in a pitcher’s success as their own ability.
But while analysts heavily consider opponent quality on a micro, game-to-game basis, they rarely consider it for more macro, long-term analysis. And there is a good reason for that — for most pitchers, the undulations of matchup quality even out over the season.
As a result, should we even care about a pitcher’s average quality of opponent (“OppQual”)? It depends on the question you’re asking. If you want to know whether a pitcher such as Dylan Bundy is good or bad, knowing his OppQual won’t help much. But if you want to know if Bundy will regress positively from his season to date ERA of 6.67, understanding his OppQual is a necessity.
For Example
The cumulative 2019 xwOBA of the 129 hitters who Bundy has faced this season is .350, the highest of any starter in baseball. To put that figure into context, consider that Rhys Hoskins and Nolan Arenado posted 2018 xwOBAs in the same range. In Bundy’s case, this is what happens when your first six starts come against the Yankees (2x), Twins (2x), Rays, and Athletics.
Meanwhile, Padres hurler Joey Lucchesi has faced the Giants (2x), Rockies, Reds, Diamondbacks, and Nationals. The first three teams are in league’s xwOBA basement, while the latter two are middle of the pack. As a result, the cumulative xwOBA of Lucchesi’s opposing hitters is a measly .279, the equivalent of facing a lineup full of Scott Kingerys and Alcides Escobars.
Bundy owns a 6.67 ERA with 6.54 FIP and 5.09 xFIP to the start the season. Lucchesi has pitched to a 4.94 ERA with a 3.57 FIP and 3.45 xFIP. Generally, the smart money would be on Lucchesi’s run prevention ability to move closer to his estimators, while most would argue that Bundy has been just plain bad with little hope for rejuvenation.
But will that happen? It’s difficult to take Lucchesi’s above-average FIP and xFIP seriously when he’s faced such an easy run of hitters. Meanwhile, I like the odds of Bundy’s performance improving markedly once he gets some better matchups.
Methodology
Before diving deeper into the 2019 OppQual outliers, let’s explore the methodology behind the stat.
There are a variety of different ways to calculate OppQual. For example, Baseball Prospectus features a suite of stats that shows the batting average, slugging percentage, OPS, and run probability added of a pitcher’s opponents. While these metrics are instructive, they are results oriented and thus especially prone to the small sample-size randomness inherent in early-season performance.
Consequently, a robust OppQual indicator should be developed through a more process-oriented stat, such as xwOBA, which takes into account how batters are hitting the ball rather than whether the ball lands for a hit.
To derive the xwOBA-based OppQual, I manually searched every starting pitcher in 2019 on Baseball Savant, scraping the plate appearance count for each hitter they faced. I then matched these hitters up to their 2019 xwOBA and calculated a weighted average xwOBA that each pitcher has cumulatively faced.
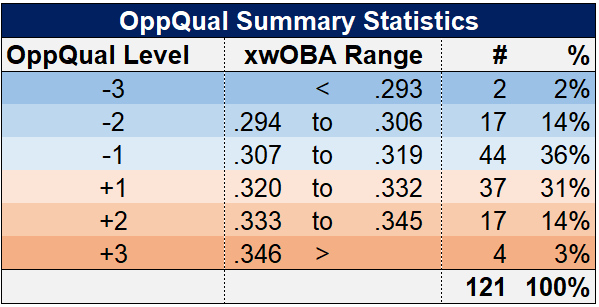
Among the 121 starters surveyed, the average opponent xwOBA measured at .319, with a standard deviation of +/- .013. The roughly 67% of pitchers that fell into the OppQual -1 and +1 buckets don’t need much discussion, as their OppQuals clustered around a similar level.
But we start seeing some real differentiation in the -2 and +2 OppQual bins. On the low end, these pitchers experienced xwOBA differentials of 27 points growing up to 51 points on the high end. These variances are significant enough to warrant attention.
From there, we can see that four pitchers, Bundy included, fell within the dreaded +3 OppQual bin, while only two, one of whom is Lucchesi, had the benefit of pitching at -3.
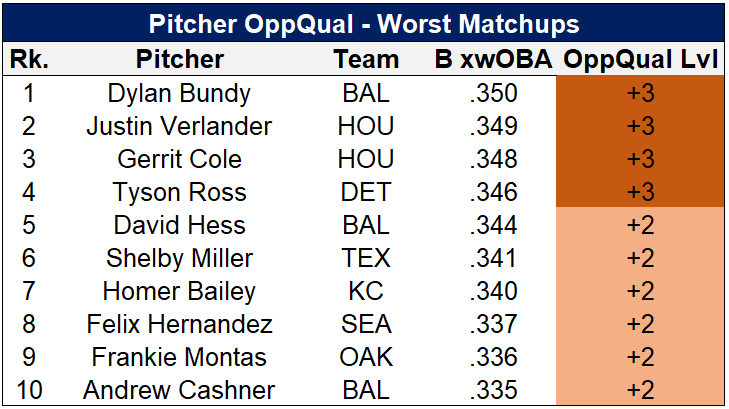
The Black Cats
Bundy, along with teammates David Hess and Andrew Cashner, each dot the list of the 10 unluckiest OppQual pitchers thus far, a group Pitcher List contributor and graphics guru Justin Paradis has dubbed “The Black Cats.”
The Orioles have lived in the AL East and AL Central so far this season, two of the strongest hitting divisions in baseball. While that was expected from the East, the Central has surprised, with the Twins pacing baseball in xwOBA and the White Sox and Royals putting together roughly average showings.
But outside of Bundy for a spot-stream, few fantasy owners have little interest in Baltimore pitchers. In terms of fantasy relevance, Astros co-aces Justin Verlander and Gerrit Cole jump off the page. Verlander has faced the Twins twice, while both starters have accumulated starts against the Yankees, Rangers, and Mariners. The fact that both hurlers, outside of one bad start for Cole, haven’t missed a beat despite a grueling opening schedule is a testament to their skill.
The AL West, a division which looked fairly light hitting at the season’s outset, has profiled as baseball’s strongest-hitting fivesome to start the year, which also explains Shelby Miller’s, Frankie Montas‘, and Felix Hernandez’s inclusion in The Black Cats.
Divisional biases will be an inherent part of a pitcher’s OppQual because teams in the same division play each other 19 times per season (76 total divisional games per team, nearly half the season). However, OppQual is a descriptive rather than predictive stat. That means it describes what has happened, not what will occur in the future. Despite hot starts, it’s difficult to envision the Rangers and Mariners maintaining their current production, which will make lives easier for AL West pitchers down the road.
In case you were skeptical of Montas’ and Hernandez’s strong starts, maybe you shouldn’t be because they have managed it against good hitters. Royals pitcher Homer Bailey owns an unsightly 5.70 ERA but is striking out one batter per inning and has a double-digit swinging-strike percentage. Perhaps you should consider him as a viable streaming option with more favorable matchups.
The Lucky Ones
Now let’s dig into the pitchers who have been afforded some fortunate matchup luck thus far. I have boringly dubbed them “The Lucky Ones.”
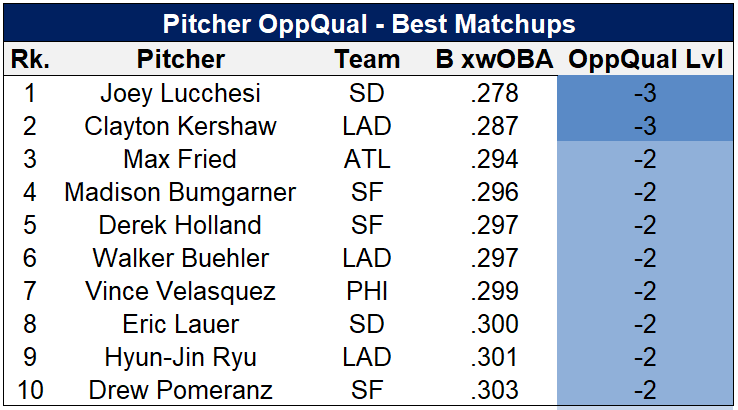
Based on eight of the top 10 OppQual beneficiaries residing in the NL West, it’s readily apparent that the division is not very good at hitting so far this year. Moreover, one of the two non-division pitchers — Braves hurler Max Fried — has faced four NL West teams to date.
Sure enough, the Padres, Giants, and Rockies are all in the bottom five in terms of xwOBA, while the Diamondbacks are bottom 10. And the Dodgers, while certainly a good hitting team, have cooled off significantly after a torrid hot start.
It’s likely that Padres and Rockies improve at the plate going forward, making it less of an advantage to target NL West pitchers. Also, don’t forget that NL West pitchers must contend with the altitude effects of Coors, which are not captured in xwOBA.
In terms of how to treat the pitchers in the top 10, exercising extra skepticism with Lucchesi and Vince Velasquez would be a wise move. Moreover, while Fried has had a great start to the season, it will be interesting to see how he fares against the Phillies, Nationals, and Mets on an everyday basis.
Odds and Ends
OppQual isn’t an end all, be all stat. However, it provides an interesting glimpse into a pitcher’s matchup quality. Any time an analyst is assessing early-season pitcher performance or attempting to understand if a pitcher is exhibiting a breakout over a small sample of innings, they should consult the pitcher’s OppQual to see if matchup variability is potentially influencing their production.
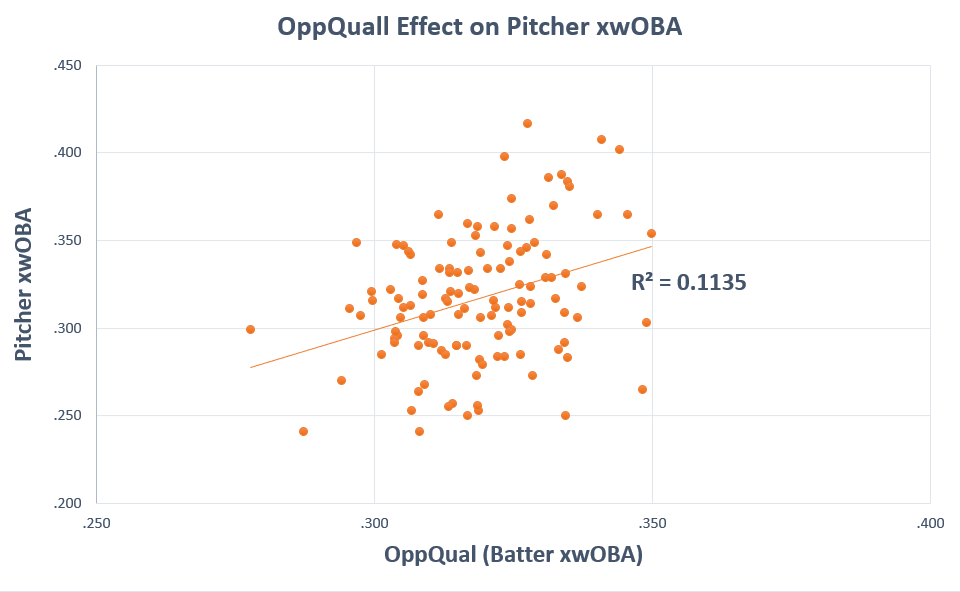
Thus far in 2019, a pitcher’s OppQual exhibits a 0.34 correlation to their xwOBA, with an r2 of 0.11. That means that changes among the sample group’s OppQual account for over 10% of the variation in their actual pitching performance. The graph above displays a clear, direct relationship. Pitchers want to be below the trend line because that means they are suppressing offense at an above-average rate relative to the hitters they were matched up with.
There are some limitations to this methodology. As I noted earlier, using xwOBA, a process-oriented stat, largely excludes ballpark effects from the analysis. Moreover, the question of what xwOBA hitter sample to use for the OppQual weighted average is an important one. I simply used 2019 hitter performance; however, one could make an argument that the previous year’s performance should be included for robustness.
Fortunately, xwOBA is a stat that stabilizes quickly, as full-year 2018 xwOBAs correlate at 0.55 with early season 2019 readings. I ran a version of the analysis weighting 2019 xwOBA at 2/3 and 2018 xwOBA at 1/3, and the results barely changed.
Next steps in OppQual research would be to explore full-year results in previous seasons to evaluate just how large of an impact divisional influences can have on a pitcher’s OppQual. They are certainly evident in the first five weeks of 2019; however, I suspect they even out as the season progresses.
Illustration by Justin Paradis (@freshmeatcomm on Twitter)
