


Photo by Cliff Welch/Icon Sportswire
Last week while writing an article on Eugenio Suarez (shameless plug), something stood out to me that I wanted to investigate further. His hard hit rate stands at 49.8%, harder than anything I’d remember seeing in awhile. Five minutes later, I confirmed what I suspected: he’s maintaining a hard hit rate above last season’s best (Joey Gallo at 46.4%).
Is it possible that Suarez has made 3% more hard contact than every hitter in baseball last year? Sure. Is it likely? Not particularly, especially considering that eleven other hitters (including Gallo himself) are beating that 46.4% mark this season as well. Unless there’s something in the water this season, something’s awry with the quality of contact measurements.
Take the curious case of Matt Olson, one of the aforementioned top 10 in hard hit rate. Last season, while making 40.3% hard contact, he smacked 24 tates in just 59 games. This year, despite a 7.3% increase in his hard hit rate and maintaining strong pull and flyball tendencies, he’s hit the same number of homers in 133 games. Fantasy players probably thought he’d hit more home runs than last season, particularly in 74 more games, and I wouldn’t have faulted you for trading for him at some point given that expectation. Owners rely on quality of contact measurements, so it’s important to know whether they’re accurate in order to evaluate players.
This year, of qualified hitters, 45 players are making 40%+ and 107 are making 35%+ hard contact. Last year, 18 players made 40%+ and 61 made 35%+ hard contact. Unsurprisingly, therefore, hard contact is up 3.54% this season, putting the average at 37.26%. Take a look at the following graph and you’ll see where this season’s hard contact is coming from:
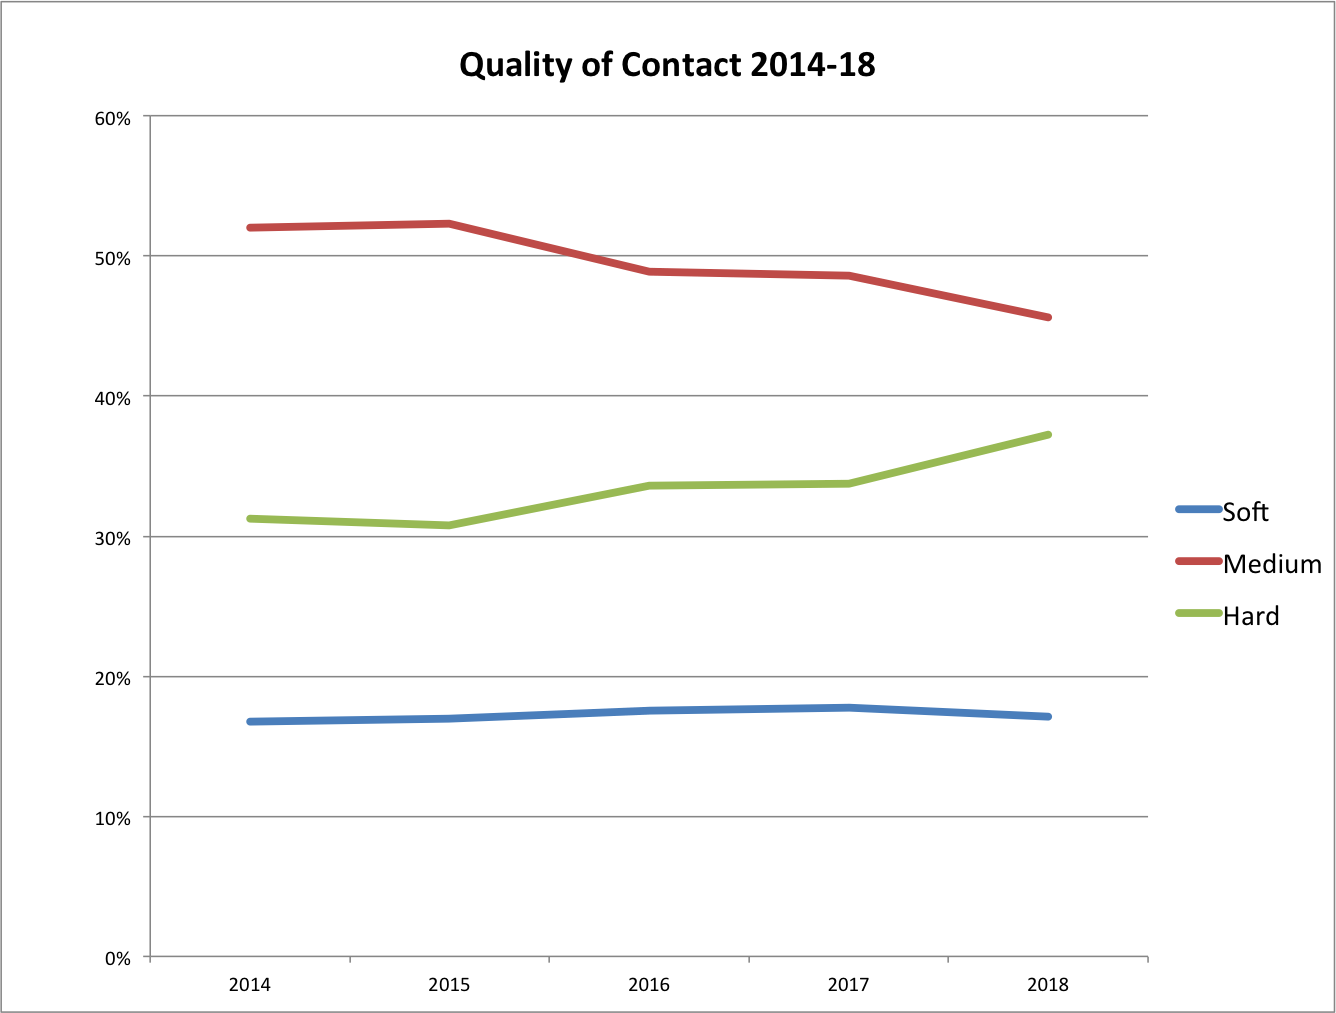
It’s subtle, but the hard and medium lines converge in 2018. I included soft contact for you to see that it’s remained steady, and is therefore not the source of the increase in hard contact this season. To explain what’s going on, either hitters are making significantly more hard contact and less medium contact than prior, or measurements have changed, mistaking one for the other (or getting it right now and not in years past).
Were hitters simply making better contact, we might see an increase in power output across the league…
| Season | Home Runs | Barrels | SLG | ISO |
| 2018 | 4,536 (on pace for 5,376) | 6914 (on pace for 8,194) | .411 | .182 |
| 2017 | 6,105 | 7915 | .426 | .192 |
| 2016 | 5,610 | 7956 | .417 | .183 |
But there will likely be fewer homers this season than the last two, barrels are largely in line with 2016 and 2017, and both SLG and ISO are actually down this year. Perhaps hitters are hitting the ball harder, yet are hitting fewer flyballs than last season (and thus fewer home runs)? Nope. The decrease in flyballs is less than one percentage point from last year.
My thinking, then, is that this is likely a change in the way quality of contact is measured.
According to FanGraphs, Baseball Info Solutions records the quality of contact data for each of the 30 teams, and since 2010 their “video scouts recorded the amount of time the ball was in the air, the landing spot, and the type of batted ball (fly ball, ground ball, liner, etc) and the BIS algorithm determines if the ball was soft, medium, or hard hit.” Further, the calculation is made based on “hang time, location, and general trajectory.” Unfortunately, their algorithm is proprietary, so there’s no way to know if something has changed.
It is possible that Baseball Info Solutions’ criteria for calculating quality of contact has changed this year to designate certain balls that were previously recorded as medium hit instead as hard hit. Or maybe the ball is no longer juiced, such that hitters really are hitting the ball harder, just the results aren’t there.
Whether contact is recorded more accurately now than in years past is irrelevant for our purposes. In other words, it doesn’t matter whether balls were inaccurately measured as medium hit last season and are now properly classified as hard hit. Instead, what you should take away is that making 37% hard contact is no longer good, it’s merely average among qualified hitters. Evaluations and expectations should be shifted to account for the change in measurements. If a hitter’s hard contact is up this season, he might not actually be making better contact on his balls in play. Take a hitter’s variance in hard and medium contact between this season and last season with a grain of salt, as it might merely be the result of a change in classification.
