Eddie Rosario had a very good 2018 for his fantasy owners, hitting .288 along with 24 home runs and nine stolen bases. Per NFBC (as of 1/17/19), he’s going off draft boards at an ADP of 81. But he may be a bit overvalued. Here, I’ll look at three other outfielders who are going significantly later in drafts and could return better value than Rosario: Aaron Hicks, Yasiel Puig, and Andrew McCutchen.
2018 xStats Comparison
| Name | PA | xAVG | xOBP | xBABIP | xBACON | xOBA+ | VH% | PH% | EV | LA | HD% | PU% |
| Rosario | 592 | .252 | .289 | .272 | .309 | 92.8 | 9.8% | 31.1% | 85.9 | 17.4 | 12% | 23.6% |
| Hicks | 581 | .266 | .381 | .305 | .340 | 131.5 | 9.8% | 21.2% | 87.7 | 12.5 | 14.9% | 17.5% |
| McCutchen | 682 | .268 | .379 | .322 | .354 | 130.3 | 7.9% | 21% | 89.3 | 13.4 | 13.9% | 16.5% |
| Puig | 444 | .282 | .340 | .329 | .356 | 124.3 | 12.8% | 27.7% | 88.5 | 12.4 | 13.1% | 18.8% |
For those unfamiliar with xStats, the glossary can be found here. A fair amount of Rosario’s fantasy value is tied to his batting average, having hit .290 and .288 in 2017 and 2018, respectively. But the interesting thing is that his expected batting average (xAVG) is the lowest of the group by a fair margin at .252. We’ll get back to his average later.
Rosario also has the highest poor-hit rate of the group at 31.1%, and the lowest average exit velocity. He also has by far the lowest expected OBP at .289, and it’s no secret Rosario doesn’t like to draw walks. He had an above-average high-drive rate last year at 12%, but you’ll notice yet again it’s the lowest of the four. xOBA+ is a league- and park-adjusted metric that uses batted ball data to attempt to quantify a hitter’s skill level. The average is set to 100, so Rosario’s mark of 92 was below league average.
And finally, Rosario also had the highest pop-up rate (PU%) of the group at 23.6%, which was well above the league average of 18%. Now, this may not be terribly surprising to you—that Rosario’s batted ball data is not that good relatively speaking when we consider how much of a free-swinger he is (41.5% chase rate)—but it furthers the point that he may be overvalued as a hitter.
Batting Average
Let’s get back to Rosario’s batting average and take a look at how he’s managed to exceed batted ball expectations the past few years.
| Year | AVG | xAVG | BABIP | xBABIP |
| 2015 | .267 | .244 | .332 | .288 |
| 2016 | .269 | .247 | .338 | .305 |
| 2017 | .290 | .276 | .312 | .294 |
| 2018 | .288 | .252 | .316 | .272 |
So clearly, Rosario’s average exceeded batted ball expectations for four straight years. At this point, it’s possible and perhaps even likely that he’ll just continue to do so. However, it’s worth pointing out that last year he had his lowest xBABIP mark of the past four years at .272, which was also well below the league-average mark of .309. That also came with a career-high 40.6% pull rate, which, generally speaking, isn’t conducive to supporting higher BABIPs.
The point is, when you consider Rosario’s lack of OBP skills (5.1% BB rate in 2018), his floor is rather dicey; you’re paying a fairly steep price for a player who gets a good portion of his value from a batting average that is sustained by not so great (and perhaps, even poor) batted ball data. Primarily based on his history, a batting average of around .270 is a reasonable expectation. But those anticipating a mark in the .280 to .290 range could be left a bit disappointed.
xwOBA and Hard-Hit Rate
| Name | xwOBA | Hard-Hit Rate |
| Rosario | .298 | 33.2% |
| Hicks | .367 | 43% |
| McCutchen | .358 | 41.5% |
| Puig | .349 | 40.3% |
Expected wOBA, or xwOBA, is calculated using primarily launch angle and exit velocity to determine what a batted ball’s wOBA should be based on comparable batted balls. Again, Rosario at .298 (below average) is well below Puig, McCutchen, and Hicks. The average hard-hit rate is roughly 30%. Rosario’s hard-hit rate of 33.2% is certainly above average, but once again, the other members of the list outclass him.
2019 Steamer Projections
| Name | PA | HR | RBI | R | SB | wOBA | wRC+ | AVG | OBP |
| Rosario | 628 | 25 | 80 | 86 | 9 | .334 | 109 | .277 | .318 |
| Hicks | 614 | 22 | 74 | 81 | 10 | .340 | 114 | .247 | .349 |
| McCutchen | 604 | 26 | 77 | 82 | 11 | .360 | 127 | .263 | .362 |
| Puig | 548 | 26 | 81 | 70 | 14 | .362 | 126 | .275 | .351 |
One of the reasons I wanted to compare these four hitters is I felt they’re all fair bets to return 20+ home runs and potentially 10+ steals. They are all fairly close in projected counting stats, but Rosario has the advantage in batting average. However, Steamer projects Rosario to be the weakest hitter overall in terms of both wOBA and wRC+. Again, he’s also projected to have the lowest OBP by far at .318. I’ve done enough harping on Rosario, so let’s take a quick look at each of the other three hitters and why I’m more bullish on them for 2019.
He may be a few years removed from being an MVP candidate, but McCutchen is still a very good hitter. Last year’s excellent xOBA+ of 130.3 indicates he’s essentially 30% above league average. His 13.9% walk rate was also in the top 5% of the league, which should help his floor in the runs category. And he should still be expected to steal 10+ bags. But the main thing to get excited about for McCutchen in 2019 is that, for the first time in his career, he’ll be in a home park that favors right-handed power.
Per Rotogrinder’s Ballpark Factors, (data is from 2014 to date) both PNC and Oracle Park (formerly AT&T) suppress righty power. PNC has a righty home run factor of 0.73 (1.00 is average), and Oracle Park’s factor for right-handed power was also well below average at 0.75. Meanwhile, Citizen’s Bank Park has a right-handed home run factor of 1.25. That’s a massive shift in McCutchen’s favor. Overall in 2018, CBP was an extremely friendly park for home runs—good for fourth overall.
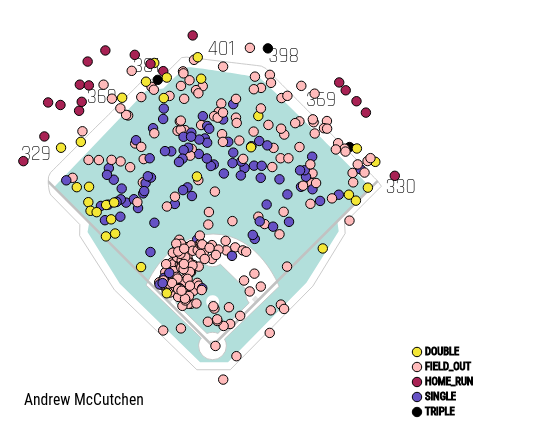
Now, this is admittedly crude on my part, but just to get a rough idea, here is last year’s spray chart overlaid onto Citizen’s Bank Park.

As you can see, McCutchen has a pretty nice spray chart that shows good power to all fields. Considering the much friendlier confines, it’s not too hard to imagine him picking up a few more hits and home runs. Going at an NFBC ADP of 151, McCutchen may just be the best value mentioned here.
Aaron Hicks (ADP of 124) has improved tremendously over the past two seasons. Dan McNamara wrote an excellent piece last year highlighting some of the improvements he’s made. I’ll briefly mention two of the big gains he’s made that tend to go hand in hand for hitters who are improving: plate discipline and hard-hit rate.
In 2016, Hicks’ first year in New York, he had a walk rate of 8.3%. Last year, his 15.5% walk rate was good for fifth among qualified hitters. His chase rate (O-swing) of 20.9% was good for seventh. Hicks also saw a massive spike in hard-hit rate last year at 43% (up from 32.5% in 2017) along with a big bump in xwOBA from .348 to .365. There may be some trepidation in investing in Hicks, with the two free-agent behemoths lurking, but as it stands, he figures to be the de facto leadoff man for the Pinstripers when you consider that his .366 OBP was second on the team (among qualifiers) by a large margin (Giancarlo Stanton was 3rd at .343).
You’d be hard-pressed to find many better spots to hit than in front of Aaron Judge and with half of your games at the bandbox in the Bronx. While Rosario is the better bet for batting average, the big potential for counting stats here along with his terrific OBP makes Hicks such an appealing target. One final thing for Hicks is that this is his last year before free agency. So whether you buy into the narrative that this impacts player performance or not, it’s at least worth mentioning.
Another thing to take away from the Steamer numbers is the 548 projected plate appearances for Puig. That’s a sizable jump from last year’s 444. Similar to McCutchen, Puig (ADP of 122) will also stand to be the beneficiary of a favorable park shift in 2019. He’ll head to the home run haven that is The Great American Ball Park. While Dodger Stadium was just a tick below average for right-handed home runs at 0.94, GABP is very friendly for righty power at 1.18, or 18% above average. Overall, the Reds’ home ballpark was the best for home runs last year. Contrast that to Rosario and his Twins’ Target Park, which is slightly above average for right-handed home runs at 1.05 and 20th overall for home runs last year.
Rosario is, of course, a very useful fantasy player. But his current ADP is tough to justify when you can get three other outfielders who, according to several offensive metrics, are better hitters in arguably more favorable spots than Rosario—and they come at a cheaper price.
(Photo by David Berding/Icon Sportswire)


Nice work. You’ve convinced me Rosario’s overvalued and, FWIW, average hard hit rate was around 37% in 2018, so he was decidedly poor in that category. Check out: https://pitcherlist.com/going-deep-there-must-be-something-in-the-water/
Thanks Dan! Good catch with the HH rate. I used an older value here to give a rough idea. It’s a pretty remarkable trend you mention there that the avg is all the way up to 37% last year. Very good article. It makes you really wonder how baseball calculates this stuff.