


Jackie Bradley Jr. has never been much of a prominent hitter.
He put forth All-Star numbers in 2016, sure, but has since struggled to replicate that success. Bradley has displayed flashes here and there, even as recently as the final month of the 2020 season, yet plate consistency has eluded him for much of his career.
Even with that context, it’s hard to overstate how much Bradley struggled last year. The bulk of his metrics – actual and expected – have never been worse, which made for quite an underwhelming one-season stint with the Milwaukee Brewers.
Bradley returned to Boston this winter, potentially still wondering what went wrong during his National League cameo. The answer seems rooted in a brand new approach he faced from opposing pitchers.
Opponents peppered Bradley with more breaking balls than ever last season. They also began throwing pitches he’s historically struggled with in locations where he tends to hit well.
It was a bold approach to say the least. But a simple look at the results emphatically highlights how well the pitchers won this challenge.
Offensively, Bradley posted career lows in the following stats last season – batting average, OBP, slugging percentage, BABIP, wOBA, and wRC+. Some of these – such as his .224 wOBA and a wRC+ 65% below league average – were woefully lower than his career averages.
Making matters worse, his performance was hardly a result of bad bat luck. The bulk of his expected outcome metrics fell in the bottom 1% of the league. Per Statcast, only four players finished the 2021 season with a lower xwOBA and xSLG than Bradley.
The Brewers obviously didn’t sign Bradley to be one of their marquee hitters last season. Still, you have to imagine they had higher hopes than what they got from him at the plate.
Bradley’s overall performance is perplexing when compared to how he hit during his previous eight seasons. But when you dig a little deeper, specifically looking at his plate discipline, you start to see what caused the problem.
Bradley’s 30.8% strikeout rate last season was the highest of his career. He never swung outside the zone as much as he did in 2021 (31.4%), but his outside zone contact of 48.8% was both a career low and represented a 16.4% year-over-year decrease. His 2021 contact rate (67.6%) and swinging strike rate (15.5%) have never been worse, with each metric notably worse than MLB averages.
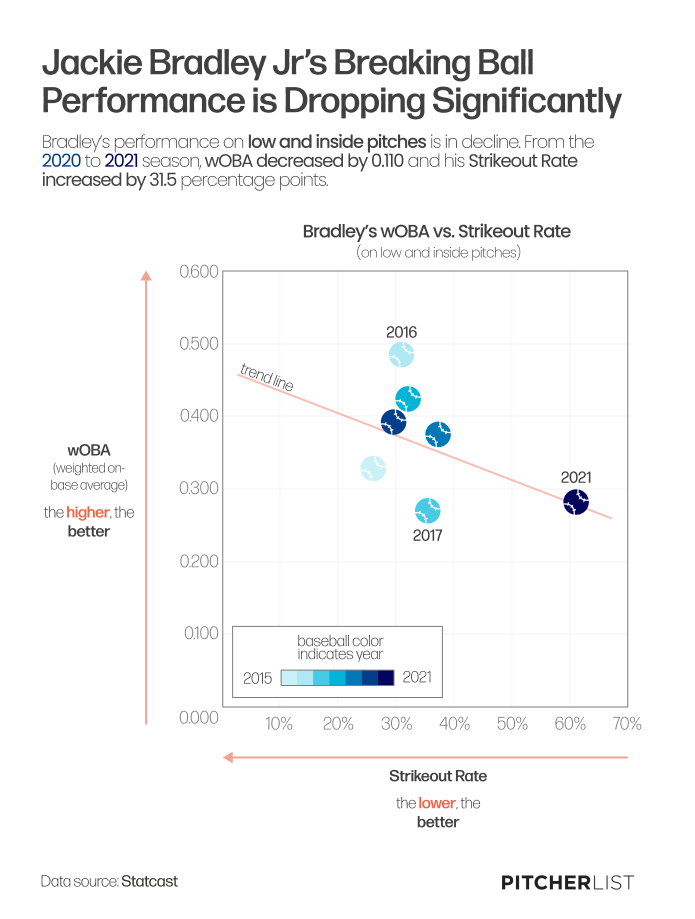
These numbers, it appears, are a result of pitchers throwing low and inside more frequently than ever before (16.0%), targeting an area of the plate where Bradley often sees success.
From 2015-2020, Bradley boasted a .392 wOBA on pitches thrown at the low and inside shadow of the strike zone. As a result, the highest percentage of opposing pitches during that time frame went to the opposite corner.
That changed last season. So, too, did the numbers Bradley put up in that area of the plate.
Created by @visual_endgame on Twitter.
The pitches Bradley was frequently getting in this location – breaking balls – help explain the alarming shifts from last season.
Since 2013, only twice has Bradley posted a season batting average above .211 against breaking balls. His average strikeout rate against curves is 38.9%. His whiff rate against sliders has dipped below 38% just once in the past four seasons.
Pitchers know they can get Bradley swinging on a breaking ball. They leaned into that heavily last year, throwing them at a frequency Bradley has never seen before (32.5%). On top of that, they made major shifts in where those pitches were thrown.
Here’s a look at where Bradley saw curves through the first eight seasons of his career compared to where he saw them in Milwaukee.
And, in a more jarring comparison, where Bradley was seeing his sliders in Boston compared to where they were thrown last season.
It seemed like a strange approach considering the success Bradley has historically seen in this area of the plate. But a quick look at his plate discipline trends – particularly with the slider – is all the evidence pitchers need to see how fruitful this game plan can be.
| Season | Outside Swing % vs. Sliders | Outside Contact % | Swing % | Contact % | Swinging Strike % |
| 2016 | 32.8% | 50.0% | 44.1% | 70.6% | 13.0% |
| 2017 | 32.3% | 47.1% | 48.4% | 63.6% | 17.6% |
| 2018 | 30.9% | 31.4% | 49.7% | 58.0% | 20.9% |
| 2019 | 33.9% | 44.2% | 46.8% | 60.8% | 18.3% |
| 2020 | 14.6% | 28.6% | 41.9% | 66.7% | 14.0% |
| 2021 | 37.3% | 36.0% | 52.5% | 57.5% | 22.3% |
Overall, 38.1% of two-strike sliders thrown against Bradley resulted in a strikeout last year, the highest putaway percentage of any pitch he’s seen at least 115 times in a given season. This might also help explain some notable shifts in his slider strike percentage last season compared to the rest of his career.
What contact Bradley did make was hardly impressive, as his overall batted ball profile against sliders completely plummeted in 2021.
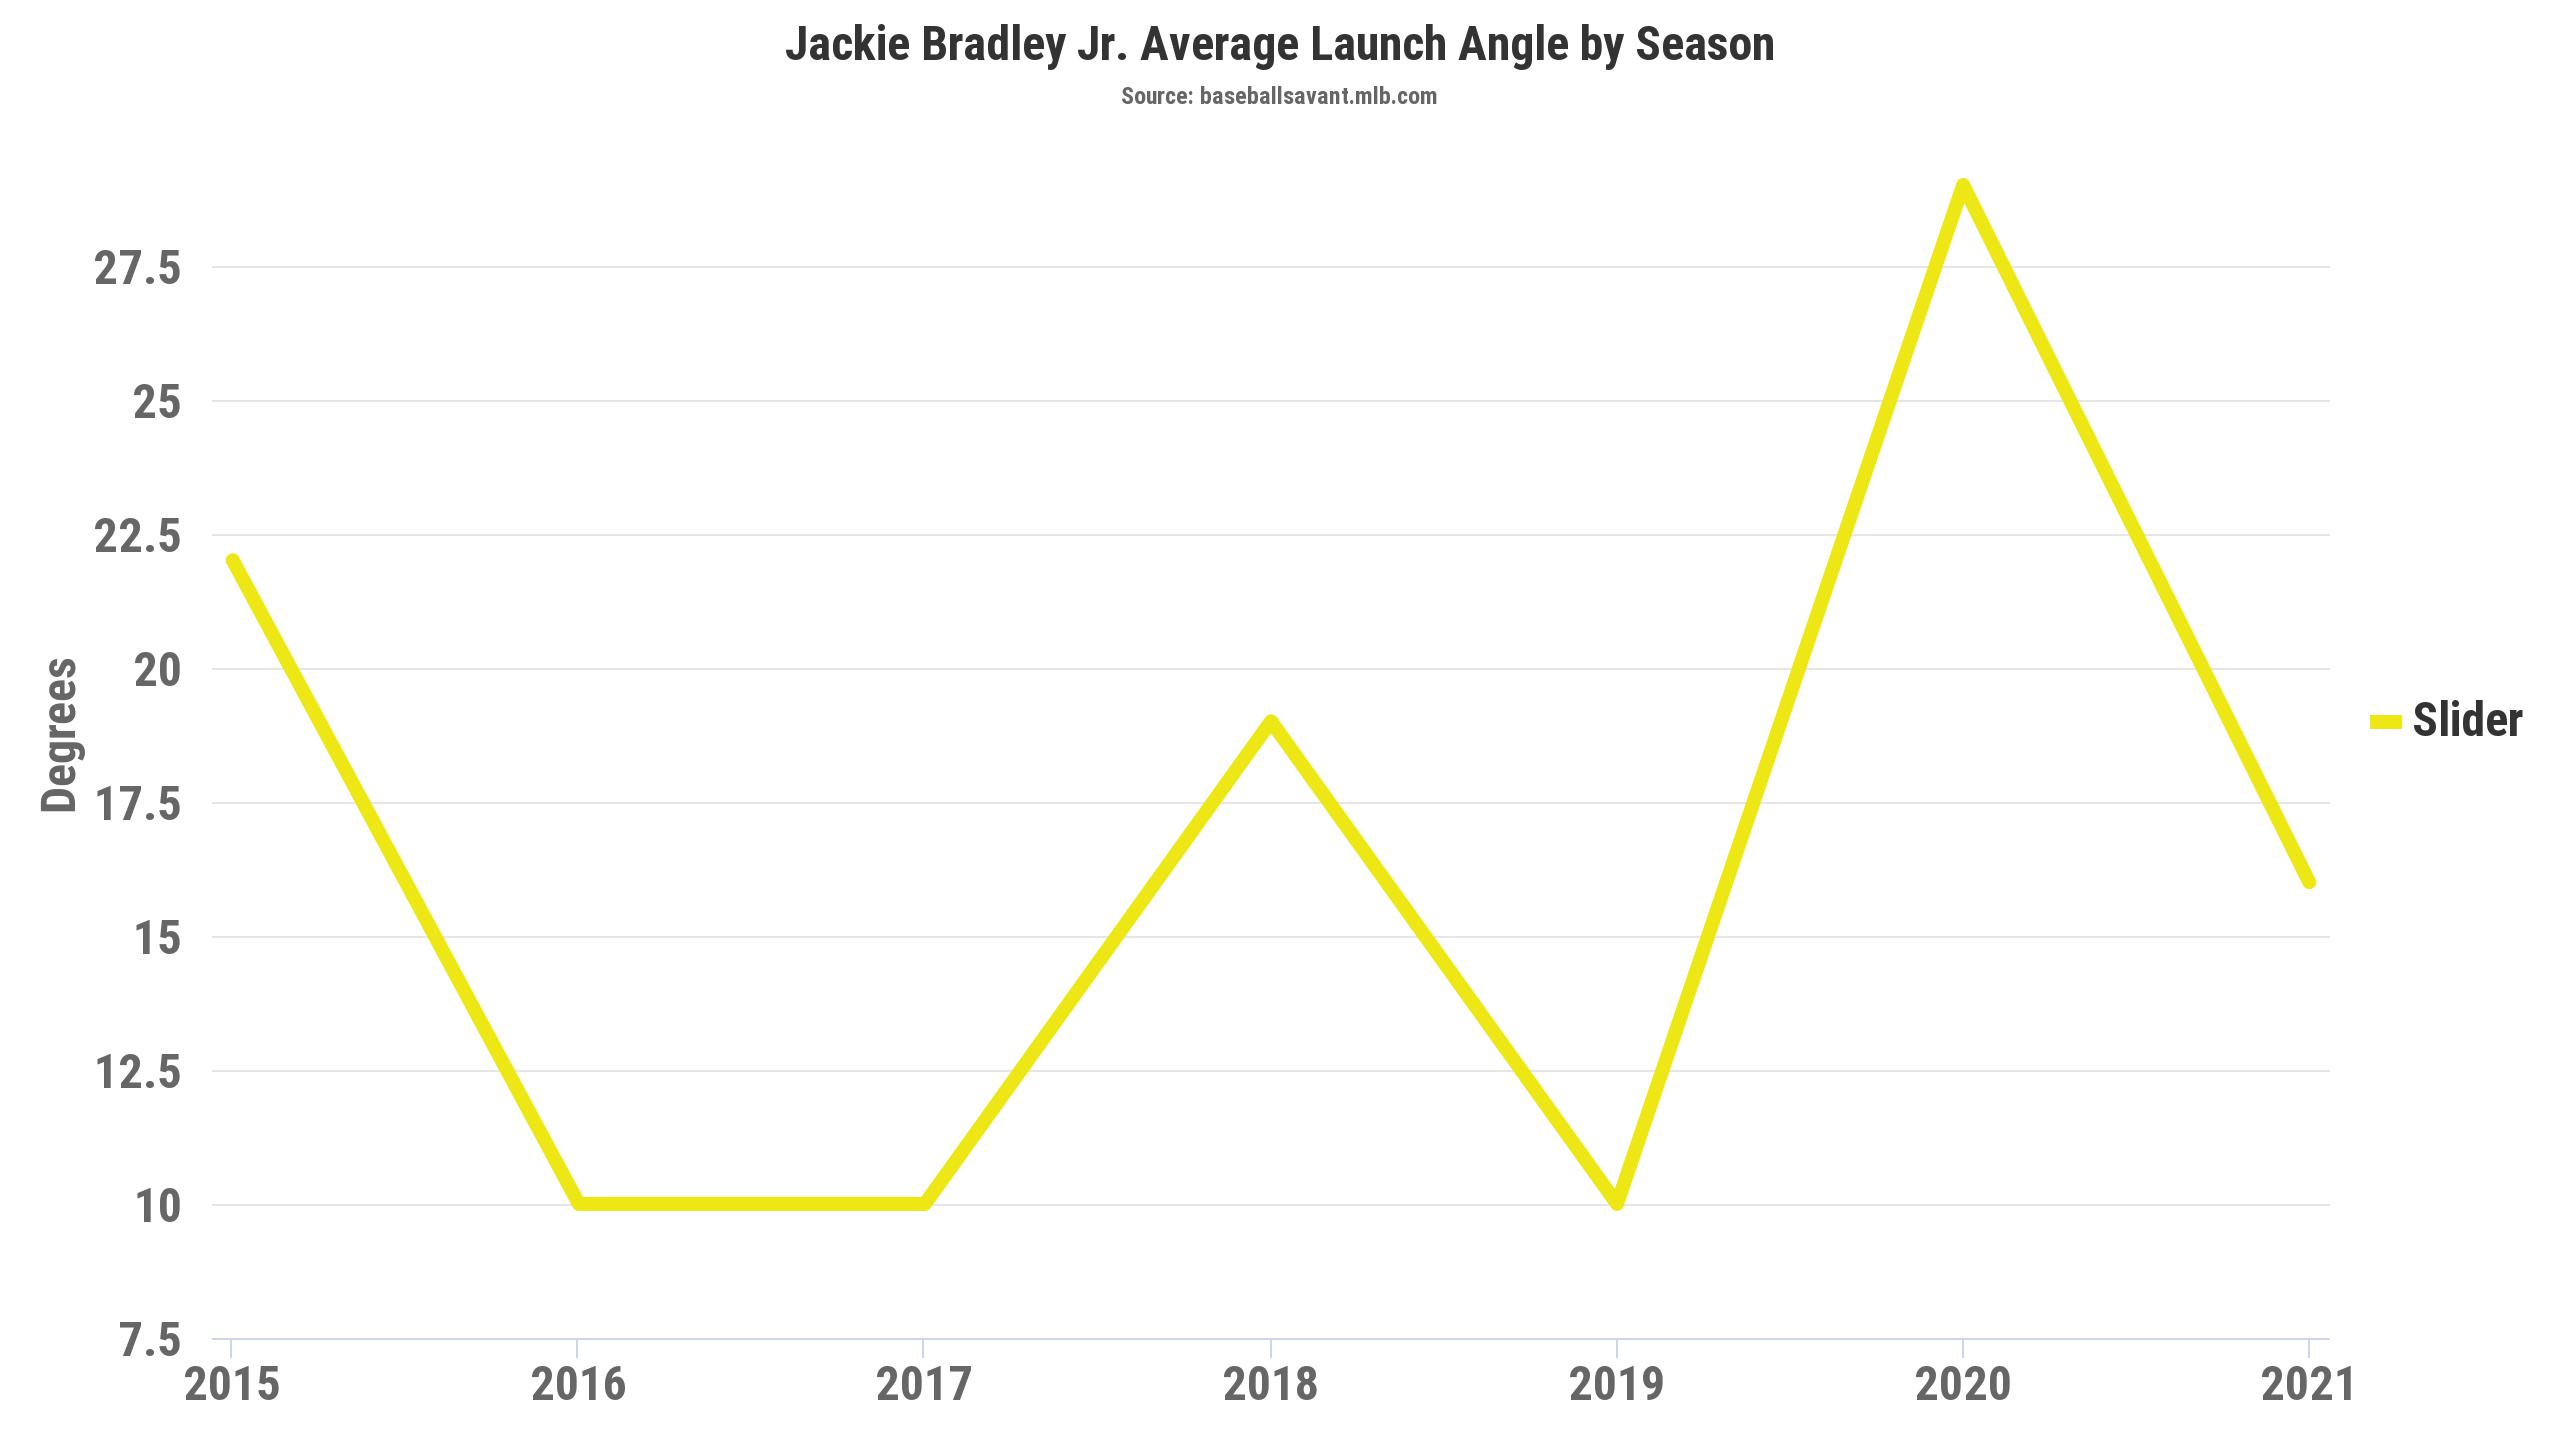
Data and graphic provided by Statcast
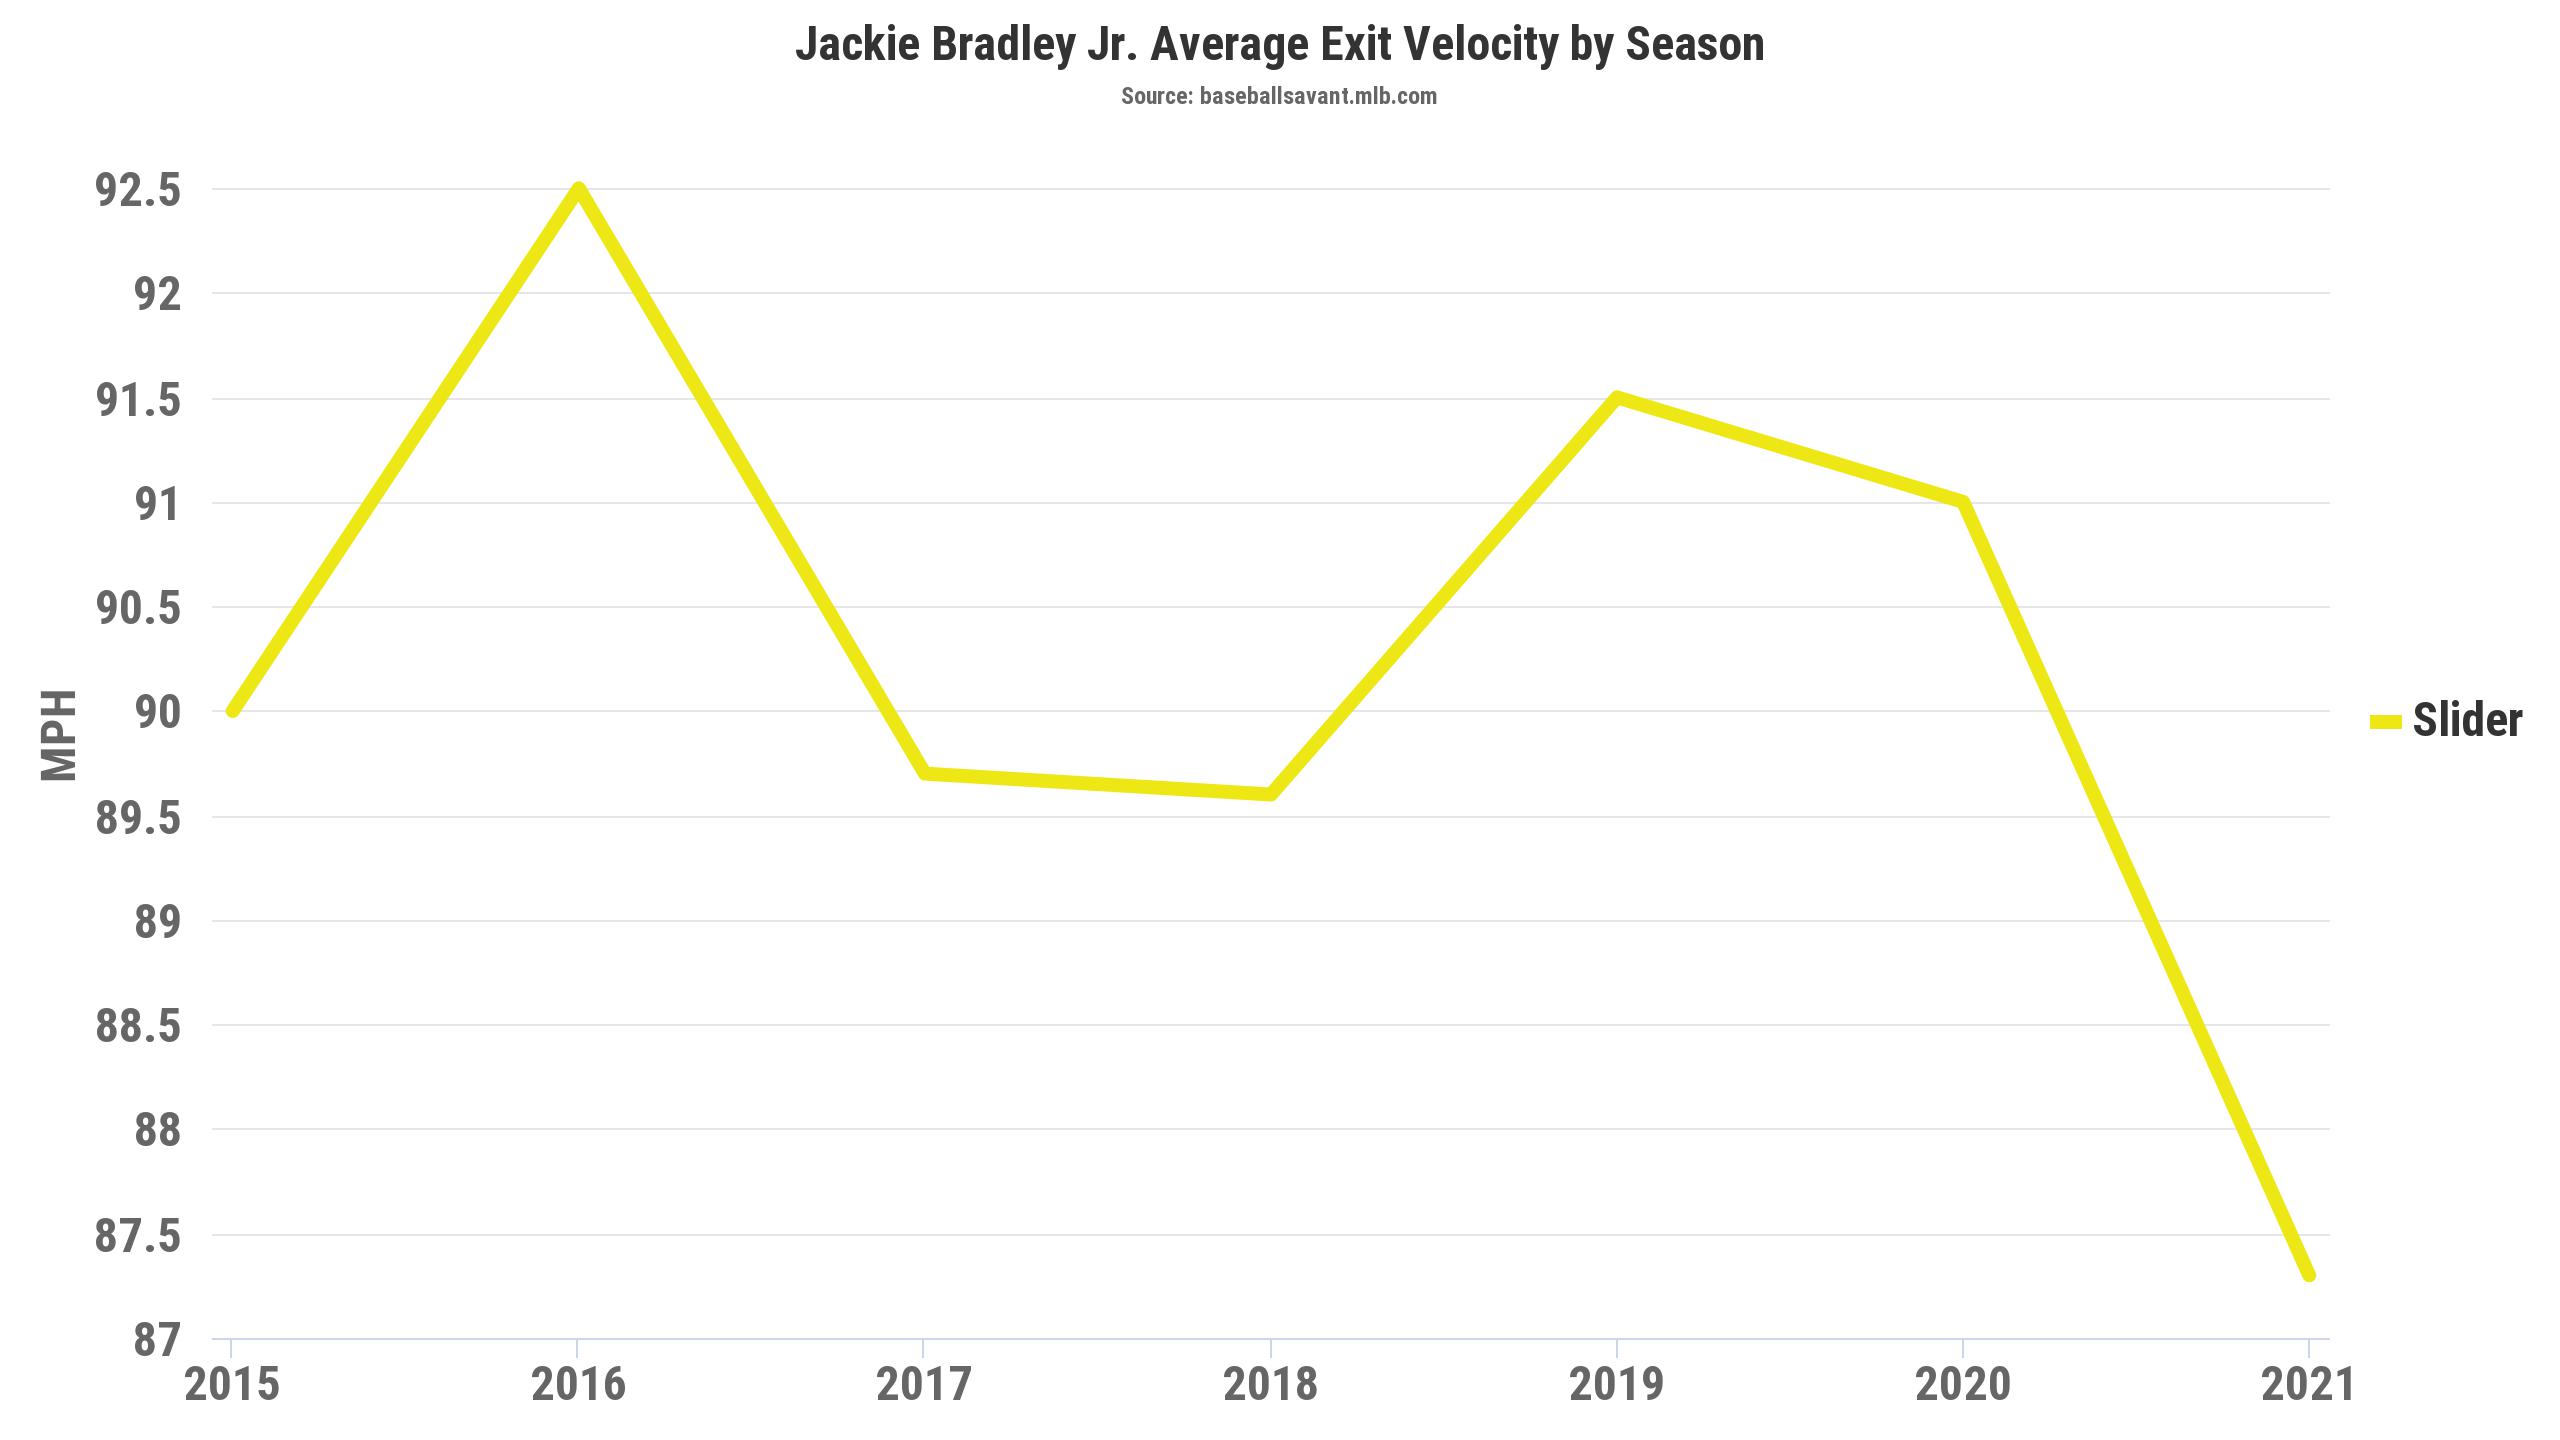
Data and graphic provided by Statcast
That this significant drop in production is all based on a simple location change should imply it’s something Bradley can navigate through. But his history against the pitches in question ought to create concern for anyone who sees him as a late-round fantasy option.
Opponents have a blueprint to use against Bradley this year. Until he provides significantly improved results, there’s no reason to believe they won’t keep peppering him with it.
Photo by Frank Jansky/Icon Sportswire | Adapted by Michael Packard (@artbyMikeP on Twitter and Instagram)
