


Whether it was a poor performance at the plate, dugout altercations with a teammate, booing the Mets’ fans, or the missed time due to injury, Francisco Lindor’s first season with the New York Mets did not go according to plan. Signed to a monster ten-year, $341M contract extension at the start of last season, Lindor produced a middling 2.7 fWAR thanks to a below expectations .230/.322/.412 slash line (103 wRC+) that was buoyed by his usual excellent defense and solid baserunning. By fWAR, Lindor ranked just 18th out of 26 qualified shortstops.
However you want to look at it, Lindor’s 2021 was not what the Mets thought they were getting when they traded for the shortstop and agreed to that long contract. His offensive performance represented the continuation of a slump that went back to the shortened 2020 campaign while he was still in Cleveland.
After producing a cumulative .288/.347/.493 (120 wRC+) line in his first five big league seasons with the now-Guardians, Lindor’s bat has fallen off sharply the past two seasons:
Just about no one expected that his outstanding 2018 campaign would become a new baseline standard, but most would have felt it was a safe bet that his roughly 20% above league average marks in the seasons around that superlative campaign would be a reasonable annual expectation. Instead, he’s been in a prolonged slump that’s lasted for more than a full season’s worth of plate appearances
But now Lindor is off to a strong start to his second season in New York. In 89 plate appearances through games played on April 27, Lindor has hit .273 / .360 /.494 (.378 wOBA, 156 wRC+) with four home runs. His hot start begs the question – is the old Francisco Lindor back?
Searching for a cause
It would be fair to characterize Lindor’s production at the plate the previous two seasons as just a prolonged slump. Many of the usual stats we rely on to explain away a tough stretch for a good hitter continued to show in Lindor’s favor. Batted ball luck? His batting average on balls in play the past two seasons was .259 and far worse than the .300 cumulative BABIP mark he ran prior to 2020. Contact quality? His average exit velocities, barrel rates (both overall and per PA), hard-hit rates, and sweet spot rates the past two seasons were in line with or better than the previous five seasons. He has not seen a major change in launch angle or in his batted ball profile in terms of batted ball type or spray charts.
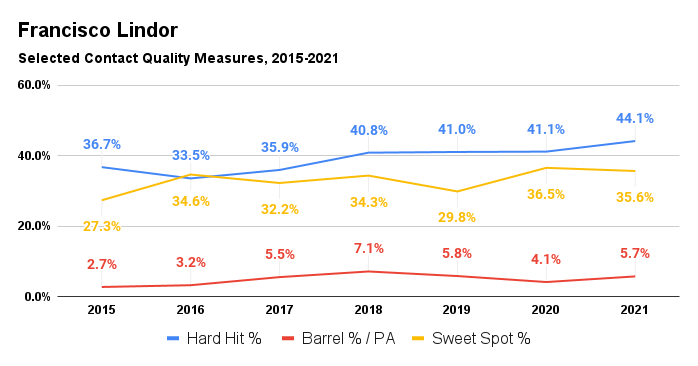
Data from Baseball Savant
At worst, Lindor’s surface-level contact quality stats have held steady over time. You could argue they’ve slightly improved. Unsurprisingly, then, his suite of expected statistics is all in line with the past, too.
Given all that, you’d be forgiven for concluding he’s more or less been the same as he always was, but with poorer luck. With time, he should snap out of it, as our Chad Young concluded early on last season.
About a month after Chad’s piece, FanGraphs’ Ben Clemens also took a look under Lindor’s hood. Clemens got even more granular with Lindor’s results on contact and found that Lindor had lost some line drives that had turned into far less productive grounders and popups. In addition, a higher fraction of Lindor’s barrels, which were many of the line drives that he did hit, were being classified as “weak barrels” instead of more productive “blasts.”
In the end, though, Clemens’ also generally concluded that Lindor was doing mostly the same things he always had, with the explanation that Lindor is a volume hitter who puts the ball in play a ton. The comparison Clemens made was when Lindor hit a career-high 38 homers in 2018, he put 560 balls in play, the second-highest total in the majors. Mike Trout bested him by a single home run, but he did so on 351 balls in play. Teammate José Ramírez turned 504 batted balls into 39 homers. As a result, any kind of negative shift in his production on contact can have a notable effect on his overall production. Nonetheless, it was seen as a rough patch of luck that should turn around with time.
One thing that all the data tables, graphs, and links I’ve shown you so far have not covered is the fact that Lindor is a switch-hitter. It’s frequently the case when a switch hitter slumps that one side of the plate is the culprit more than the other. But that does not seem to be the case here:
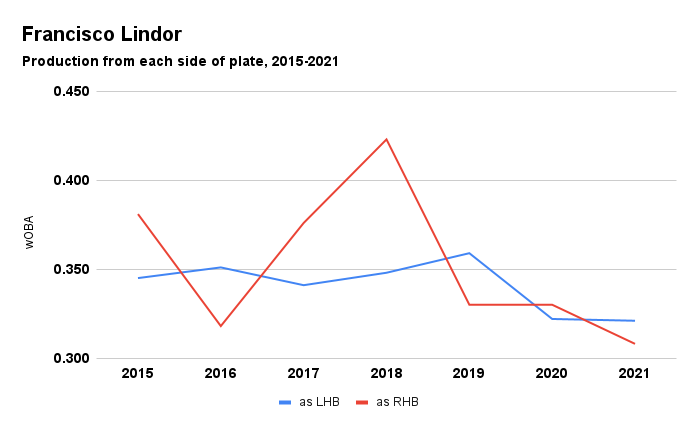
Data from FanGraphs
Aside from a clear spike in production from the right side of the plate in 2017 and 2018 (from where he takes about 31% of his plate appearances because of the preponderance of right-handed pitchers in baseball), Lindor’s splits have generally moved together, especially in 2020 and 2021. Whatever was causing his production to fall was happening from both sides of the dish.
As forecasted by Young and Clemens (among others, surely), Lindor started to show signs of life at the plate in June and July last season. Across 168 PAs in those months last season, he hit a familiar-looking .264/.358/.465 (.356 wOBA) and knocked seven home runs while running 17.9% and 10.7% strikeout and walk rates, respectively.
Then came the injury. Lindor missed about five weeks with an oblique injury in July and August last season. When he returned, the rest of his season also looked like he was closer to his prior good form, especially in the power department. In 156 PAs in August and September, Lindor delivered a .239/.316/.500 line (.340 wOBA) while socking nine home runs, including a three-home run game against the cross-town rival Yankees.
Lindor was back. Except he was different. He regained the power stroke but sacrificed contact and plate discipline to get it. Lindor has always been a high-contact, low-strikeout rate, average-walk rate hitter. After returning from his oblique injury he made less contact (73.4% vs. 79.6% before the injury), chased out of the zone more (35.1% O-Swing vs. 27.5% before), struck out more (22.9%, and walked a little less (10.6%). While he was again producing around 20% better than league average, how he was generating that offense was quite different than before.
Hot start to 2022
The trade of plate discipline for aggression in the pursuit of power-hitting is a common conundrum for hitters as they start to age and lose some of their physical ability and bat speed. No longer quite as explosive and quick, they might have to cheat a little to catch up to the fastball, which makes them more vulnerable to breaking and offspeed pitches, especially out of the strike zone. Lindor’s stats in the last few weeks of last season could be an early indicator that he was starting to enter that phase. But at just 28, that would be happening earlier than typically aging curves would expect and much earlier than the Mets and their fans would want.
It could also just be a blip. Players have peaks and valleys over a few hundred plate appearance stretches all the time. Lindor himself, while not quite reaching the heights it did last season, has had stretches where his strikeout rate has crept up over 20% before:

Data and Graph from Baseball Savant
You can see that he’s tended to knock that back down, often significantly. He might be in the process of doing that again.
So far in April this season, there are a lot of signs that the Lindor of yore is really back. With the obligatory caveats about small sample sizes, April weather, and all the rest, Lindor’s data looks more like what we would expect from him. Yes, he has hit .273 / .360 /.494 (.378 wOBA, 156 wRC+) with four home runs in the early going. He’s also delivered that powerful line with stronger plate discipline. His strikeout rate is 14.6%, almost perfectly in line with his career norms. His walk rate is 11.2%, better than his career averages.
Not everything is sunshine and roses, though. His batted ball data like hard-hit rates, barrels, exit velocities, and sweet spots are all a little down, but not dramatically so. On the positive side is that his average exit velocity on fly balls and line drives is up almost two miles per hour over last season, suggesting he’s again making better quality contact on the most productive batted balls types. Ultimately, though, this kind of data is very noisy this early when he’s only put 65 balls in play. The changes showing right now could just be nominal fluctuations in the end. That can be true while we also acknowledge that his overall production this season has not been propped up by good batted-ball fortune. His BABIP is .279, better than last season’s .248, but still below his career average (.292).
Perhaps more importantly for his long-term outlook is that the strikeout and walk rates have been supported by more contact. Lindor’s whiff rate is back down to 18.3% and he’s making contact on pitches in (87.6%) and out of the zone (69.6%) at rates higher than his career averages (87.2% and 68.8%, respectively).
Interestingly, Lindor is doing this by swinging less. His overall swing (44.8%), first pitch (18%), in-zone (63.1%), and meatball (69.6%) swing rates are all career-lows. It’s early, but it suggests a deliberate change in approach to be more selective.
The data tracks with Lindor’s public comments about hitting the reset button coming into year two in New York. “Life was a little faster for me last year,” Lindor told reporters in spring training. “It wasn’t what I wanted. It was a lot of things happening, and I was trying to get my routine.”
It’s understandable that he would have trouble getting into a comfortable routine after a strange 2020 season and a whirlwind offseason. The past two years have been anything but routine for everyone as it were and it’s logical that would be exacerbated by the addition of a new baby, getting traded to New York, and the addition of all the expectations that come with a huge extension in a large market. Lindor is hardly the first player to struggle in their first season in New York.
“But ultimately it comes down to me not being consistent,” Lindor said in Spring Training. “And I think that’s something I have to do this year — be more consistent from the beginning. Life was a little fast for me. It’s part of the game. Live and learn.”
So far, at least, it looks like his new approach is helping him once again be the player he was.
All 2022 data is through games played on April 27. Photo by Mark Goldman/Icon Sportswire | Design by J.R. Caines (@JRCainesDesign on Twitter and @caines_design on Instagram)