While it’s still early, we can start to gain more confidence in 2024 season data. Now is the time to jump on hot starts to gain an edge over your league-mates. However, if you’re going to jump ship this early on your draft picks, you’ve got to be confident in who you’re picking up. Here are four players off to hot starts. Let’s see if it makes sense to be aggressive in picking them up or trading for them.
Zack Littell, SP, Tampa Bay Rays
Zack Littell has spent the first few years of his career bouncing around between the Twins, Giants, Red Sox, and Rays. He is 28 years old and was an 11th-round pick in the 2013 draft. FanGraphs only gave him a 40-grade Future Value. I wouldn’t say he’s been dominant this year, but he’s been better than many expected. He has a 3.02 ERA, 1.28 WHIP, 24.1% K%, and minuscule 3.7% BB%. The WHIP is bad of course but the K%-BB% is good. He’s also earned more WAR this year (1.3) than his previous 259 IP combined.
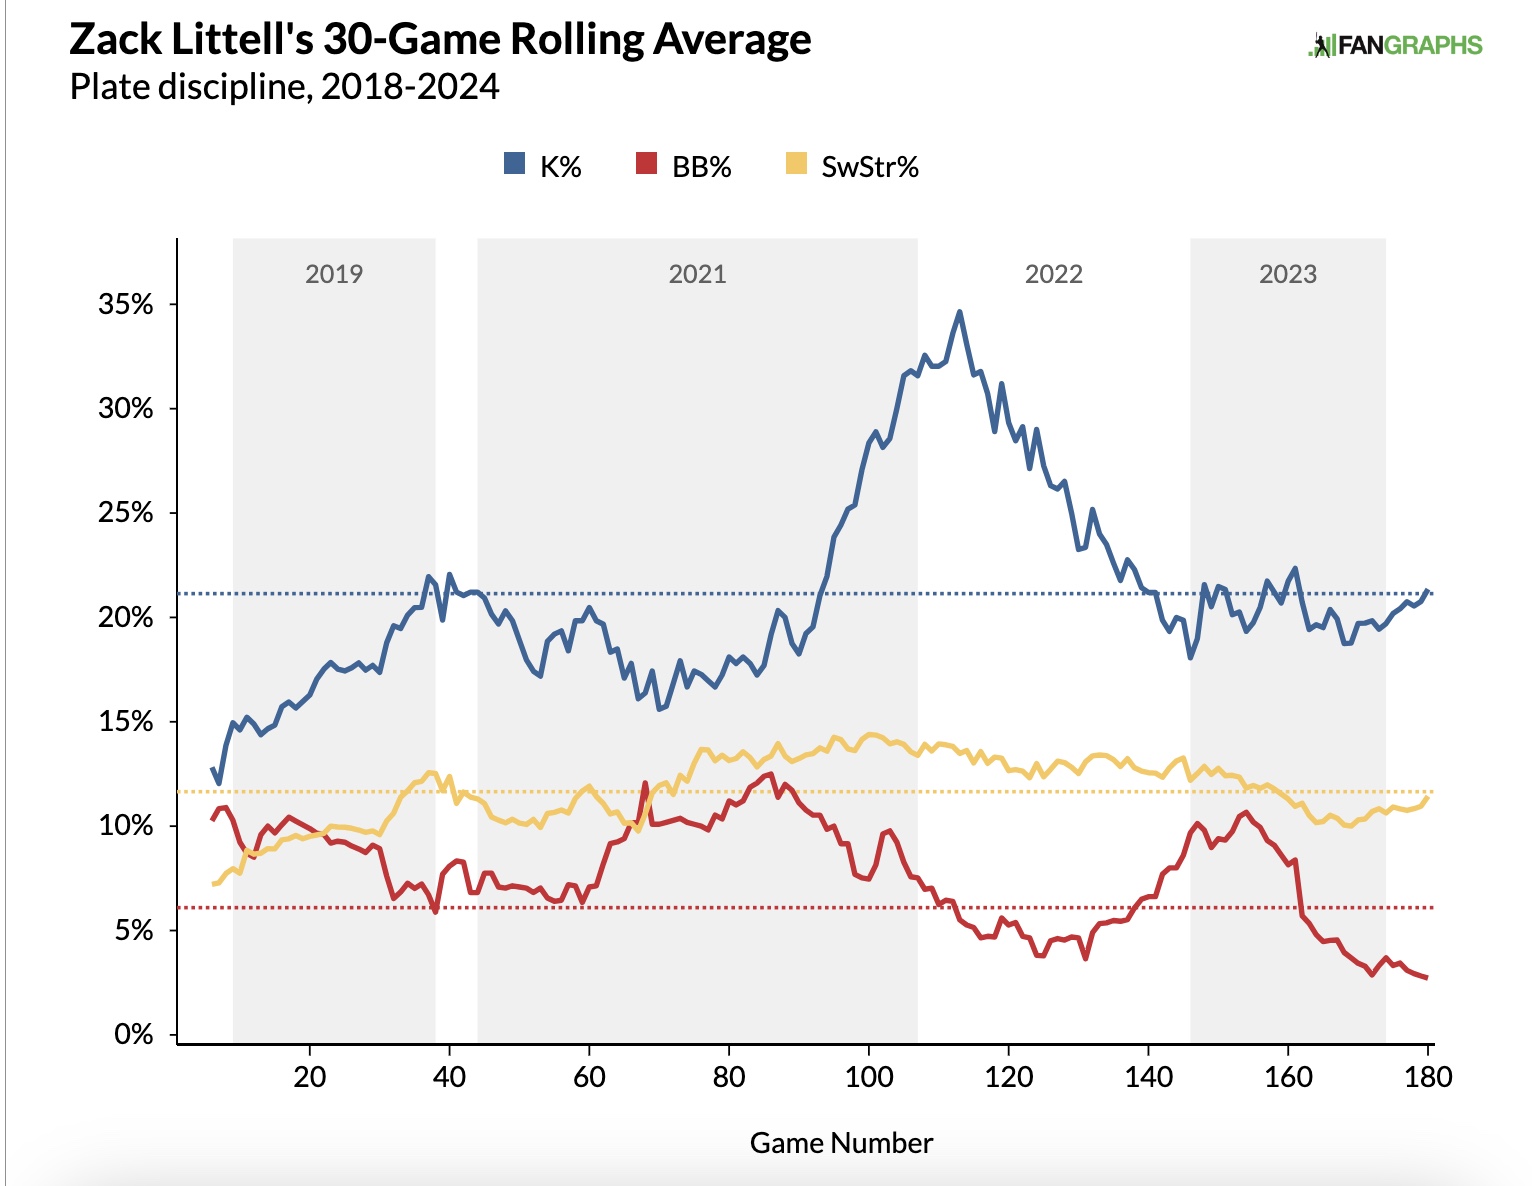
His K% and BB% (aside from a big jump in early 2022) have steadily improved while his Swinging Strike% has roughly been level. His GB% (36.8%) is 22nd percentile while his FB% (33.8%) is 51st percentile. This must mean that his LD% is very high, and it is at 29.3% (9th percentile). LD% is finicky, however, and his has been throughout his career, so this is likely to drop as the season goes on. His Pull% is just 28.4% (2nd percentile) and his Cent% is 43.3% (95th percentile).
His slider is his most used and best pitch. He throws it 34%. PLV grades it as 81st percentile and Stuff+ gives it a 104. He also throws it relatively hard at 86.9 mph. It has a 75.0% Strike% (96th percentile) and 72nd percentile ICR at 30.6%. He also throws a splitter, four-seamer, sinker, and sweeper. They all have below-average velocities. Littell has very high Zone%, Strike%, and Swing% on all his pitches. All of them are 92nd percentile or higher.
Verdict: Not legit. He throws a lot of slow pitches that don’t move much high and horizontally down the middle. They don’t get hit hard (90th percentile Hard Hit%), but they are line drives up the middle. He does have a 107 Location+ and maybe he is very good at sequencing. I just have a hard time believing in someone who has an overall Stuff+ of 83, a four-seamer Stuff+ of 50 and a sinker Stuff+ of 80. PLV likes him more at 72nd percentile. I just can’t see him keeping it up. In addition, he’s faced Toronto, Colorado, the Angels twice, Detroit, the White Sox, the Mets, and the Yankees. That must be one of the easier offensive groups any SP has faced so far. The 1.28 WHIP is more indicative than any of his other numbers.
Jon Gray, SP, Texas Rangers
Jon Gray has a 2.36 ERA, 1.20 WHIP, 25.5% K%, and 6.3% BB%. That 19.3% K-BB% is 23rd among Qualified pitchers. It is also the best of his career.
Gray has primarily been a slider-fastball guy his whole career and this year he is throwing them 46% and 41% respectively. He mixes in the occasional changeup and curveball, but they are thrown so infrequently that we’ll focus on the first two. He throws the slider 88.6 mph which is 92nd percentile. It gets very little horizontal break but has 87th percentile iVB. PLV considers it 70th percentile, but Stuff+ gives it just a 90. Let’s split the difference and give it average stuff.
He does a really good job keeping it low. It has an 80.8% loLoc% (92nd percentile). He also keeps it away from batters, regardless of handedness, but especially against RHBs. It has a 71st percentile oLoc%. Location+ gives the slider a 106 and his overall Location+ is 104. The outcomes against it have been middling. It has a 58th percentile ICR, .220 wOBA (67th percentile), and a .266 xwOBA (53rd percentile).
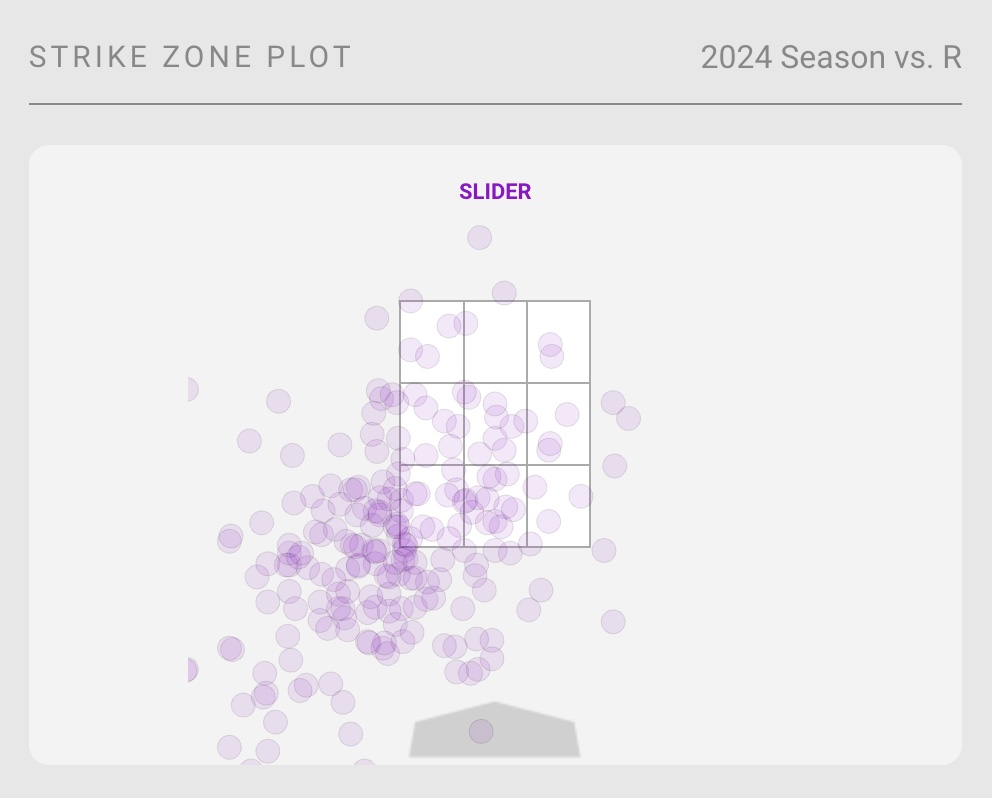
The four-seamer is thrown 94.3 mph and has just 12.2″ of iVB (12th percentile). PLV considers it 30th percentile and Stuff+ gives it just a 73. The only thing that seems to be saving it is location. It has a 103 Location+. He also throws it low a lot. It has a 33.6% loLoc% (89th percentile). It has 40th percentile ICR, a .368 wOBA (39th percentile), and .328 xwOBA (55th percentile).
Verdict: Not Legit. Gray’s slider has just a 37.0% Zone% (31st percentile), but a 46.8% O-Swing% (92nd percentile). This is behind the 20.1% Swinging Strike% (75th percentile). I think he is using his poor four-seamer low in the zone to generate chases on his OK slider out of the zone. I think either his good command so far will fail him, or hitters will catch on and be better at laying off the slider. There is little reason to be scared of the four-seamer. What he’s done so far is his ceiling, and I don’t expect it to continue.
Ryan Jeffers, C, Minnesota Twins
Jeffers’ .420 wOBA is tied with Juan Soto for the 4th best in baseball. Ohtani, Ozuna, and Betts are ahead of them. His previous best season was 2023 when he had a .369 wOBA. He’s generally been thought of as a good hitter, but he hasn’t been able to stay healthy. From 2021-2023 he averaged just 288 PAs. He already has 140 PA this season, but I’m not going to try to predict if he is going to remain healthy. So, is Jeffers going to continue to be one of the league’s best hitters, or revert back to a decent-hitting catcher?
To start, he doesn’t turn 27 until early June, which is younger than I would’ve guessed. The most notable improvements are his .325 ISO (best in baseball) and his 19.3% K%. He can’t be expected to maintain that kind of ISO, but is something in the upper .200s possible? He has 31st percentile sprint speed so that is not behind it. He set his career-high Max EV of 117.4 mph. That’s 99th percentile. This year his hardest hit ball was 113.9 mph. I expect him to maintain that max power for at least the next few seasons.
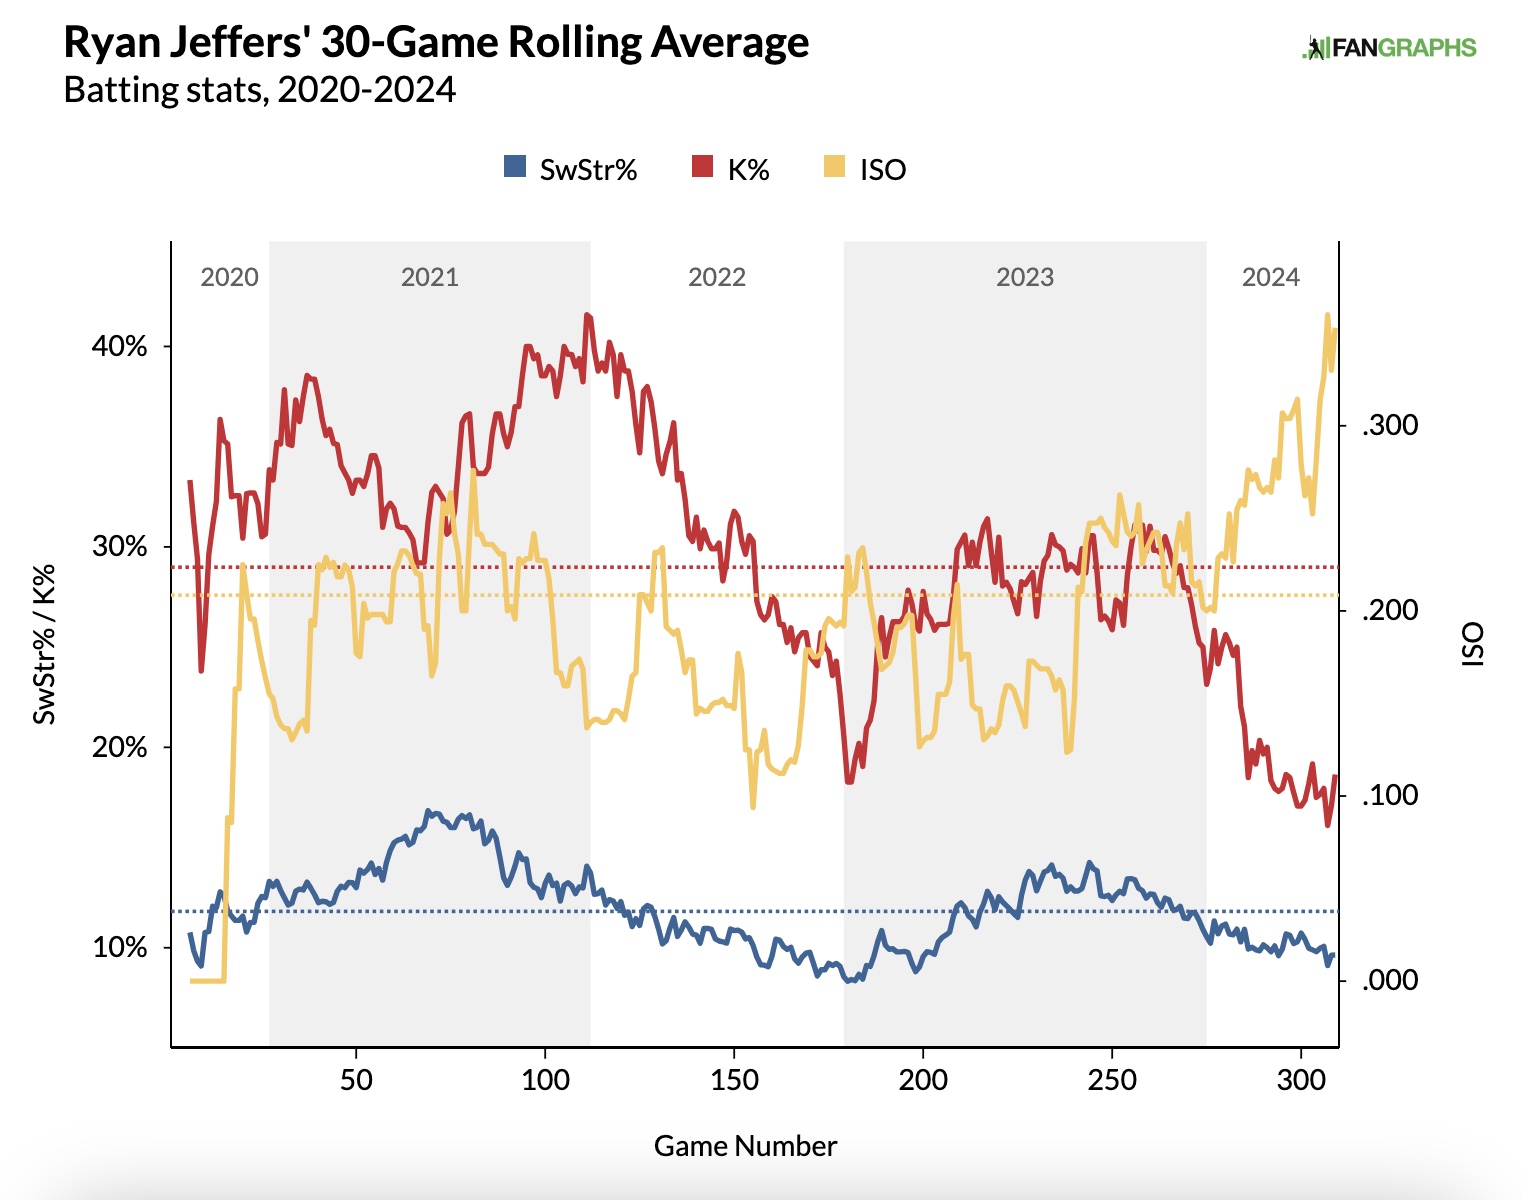
That combination of increased ISO and decreased K% is excellent, but they don’t explain each other. He has decreased his Swinging Strike%, but it was about the same in 2022. His other plate discipline metrics aren’t significantly different than 2022 either.
Verdict: Somewhat legit. Most of Jeffers’ numbers are very similar to 2022 when he posted just a .287 wOBA. I believe he was unlucky that year. Conversely, he is likely getting somewhat fortunate this year. He has a 22.5% HR/FB%, despite an 81.3 FB EV (7th percentile). He is pulling the ball at a career-high 45.8% (71st percentile). This allows him to get to more of his power. I think the .369 wOBA he posted last year is realistic. This is above average, especially for a catcher. If he can stay healthy, I’d definitely take that on my team.
Jo Adell, OF, Los Angeles Angels
Jo Adell was the 10th overall pick in 2017 and, despite being just 25, is generally thought of as a bust. 50/70 Game Power, 70/70 Raw Power, and a 60 FV will create lofty expectations. His biggest issue has been his career 33.8% K%. FanGraphs gave him just a 30/45 Hit tool and he struggled with Ks in the minors. This year he has that all the way down to 24.5% and his wRC+ is by far a career-best 141.
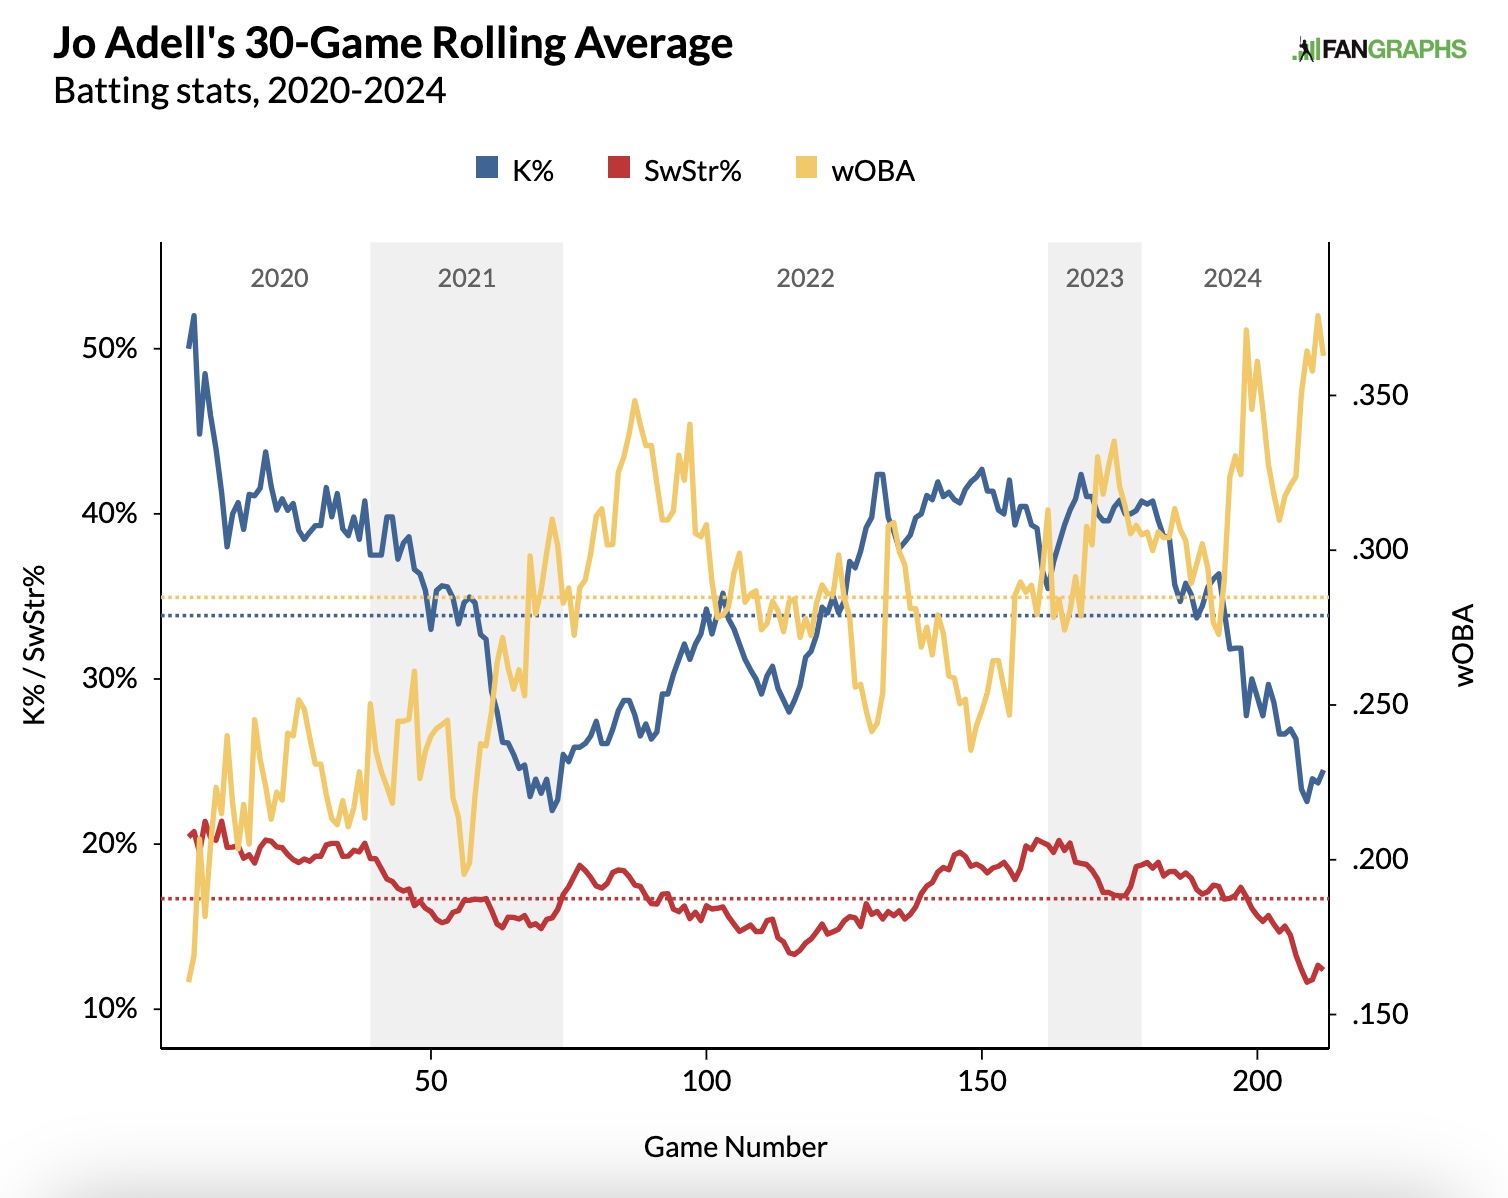
It’s pretty simple with Adell. If he makes enough contact he will likely be at least an above-average big league hitter.

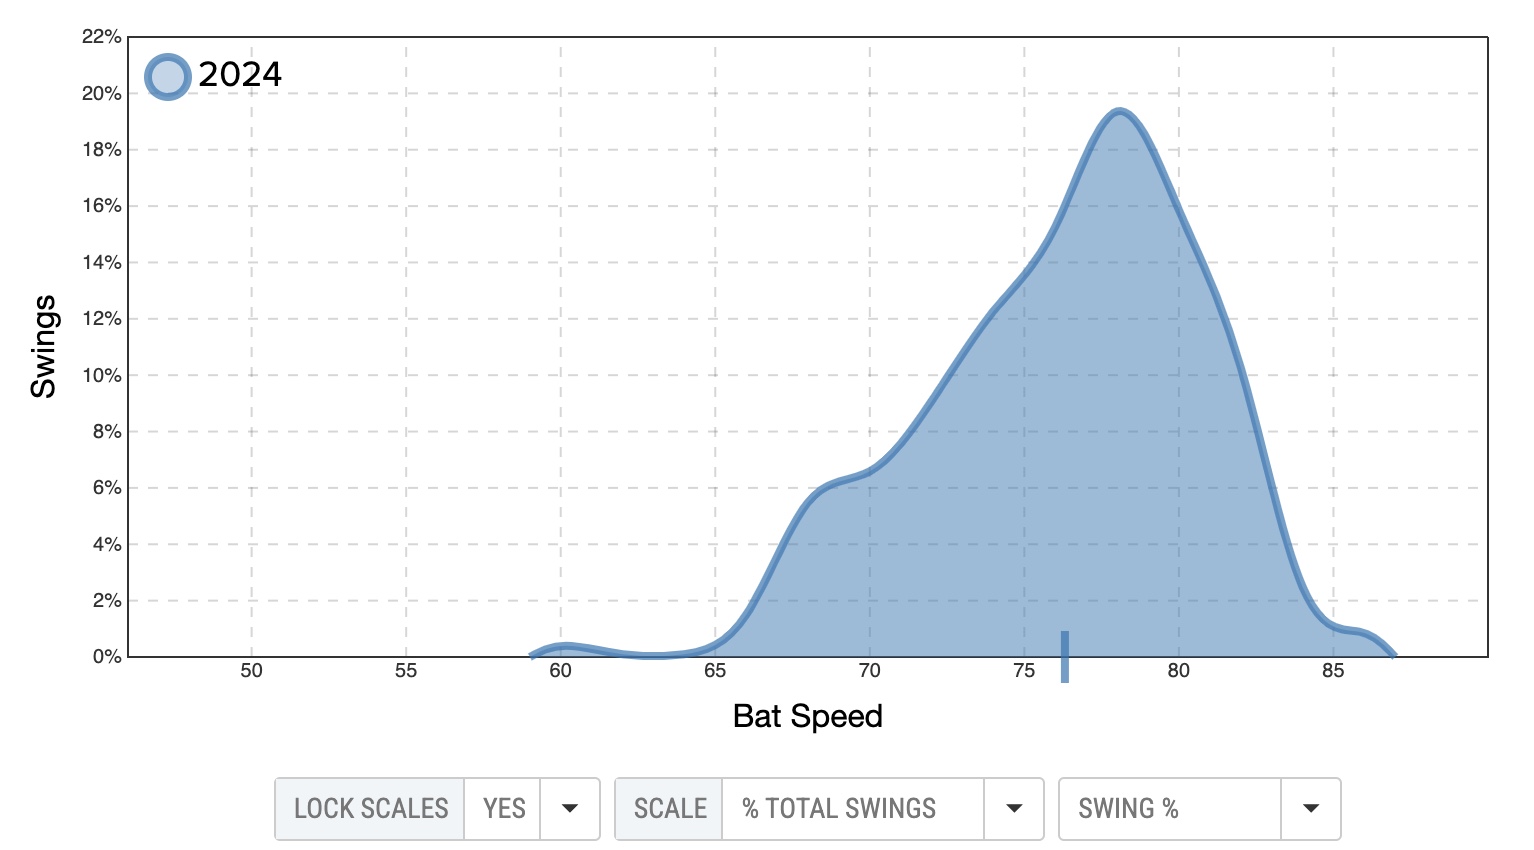
The sharp decline in Swinging Strike% this year coincides with an increase in Z-Contact%. It’s up to 78%, but that’s still just 20th percentile. Hot off the presses is Adell’s 95th-percentile Bat Speed. This is unsurprising as he’s had at least 90th percentile Max EV throughout his career.
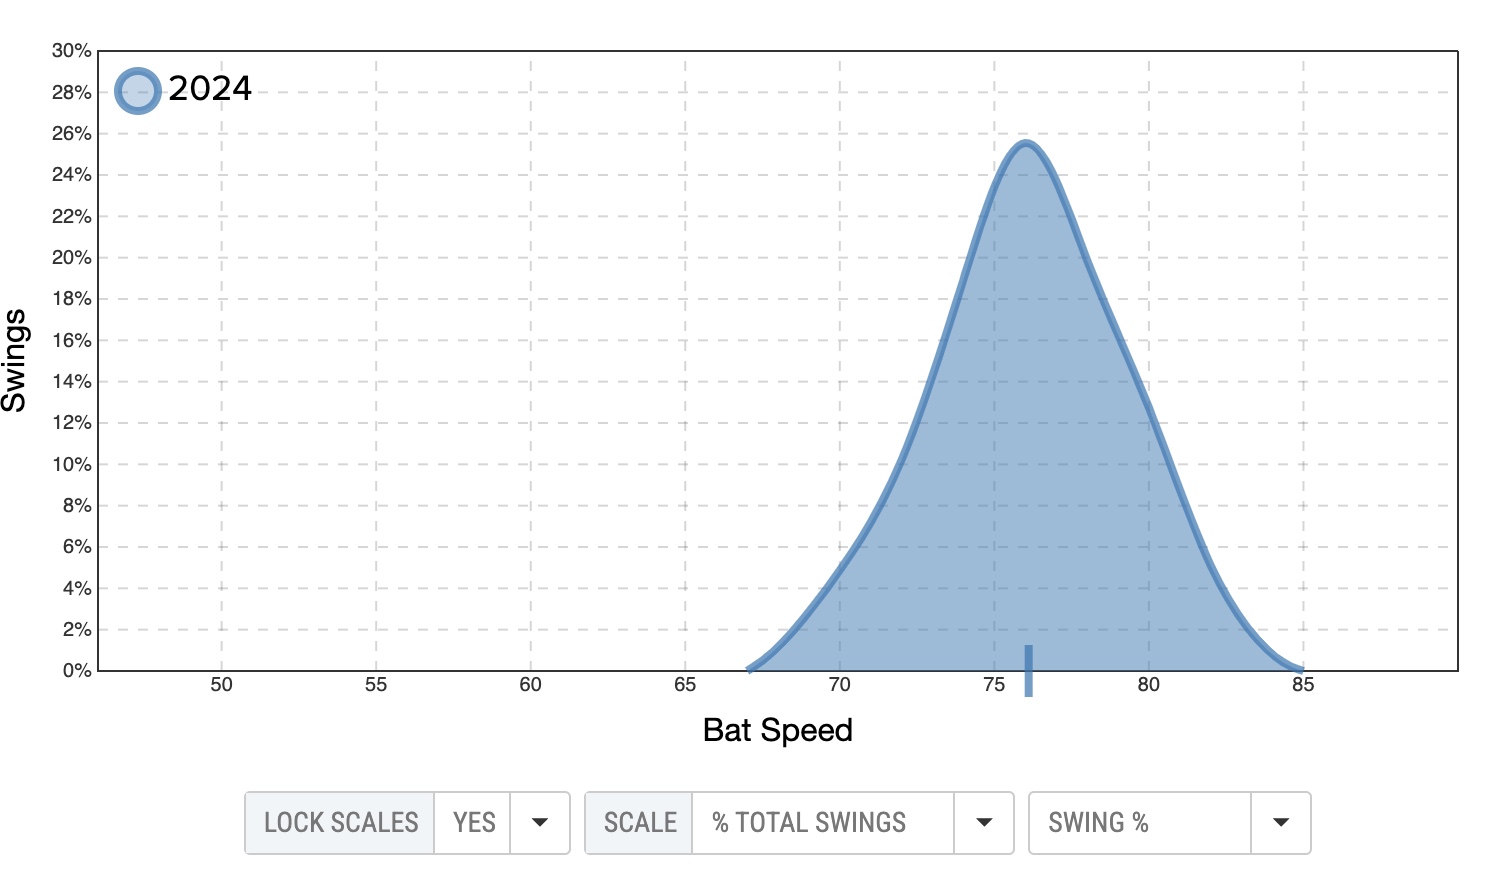
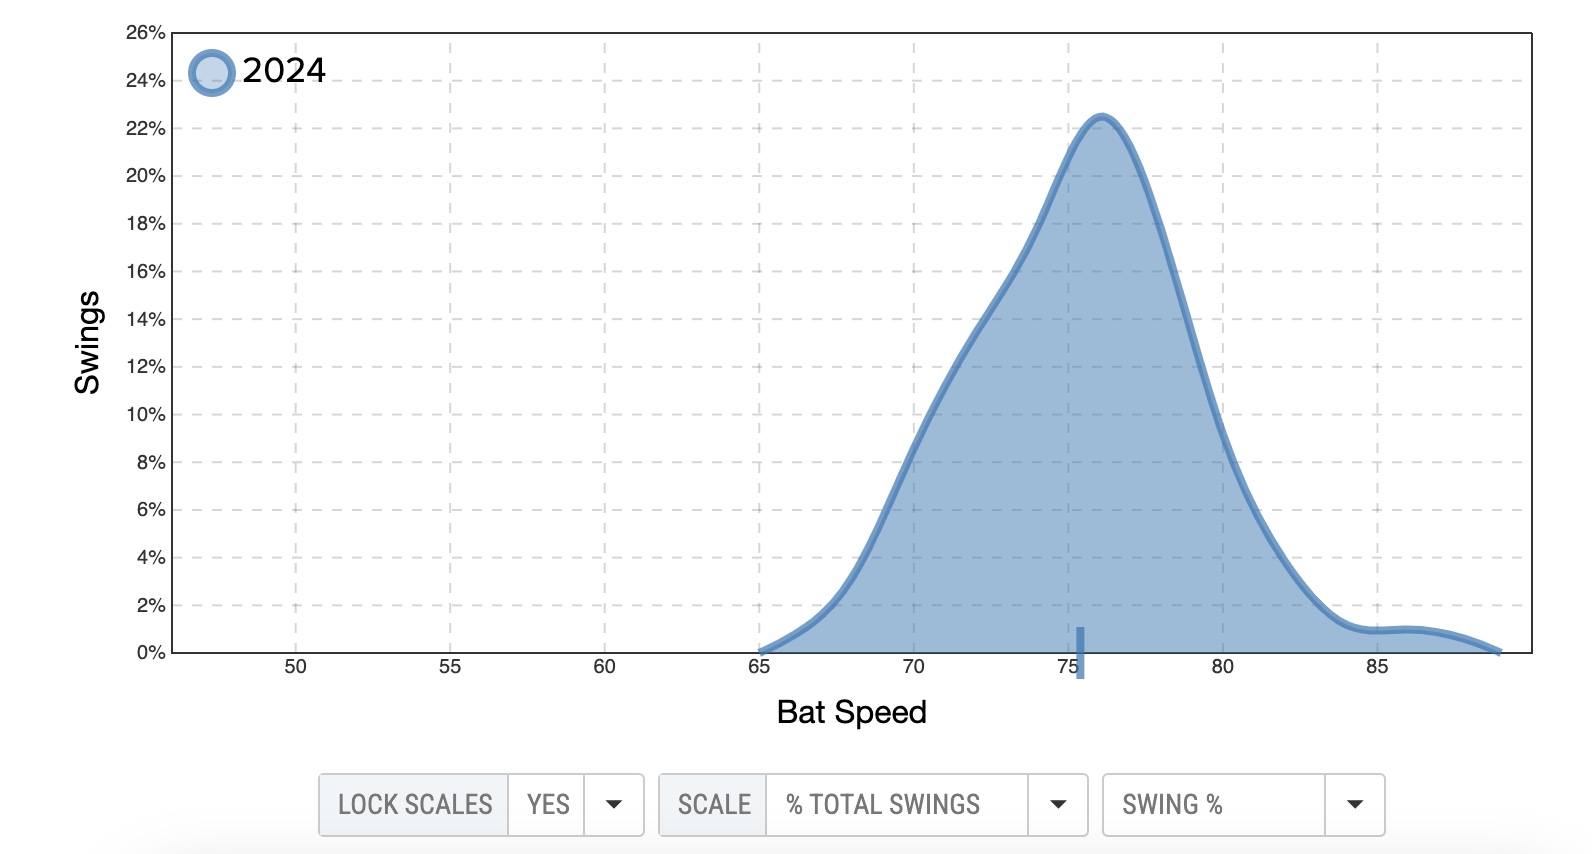
The first graphic is Adell’s bat speed, the 2nd is Juan Soto’s, and the 3rd is Javier Báez’s. I’m just learning how to use these of course, but I’d think you’d want your bat speed graph to look more like Soto’s than Báez’s. All three have similar average bat speeds, but I suspect that if you were struggling making contact you’d want a more symmetrical graph, suggesting you take more controlled swings. Adell’s looks more like Báez’s.
Verdict: Legit. The bat speed stuff is so new I suspect I’m interpreting it incorrectly. Swinging Strike% stabilizes quickly and Adell has certainly improved in that area. I put more stock in that than my attempt at bat speed analysis. His Cent% and Opp% have both increased which suggests he is letting the ball travel more. His quality of contact metrics are all very good so the only question is if he can maintain his improved K%. Watch those metrics and you’ll get a good idea of what to expect from him.
Featured image by Doug Carlin (@bdougals on Twitter)


