


In 2019, Royals outfielder/designated hitter Jorge Soler set the world on fire from both a baseball and fantasy perspective. After struggling through injury and inconsistency in his first two seasons in Kansas City in 2017 and 2018, Soler broke out as one of the most productive hitters in the American League. He not only played in all 162 games, but also posted a 136 wRC+, 3.6 fWAR, and set a new Royals team single-season record for home runs at 48, which eclipsed the 38 home run mark set by Mike Moustakas in 2017. After years of failing to live up to expectations both as a Cub and Royal, Soler in 2019 showed that he was a “mashing machine” capable of hitting any pitch with authority, which was chronicled last season by Michael Ajeto here on Pitcher List.
Thus, Soler went into the 2020 shortened season with heightened expectations, as Royals fans and fantasy owners expected him to be one of the most productive designated hitters/outfielders in the American League for a second straight season. Unfortunately, Soler regressed, as his slash went from .265/.364/.569 in 679 plate appearances in 2019 to .228/.326/.443 in 174 plate appearances in 2020. Furthermore, his ISO dropped from .304 to .215 from 2019 to 2020, respectively, and he also saw a regression in wRC+ as well, as it went down to 108, which was actually lower than his 123 wRC+ in 61 games in 2018 (which was cut short due to a broken toe which abbreviated his season).
While Soler was affected by a nagging oblique injury throughout the 2020 season, many baseball fans and fantasy are owners are wondering this: is “Soler Power” worth re-investing in for 2021, and will the soon-to-be 29-year-old Cuban slugger find the “charge” again that made him one of the most feared hitters in the American League, and maybe all of baseball, in 2019?
Let’s take a look at why Soler struggled in 2020, and why there could be some hope on the horizon for him next year for both Royals fans as well fantasy owners.
Soler Against Breaking and Offspeed Pitches
Soler is an incredible athlete with tremendous strength, and he demonstrated that in 2019, smashing the Royals home run record while playing primarily in a home stadium (Kauffman Stadium) that is known for suppressing power. Prior to Moustakas setting the home run record in 2017, Steve Balboni set Royals’ single-season home run record with 36 in 1985, and that record stood for 32 years.
While some regression was to be expected from Soler in 2020, the kind of drop he experienced was a bit shocking. Soler has always struggled with strikeouts, as his career strikeout rate is 28.1 percent. However, his strikeout rate rose to 34.5 percent in 2020, and his overall whiff rate also rose to 37.2 percent, which ranked him in the bottom 4th and 5th percentiles in those categories, respectively, according to Baseball Savant.
Soler’s struggles to make contact against breaking and offspeed pitches in 2020 stood out the most from his 2019 metrics, as evidenced by the table below:
| Year | Breaking | Offspeed |
|---|---|---|
| 2019 | 45.2 | 39.3 |
| 2020 | 54.5 | 52.8 |
As one can see, his whiff rate against breaking balls rose 9.3 percent and his whiffs against offspeed pitches rose 13.5 percent. Considering that Soler was able to neutralize things a bit at the plate in terms of whiff rate against non-fastballs in 2019, to see this kind of regression was a bit disappointing and could be a key development to pay attention to in 2021. If Soler continues to carry these whiff issues against secondary pitches into 2021, it is possible that Soler and his particularly high strikeout rate from last year, even for his standards, may transition into next season, which will only deflate his value.
One interesting outlier about Soler’s metrics though is that while the whiff rates against secondary pitches are particularly glaring, the BBE data isn’t all that bad. Here is his xwOBA (expected weighted on-base average) data against breaking and offspeed pitches the past three seasons:
| Year | Breaking | Offspeed |
|---|---|---|
| 2018 | 0.274 | 0.331 |
| 2019 | 0.299 | 0.382 |
| 2020 | 0.336 | 0.369 |
The xwOBA paints a bit of a different picture than his whiff rate data. While he did regress in xwOBA on offspeed pitches from 2019 to 2020, it was only 13 percent, and it was actually 38 points higher than his 2018 numbers against offspeed stuff. As for breaking pitches? He was actually better on an xwOBA basis, as he was 37 points better in 2020 than in 2018 in regard to xwOBA. Thus, one has to wonder if Soler was perhaps a little unlucky in 2020.
If he does stabilize his whiff issues against these two pitches next season, it is possible, based on this xwOBA data, that he could perhaps bounce back and produce overall numbers that are in line with what he did in 2019.
Fastballs, Injury, and Inside Zones
So, while the whiff rates against secondary pitches last season weren’t comforting, xwOBA data does perhaps suggest that maybe a bounce back is in store for Soler against those pitches in 2021. However, his issues against breaking and offspeed pitches weren’t the only issues that plagued him at the plate last season. In fact, it was his regression against fastballs in 2020 that was further concerning, and perhaps partially explained his dive in power and production from 2019 to 2020.
Let’s take a look at his xwOBA and xSLG (expected slugging) marks against fastballs from 2018-2020:
| Year | FB xwOBA | FB xSLG |
|---|---|---|
| 2018 | 0.417 | 0.570 |
| 2019 | 0.475 | 0.761 |
| 2020 | 0.342 | 0.500 |
On an xwOBA basis, the drop from 2019 to 2020 is remarkable, and the fact that it was also 75 points lower than 2018 also sticks out as well. That being said, while he did have a 261 point drop in xSLG on the fastball from 2019 to 2020, it wasn’t as dramatic from 2018 to 2020, comparatively speaking (only a 70 point drop).
I thought that xSLG difference was interesting, so I decided to take a look at Soler’s launch angle and exit velocity data over the past three years to see if that could explain his contrasting xwOBA and xSLG differences in 2018.
| Year | LA | EV |
|---|---|---|
| 2018 | 14 | 92.0 |
| 2019 | 16 | 95.8 |
| 2020 | 18 | 91.9 |
What’s interesting is how Soler’s average launch angle has increased by two degrees each year and is even higher than his 2019 record-setting season. Furthermore, the difference isn’t much in exit velocity from 2018 to 2020, but the launch angle is definitely much more pronounced. It definitely is a sign that Soler is looking to go yard consistently when he is at the plate, and these metrics could explain a little why his xSLG was not as dramatically different from 2018, unlike the xwOBA. In addition, these metrics show that Soler’s power is perhaps a stable commodity, and that is even further confirmed by his barrel rate, which, at 18.9 percent last year, ranked in the top one percent of the league.
That being said, while launch angle, exit velocity, and barrel rate data look promising from 2020, the decline in production against fastballs overall from 2020 still was puzzling, especially considering his prowess against the pitch in the past. However, this is where Soler’s oblique injury comes into play, and could explain his decline against the pitch in 2020.
On September 8th, Soler was put on the IL due to an oblique strain. However, according to the Athletic Royals beat writer Alec Lewis, this injury affected him for weeks prior to his IL stint, as evidenced by the Tweet below:
Royals GM Dayton Moore said on @610SportsKC with Ryan Lefebvre that Jorge Soler has been battling this right oblique injury for three weeks. Also said that Salvador Perez is soon going to be participating at the alternate site.
— Alec Lewis (@alec_lewis) September 6, 2020
Oblique injuries can be particularly troublesome injuries for power hitters like Soler, who swings violently to generate home run power. Thus, I was curious to see what “zones” for Soler would be affected the most by such an injury. My initial inkling was that inside zones would be affected the most, for his injuries in the oblique region could affect him generating the torque and bat speed needed to get around on inside pitches, fastballs especially.
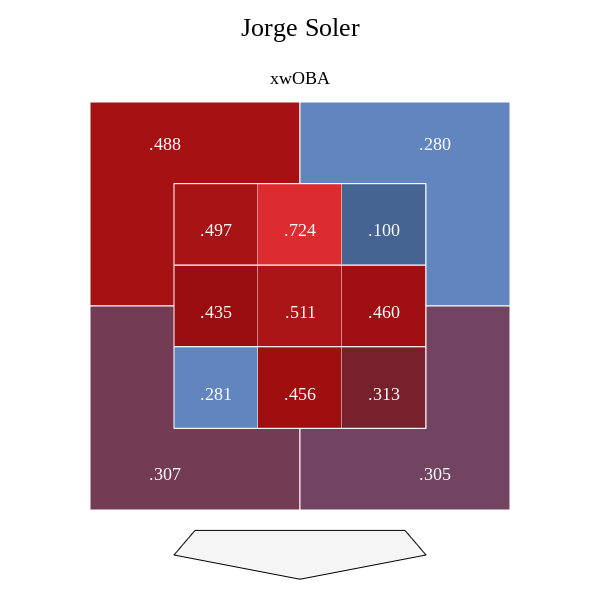
Here is a zone chart of his xWOBA data from 2019:
And now, let’s take a look at that same xwOBA chart, but from 2020:
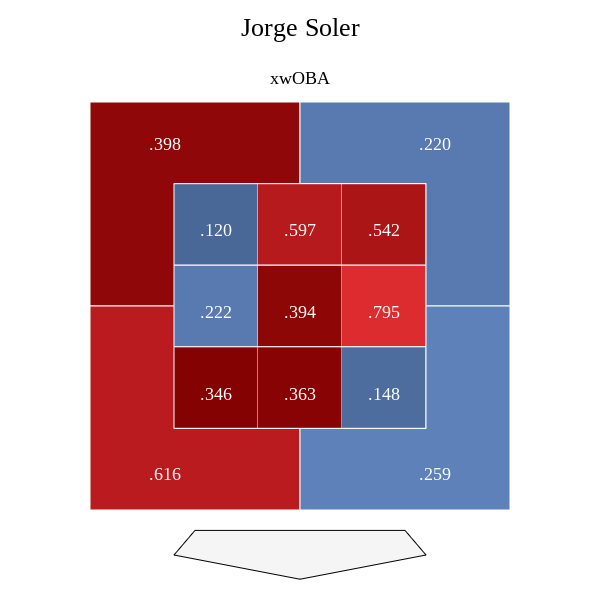
Notice the difference in xwOBA in zones 1 and 4. There is a 377 point difference in zone one from 2019 to 2020, and a 213 point difference in zone four. That is a SUBSTANTIAL difference, and he may have been struggling to get around those pitches because he was swinging in pain.
Thus, I found two pitches in zone four: one from 2019 and one from 2020. Let’s take a look at what he did against Chicago White Sox ace Lucas Giolito on a fastball in zone four in 2019:
https://gfycat.com/tintedcreepyjavalina
(Holy crap, let me pick my jaw up from off the floor for a second.)
And here is a pitch in the same zone from 2020, only this time against Cubs pitcher Yu Darvish and against a cutter that is slower than Giolito’s fastball two seasons ago:
https://gfycat.com/aptincrediblebooby
Granted, there’s a little more movement and spin on Darvish’s offering in comparison to Giolito’s. That being said, it’s in the same zone, and on a 2-1 count, it’s certainly a pitch that Soler could put some power behind. And yet, not only does he fail to turn on it, but he also pops out meagerly in foul territory on the first base side.
Also, here’s a side by side image of both Soler at the contact point with both pitches:
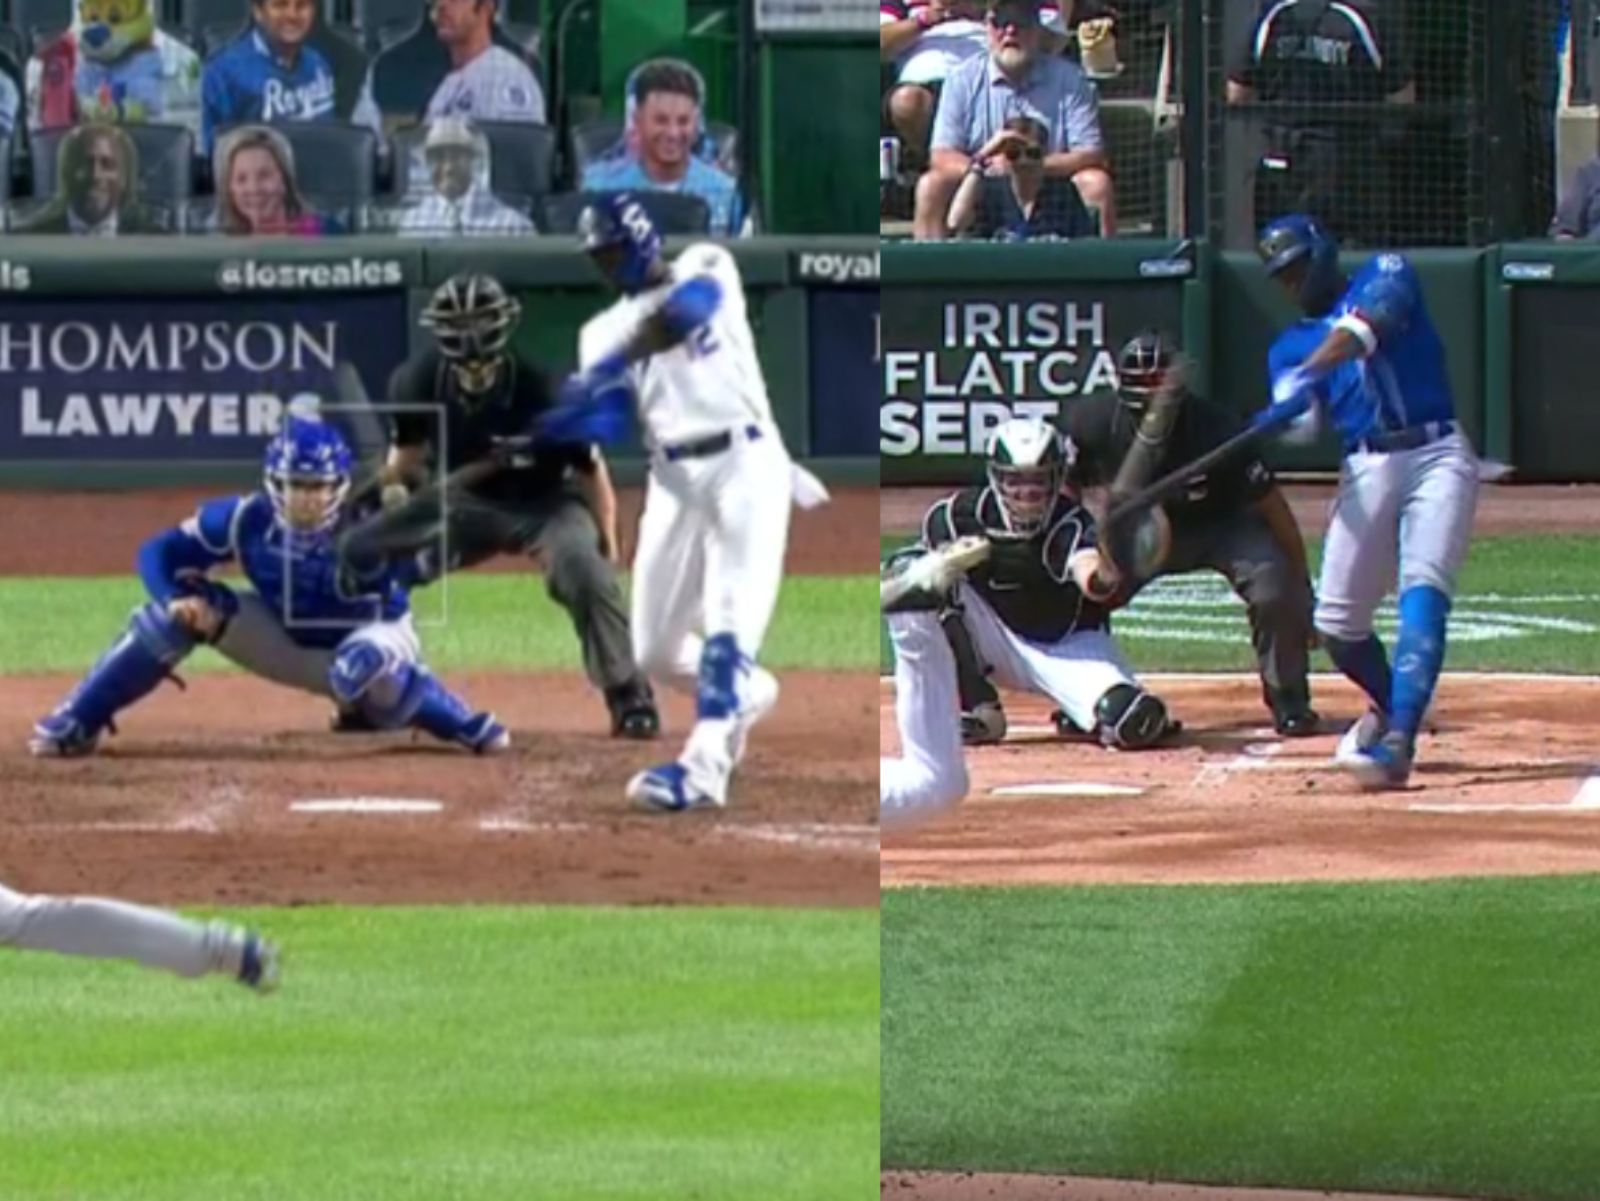
As you can see from the juxtaposing images, Soler is getting his hips around quicker on the right, which allows him to destroy the ball for a moonshot home run. On the left, his hips aren’t coming around as quickly, as his barrel is catching the ball deeper in the zone, which in turn results in an easy pop-up to the opposite field. While it could be him recognizing the pitch later, his lack of ability to generate more speed on his swing and hips due to the oblique injury most likely may be the difference from his 2019 swing on a pitch in zone four to his 2020 one on a pitch in the same area.
Where Does Soler Rank Among AL Central DHs?
With the help of Fantasy Pros and Roster Resource’s Depth Chart projections for 2021, I categorized Soler among all other “projected” designated hitters in the American League Central. Here is how projected AL Central DHs rank in terms of ADP:
| Name | ADP |
|---|---|
| Eloy Jimenez | 41 |
| Nelson Cruz | 78 |
| Franmil Reyes | 141 |
| Jorge Soler | 150 |
| Miguel Cabrera | 342 |
As one can see, Soler ranks only ahead of Miguel Cabrera in this list of designated hitters from the AL Central in terms of average draft position. Granted, Eloy Jimenez may be an unfair comparison in this list, but Nelson Cruz and Franmil Reyes could all be seen as comparable designated hitter options to Soler. However, while people may prefer Cruz and Reyes when looking at the data among these hitters more deeply, Soler actually fares more favorably than expected, especially in regard to plate discipline and batted ball data.
Here’s a list of plate discipline metrics that compares the five AL Central DH candidates:
| Name | O-Swing% | Z-Swing% | Swing% | O-Contact% | Z-Contact% | Contact% | SwStr% |
|---|---|---|---|---|---|---|---|
| Jorge Soler | 25.1% | 58.7% | 37.9% | 47.8% | 78.2% | 65.7% | 13.0% |
| Franmil Reyes | 31.1% | 69.7% | 46.0% | 48.7% | 74.7% | 63.9% | 16.6% |
| Miguel Cabrera | 32.3% | 72.8% | 47.6% | 50.0% | 85.3% | 70.4% | 14.1% |
| Nelson Cruz | 33.8% | 69.6% | 47.6% | 52.3% | 80.2% | 68.0% | 15.2% |
| Eloy Jimenez | 41.1% | 76.4% | 54.3% | 62.8% | 81.7% | 72.8% | 14.8% |
Of the five designated hitters, Soler is the most disciplined of the bunch. He has the lowest percentage of swings at pitches outside the strike zone, and he also sports the lowest swinging strike rate as well, according to Fangraphs data. Furthermore, while his contact rate overall and of pitches inside the strike zone are lower than Cabrera, Cruz, and Jimenez, they are actually higher than Reyes’ marks. This is particularly important for fantasy owners to pay attention to, especially since Reyes seems to have a more favorable average draft position than Soler in most formats.
Now, let’s take a look at how the five compared on batted ball data from 2020:
| Name | GB/FB | LD% | GB% | FB% | IFFB% | Hard% | HR/FB |
|---|---|---|---|---|---|---|---|
| Jorge Soler | 0.97 | 23.3% | 37.8% | 38.9% | 20.0% | 42.2% | 22.9% |
| Miguel Cabrera | 1.33 | 26.5% | 41.9% | 31.6% | 8.2% | 30.3% | 20.4% |
| Franmil Reyes | 1.51 | 16.3% | 50.3% | 33.3% | 10.2% | 36.7% | 18.4% |
| Eloy Jimenez | 1.82 | 19.6% | 51.9% | 28.5% | 11.1% | 44.3% | 31.1% |
| Nelson Cruz | 1.51 | 22.8% | 46.5% | 30.7% | 10.3% | 38.6% | 41.0% |
Once again, Soler looks even more impressive in this set of data. He not only is the best in terms of putting the ball in the air, but his hard-hit rate also ranked second to only Jimenez, who is over 100 spots ahead of Soler in terms of ADP. An interesting number to note is Soler’s infield fly ball rate (IFFB%) which is 20 percent, nearly double most of the other hitters on this list. However, IFFB% can be a bit wonky, and there’s probably some reason to believe that Soler’s oblique issues probably contributed to him hitting more infield fly balls than usual.
To compare, let’s look at the same chart categories, but with data from 2019.
| Name | GB/FB | LD% | GB% | FB% | IFFB% | Hard% | HR/FB |
|---|---|---|---|---|---|---|---|
| Jorge Soler | 0.95 | 19.5% | 39.3% | 41.2% | 8.8% | 46.7% | 28.1% |
| Eloy Jimenez | 1.41 | 18.2% | 47.9% | 33.9% | 7.9% | 37.8% | 27.2% |
| Nelson Cruz | 0.98 | 20.2% | 39.6% | 40.2% | 7.6% | 52.5% | 31.3% |
| Franmil Reyes | 1.28 | 21.2% | 44.2% | 34.5% | 10.3% | 46.9% | 25.6% |
| Miguel Cabrera | 1.38 | 24.4% | 43.8% | 31.8% | 8.1% | 44.1% | 9.7% |
Notice how Soler’s IFFB% is significantly down from 2020 (11.2 percent lower to be frank), and consequently, Soler’s HR/FB rate is the second-best percentage of the five (behind only Cruz). What’s even more comforting is that Soler’s GB/FB ratio from 2019 and 2020 is around the same, while some other hitters such as Cruz, Jimenez, and Reyes have more dramatic increases in rates from 2019 to 2020. Hitting the ball on the ground is not ideal for power hitters, and Soler has proven that he is adept at keeping the ball in the air the past two years.
It’s difficult to say whether or not Soler will be the “Soler Power” force again in 2021. However, 2020 is a limited sample size, and the fact that Soler was playing hurt through most of it should give hope that Soler is due for a bounce-back in 2021. If he is fully healthy and turning on balls pitched inside in 2021, much like he was in 2019, it’s more than possible that he can produce numbers that could hover around his 2019 metrics. A lot of skill-based data sets from 2020 demonstrate that he was better than his 2020 traditional numbers project, and he may be a better option than some other designated hitter alternatives lurking in the AL Central.
It may have been a rough year for Royals fans and fantasy owners who were banking on “Soler Power” to continue produce top-level power in 2020.
That being said, “Soler Power” is still worth investing in, and he could end up being one of the best designated-hitter producers from the AL Central in 2021 if his oblique issues are behind him.
Of course, considering Soler’s injury history, that is a big “if.”
Photo by Gerry Angus/Icon Sportswire | Adapted by Doug Carlin (@Bdougals on Twitter)
