


If not for the existence of Paul Skenes, Padres outfielder Jackson Merrill would be the proud owner of a Rookie of the Year award. Merrill’s 2024 rookie season, in which he slashed .292/.326/.500 (.352 wOBA) with 24 homers and 90 runs batted in, and provided strong center field defense, was about as impressive as it gets. It was all the more remarkable when we factor in that Merrill jumped straight from AA to San Diego’s opening day roster without a hitch and did so while making a position change from shortstop to centerfield.
Jackson Merrill has earned this.#ROY x #MerrillMadness pic.twitter.com/n8BgPSpbk7
— San Diego Padres (@Padres) November 12, 2024
If you wanted to quibble with Merrill’s work at the dish, you could point to his 4.9% walk rate (8th percentile) as a point of developmental emphasis going forward. Despite hitting for the 12th-highest average among qualified hitters, the swing-happy Merrill ranked just 61st in on-base percentage.
The Friars rewarded Merrill’s heady debut with an early extension at the start of this season that will keep him in Southern California at least through the 2034 season and guarantee him at least $135 million (and potentially much more through incentives and an option).
The first half of Merrill’s second season has been a different story. It’s not that he’s been bad, in an objective sense, but he hasn’t been the same type of offensive force that we saw last year. When we reached the All-Star break last week, Merrill was running a .263/.328/.416 slash line over 272 plate appearances this season.
Those slash marks worked out to a .324 wOBA, about 30 points below last season. The irony in those decreased numbers is that they’ve come despite Merrill nearly doubling his walk rate to a near-league-average 8.5%. But his batting average is down about 30 points, and his slugging percentage is down about 85 points.
Let’s try to figure out what’s going on.
It’s a Game of Adjustments
An obvious place to begin our investigation is in how opposing pitchers have adjusted their approach to Merrill. It doesn’t take long for scouting reports about a hitter’s strengths and weaknesses to get around the league.
In terms of pitch mix, opponents are giving Merrill the same diet of pitch types that they did last season. In both seasons, he’s seen fastballs about 57% of the time, breaking pitches 28-29%, and off-speed pitches about 15%.
While the mix of pitch types isn’t changed, it’s clear that opponents have sharpened the locations of their attacks on Merrill.
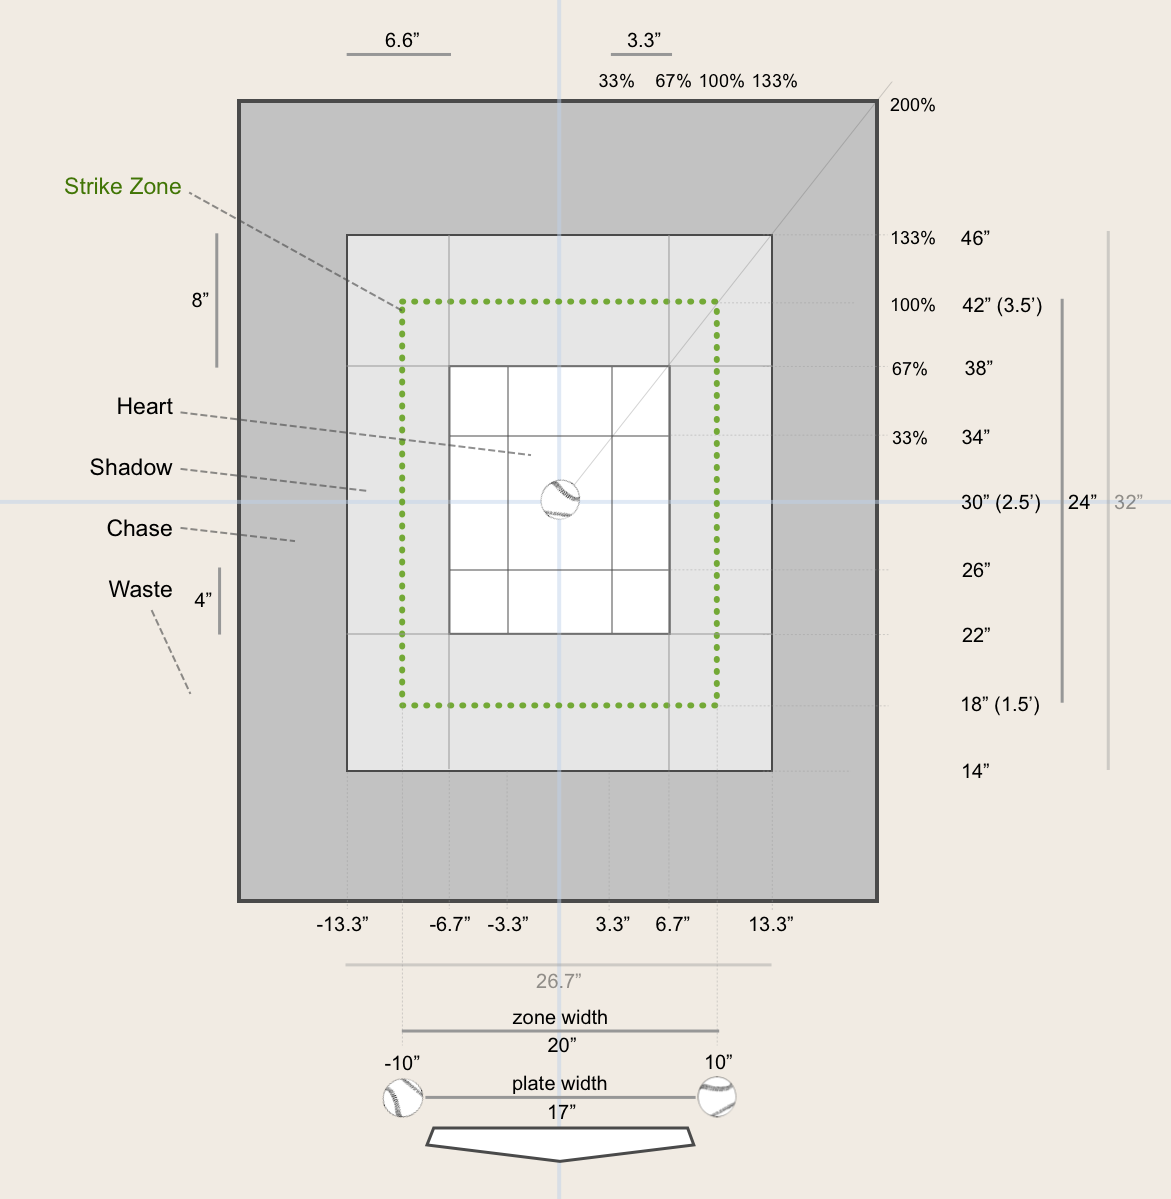
They are working him much more carefully around the edges of the strike zone this season (i.e., the Statcast “shadow” zone). The share of pitches Merrill has seen that are located on the edges of the plate has jumped from 41.9% last season to 46.6% this season. That has also meant he’s seen fewer pitches in the heart of the plate (27.5% last season, 23.9% this season).
That opposing pitchers would try to be more fine in working Merrill coming off his big rookie season isn’t surprising. It’s also logical to try to make a hitter whose profile is carried by his ability (and willingness) to make contact lay off pitchers’ pitches.
We can also see that dynamic play out with our pitch hittability metric fueled by PLV:
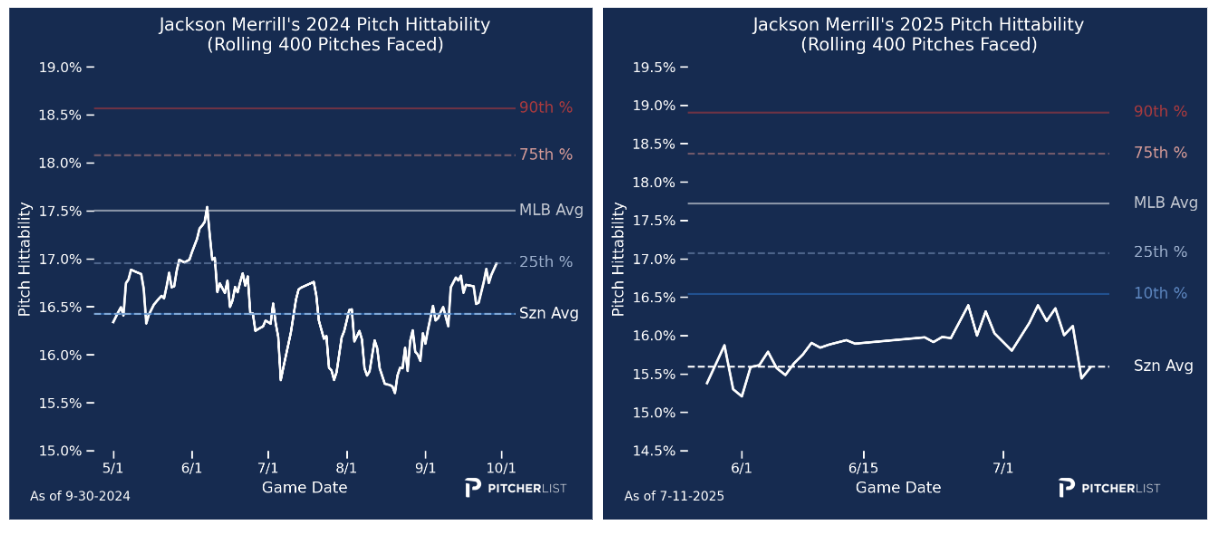
The Y-axis labels don’t align perfectly in this side-by-side. We can still see that Merrill has faced fewer hittable pitches this season than last, and his rate of hittable pitches seen is one of the lowest in baseball.
More granularly, opposing pitchers have pitched Merrill up in and above the strike zone more this season. Many of those have been out away from him. Just more than a third (34.2%) of the pitches he’s seen this season have been elevated (up from 27.8% last year), and 45.2% have been located outside (up from 42.1%).
The logic of that shift is rooted in the numbers. While Merrill has been lauded for his ability to cover the entirety of the strike zone productively, the upper third was his least productive area last season:
Merrill was productive in each area, but he hit for less power and swung and missed more often against those elevated pitches than he did against pitches lower in the zone last season. Opposing pitchers have surely picked up on that pattern and have sought to exploit that comparative weakness in year two.
Merrill’s Approach
While opponents have worked Merrill more carefully, they have continued to throw Merrill pitches in the strike zone at a similar rate to last season. Merrill has continued to swing aggressively. He’s swung at around 57% of all the pitches he sees, and at around 45% of first pitches, which are both well above the league averages of ~47% swings against all pitches and ~30% swings on first pitches.
Despite that seemingly consistent approach, Merrill has swung and missed, and chased pitches out of the zone more often this season.
The source of Merrill’s increase in whiffs and decrease in zone contact appears to be those pitches on the edges of the plate. He’s whiffed a touch more often on pitches in the heart of the plate (13.9%, up from 12.5% last season), but he’s come up empty on more than 27% of his swings on shadow pitches. That’s about 8 points above what he did against those pitches last season and has fueled a 4.5 point increase in his strikeout rate to 21.4%.
Unsurprisingly, given that pitchers are working tougher and he’s still swinging as often as before, Merrill’s swing decision value (i.e., the modeled per pitch value of his decisions to swing or take a pitch, indexed to 100 as league average) has dropped from 85 to 79.
Batted Ball Profile
Not only has Merrill struggled more in discerning which pitches to go after and which to lay off, but he’s also had trouble hitting them the way he wants when he does make contact. His overall average exit velocity is down about 1.5 mph from last season, and his average exit velocity on fly balls has decreased from 91.4 to 90.6.
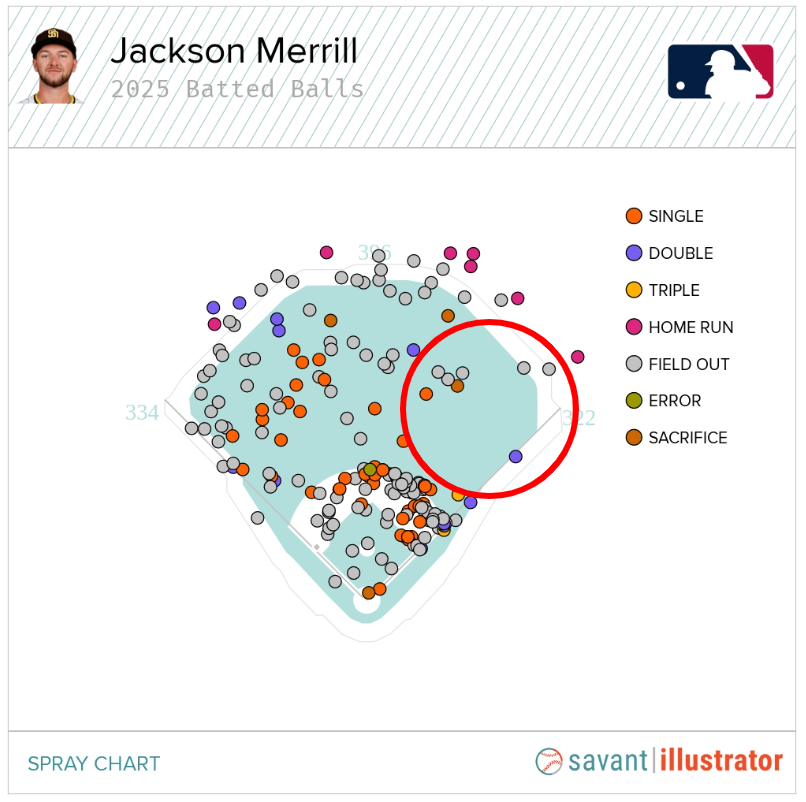
As we might expect to see given his opponent’s emphasis on working him up and away, and Merrill’s skill as a hitter, he’s hit more fly balls to his opposite field this season (from 21.6% to 26.7%). We know launch angle is strongly correlated to pitch height, and Merrill is inclined to hit the ball where it’s pitched. An issue with that, though, is that Merrill has not been nearly as productive in the air to the opposite field as he was last year. His slugging percentage on opposite field fly balls is just .308, and his isolated power is only .154, both down around 90 points from last season. The average distance of his opposite field fly balls is 11 feet shorter than last season.
It’s clear he’s trying to adjust to how pitchers are working him, but he’s not been able to execute the adjustment as well as he probably wants.
Perhaps unexpected then is that Merrill’s ground ball rate has also shot up — from 36.8% last season to 43.5% this season. That’s been especially true to his pull side (16.9% to 23.0%), where Merrill has beaten ground balls into the teeth of shaded infields all season. He’s managed to be productive on those ground balls (.335 wOBA), but it’s not the profile he or the Padres probably want him to have.
Taken together, the increased fly balls the opposite way and the increased pulled grounders have meant a dearth of pulled air balls (the most productive batted ball combination) this season. Merrill is not a big pulled airball hitter to begin with, but only 11% of his batted balls have been pulled in the air, down from 15.4% last season.
Occam’s Razor
With all the public data we have at our disposal, it’s often easy to weave complicated narratives to explain what a player is doing. It’s worth remembering Occam’s Razor — that the simplest explanation is often the correct one.
In Merrill’s case, I think all these signs point to a hitter who is struggling with timing as the league’s pitchers have changed their strategies. More importantly, his challenge in adjusting back this season has been disrupted twice by injury. First, a hamstring strain in April forced him to miss almost a month of play. Then a concussion in June cost him another week and preceded a deep slump heading into the All-Star break.
The simplest explanation for Merrill’s sophomore struggles is that the injuries have prevented him from finding a rhythm and his timing. His batted ball data, when broken down by pitch type (which are extremely small sample sizes, I know), also tells that story:
| 2024 | FB | LD | GB | PU |
|---|---|---|---|---|
| Fastball | 34.9% | 25.6% | 34.9% | 4.7% |
| Breaking | 34.1% | 28.9% | 33.3% | 3.7% |
| Offspeed | 25.0% | 20.6% | 51.5% | 2.9% |
| 2025 | FB | LD | GB | PU |
| Fastball | 30.8% | 23.1% | 38.5% | 7.7% |
| Breaking | 35.4% | 23.1% | 40.0% | 1.5% |
| Offspeed | 10.0% | 20.0% | 66.7% | 3.3% |
Notice how he’s hit more popups against fastballs this season. Then observe how he’s hit breaking and off-speed pitches on the ground significantly more often than last season.
That looks like a hitter who is not on time. Perhaps he’s a bit stuck between fastballs and secondaries. Late on the fastball, you hit popups and lazy fly balls to the opposite field. Early on the secondaries, you’re likely to hit them into the ground to your pull side. That explains Merrill’s most common batted balls this season.
I’m not a swing mechanics expert, but I wonder if that seeming lack of comfort at the plate is driving Merrill to move around within the box:
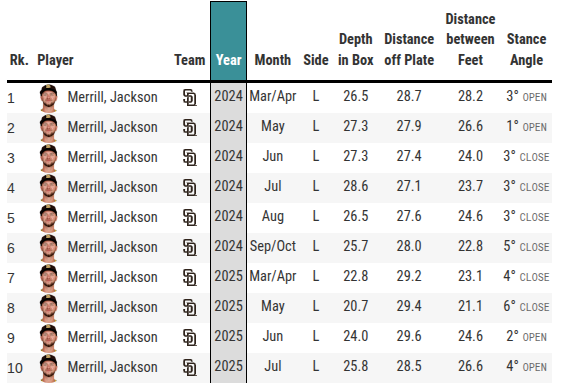
Early this season, he was significantly further up in the box and farther away from the plate than he was last season. So far in July, he’s set up deeper and closer to the dish, more like he was last year.
Only time will tell if he finds his groove again, but given better health and consistent at-bats, I’ll bet he will find his timing and start using opposing pitchers’ plans against them.
Photo courtesy of Icon Sportswire | Adapted by Aaron Polcare (@abeardoesart on Bluesky and X)
