One of the first things I do when I’ve missed a great outing from a pitcher is take a look at their strike zone plot from that game. This way I can begin to piece together what it is they did to have success in that given start. Recently, one of these strike zone plots really stuck out to me.
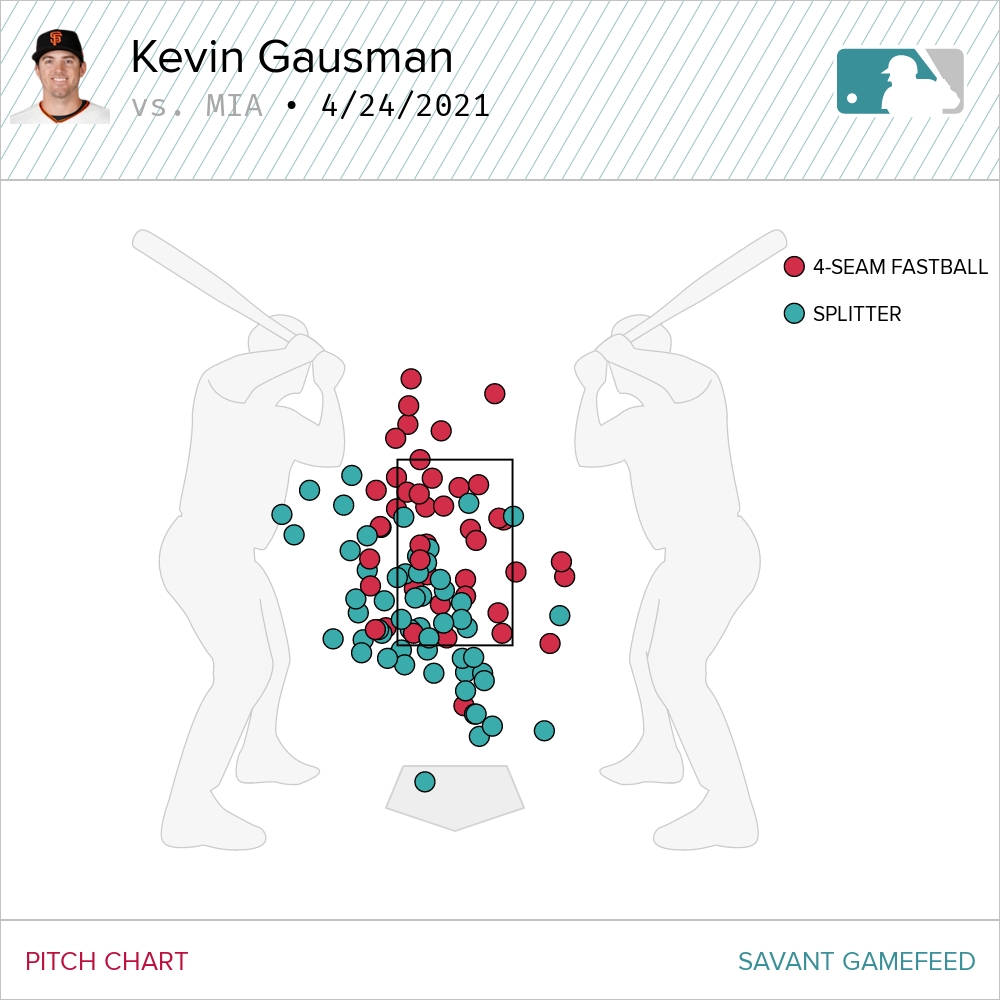
This is Kevin Gausman’s strike zone plot from his outing against the Miami Marlins this past Saturday, April 24th. His final line was 8 IP, 1 ER, 2 H, 1 BB and 11 K and he threw two pitch types.
A splitter. A heater. 11 K’s over 8 IP. What?!
On the surface it looks like Gausman had success by fooling hitters over the heart of the plate with his heater and hitting the edges more consistently with his splitter. In his first five starts, he seems to have used this formula to prove that the success he had in 2020 wasn’t a fluke.
Let’s take a deeper look into why.
The Story so Far
| Metric | 2021 | Rank | 2020 | Rank |
|---|---|---|---|---|
| ERA | 2.14 | 15th | 3.62 | 39th |
| FIP | 3.12 | 28th | 3.09 | 16th |
| SIERA | 3.74 | 35th | 3.24 | 12th |
| WHIP | .86 | 11th | 1.11 | 25th |
| SwSt | 14.2% | 14th | 15.2% | 7th |
| K% | 26.2% | 28th | 32.2% | 11th |
| BB% | 7.7% | 43rd | 6.5% | 27th |
| BABIP | .193 | N/A | .296 | N/A |
After a contextually impressive ’20 campaign – I don’t think many saw a sub-4 ERA coming after 2018 – featuring some improved fastball velocity and an increase in change-up usage, Gausman has hit the ground running through his first five starts. While the K% has expectedly regressed a bit, the Giants RHP’s SwSt has largely maintained, and though his WHIP is likely BABIP-fueled (his career average currently hovers around .310; league ranks were purposefully excluded as I felt inclusion would misrepresent proper BABIP utilization) his FIP and SIERA point towards some sustainability from 2020’s performance.
We can also see that there have been some notable changes so far with his pitch mix.
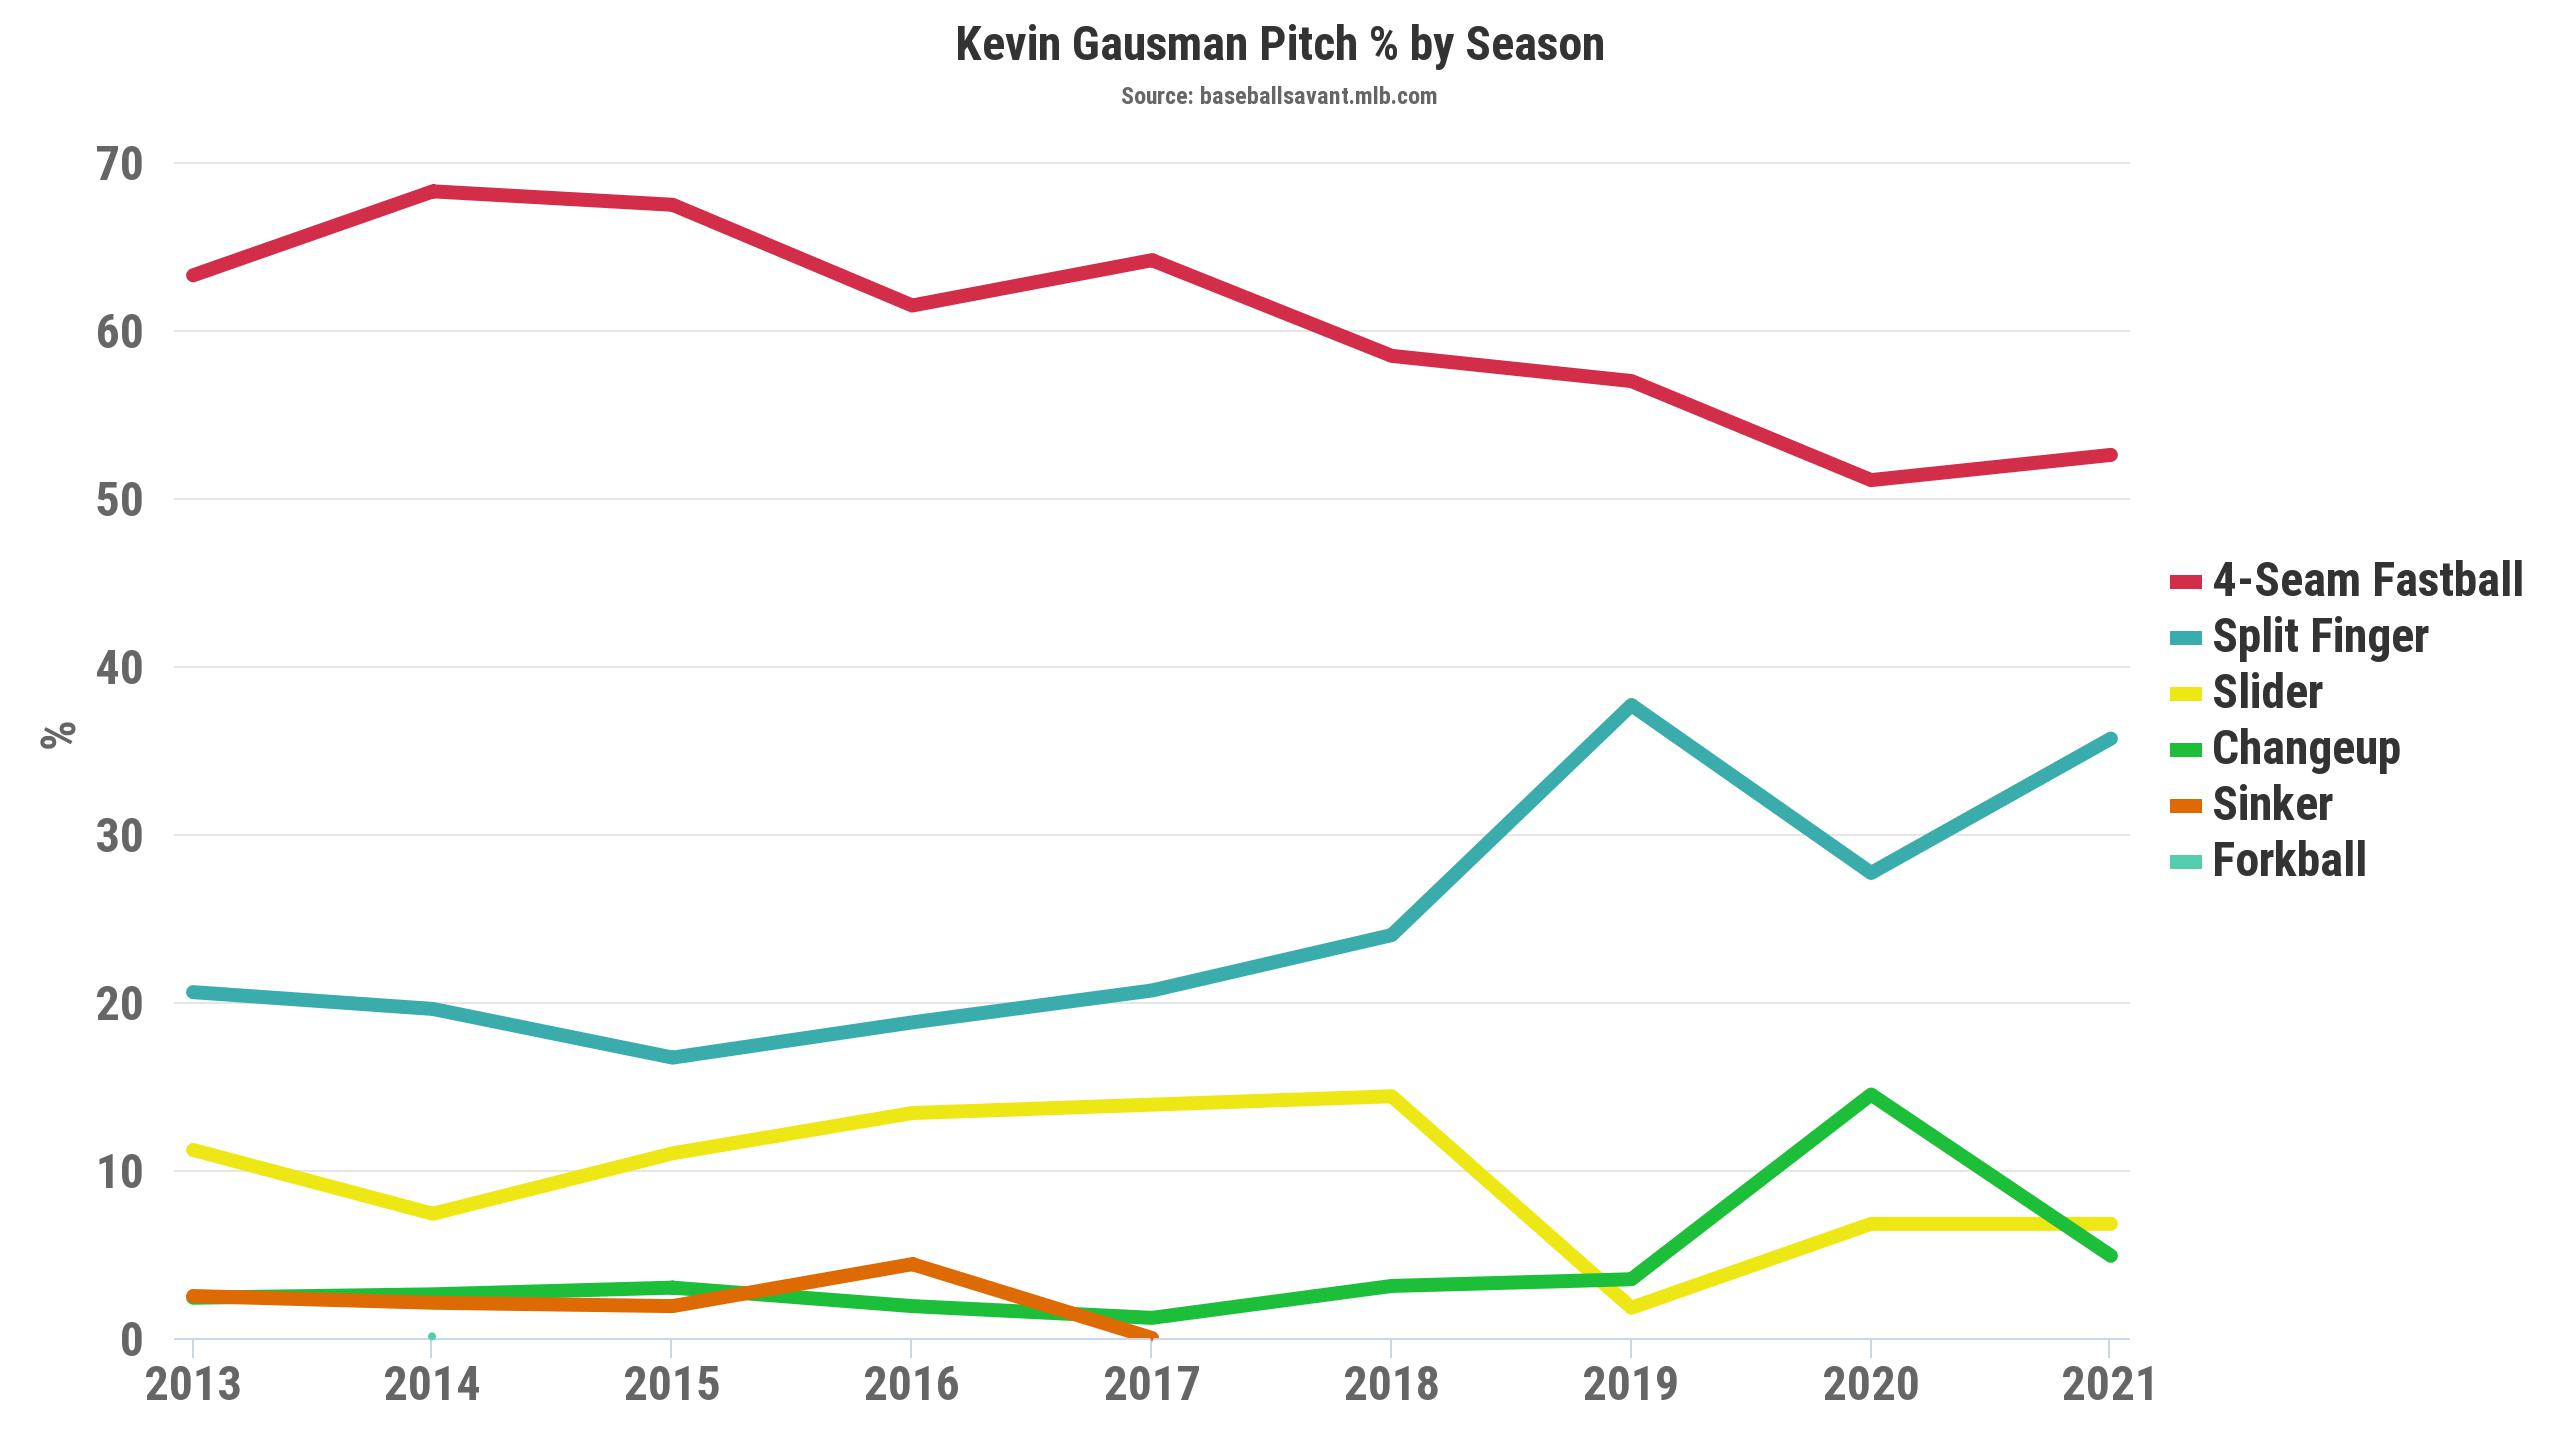
Gausman has reverted his changeup usage a bit, focusing primarily on left-handed hitters with the pitch (though that could be due to what is an incredibly small sample size). The slider remains a pitch he predominantly attacks right-handed hitters with and rarely at that. The void left by the few sliders and limited changeup usage has been filled in part by a four-seamer that is currently sitting slightly below 2020’s career-high velocity at 94.2 mph, and a splitter.
While this chart would lead you to believe that this is only the 2nd highest splitter (FS) utilization of his career, that’s only half true. After making 16 starts for the Braves in 2019, Gausman was moved to the Reds, where he primarily worked in relief. If we use the Baseball Savant search to look at Gausman’s splitter usage strictly when he started, we get a slightly different story:
| Season | FS Usage |
|---|---|
| 2021 | 35.7% |
| 2020 | 24.8% |
| 2019 | 29.1% |
| 2018 | 24% |
| 2017 | 20.6% |
| 2016 | 18.6% |
| 2015 | 14.5% |
| 2014 | 19.6% |
| 2013 | 9.8% |
Gausman is going to that splitter more than he has in his entire career. His 35.7% splitter usage is the 2nd highest in baseball behind Alex Cobb (who uses the pitch a wonderfully absurd 45% of the time). If we add the fastball to the mix, too, we can see that now, more so than ever before, Gausman is a two-pitch pitcher.
| Season | Pitch% |
|---|---|
| 2021 | 88.2% |
| 2014 | 87.9% |
| 2017 | 84.6% |
| 2018 | 82.5% |
| 2016 | 79.2% |
| 2019 | 74.8% |
| 2015 | 74.1% |
| 2020 | 72.7% |
| 2013 | 44.8% |
Gausman is also locating his splitter and four-seamer a bit differently.
| FS% | Season | FB% |
|---|---|---|
| 43.4% | 2021 | 51.8% |
| 30.7% | 2020 | 41.2% |
| 33.8% | 2019 | 36.9% |
| 39.3% | 2018 | 46.6% |
| 39% | 2017 | 44.5% |
| 38.6% | 2016 | 48.1% |
| 32.9% | 2015 | 38.5% |
| 35.6% | 2014 | 45.1% |
| 10.5% | 2013 | 21.4% |
| FS% | Season | FB% |
|---|---|---|
| 15% | 2021 | 32.2% |
| 8.1% | 2020 | 38% |
| 8.4% | 2019 | 24.5% |
| 9.1% | 2018 | 32.9% |
| 14.3% | 2017 | 30.1% |
| 4.3% | 2016 | 30% |
| 8.1% | 2015 | 28.1% |
| 7.3% | 2014 | 26.3% |
| 4.9% | 2013 | 18.8% |
There are a lot of numbers here so let’s break them down for a minute. Gausman is locating both his splitter and four-seamer in the Shadow zone at career-high levels. He’s putting the splitter in the shadows over 40% and the four-seamer in the shadows over 50% for the first time in his career. A career-high 15% of his splitters are in the Heart zone while 32.2% of his four-seamers are there too, a 6% drop from his 2020 total. Overall, 48.2% of Gausman’s pitches are located in the Shadow zone, which is the 6th highest total in baseball amongst SPs (min 300 pitches).
All of the charts and graphs we’ve seen so far have solely focused on what Gausman is throwing and where he’s throwing it. They speak nothing to the actual performances of those pitches. For that, we’ll take a look at their Run Value.
The Heart and Shadow
Every pitch in a game is assigned a value based on its outcome. Let’s say for a pitcher, a ball is given a +0.25 value, a strike is -0.35 and a hit is +1.0 (these particular values are made up). What Run Value (RV) does is accumulate all of the individual run values based on pitch results and outputs a single number. If a pitcher performed “well”, he will often have a negative RV. This may seem counterintuitive but a pitcher’s job is to keep runs off the board. The opposite is true for hitters; a higher RV is better.
Baseball Savant breaks down attack zones into four areas: Heart, Shadow, Chase, and Waste. If you take a look at the site’s Swing/Take leaderboard, you’ll notice that run values can be broken up by those four zones and, when added together and properly-rounded, will spit out an “All” field. You can look to see which pitcher has the highest “All” or overall RV, or you can look to see which pitcher has the best RV in the Heart, Shadow, Chase, or Waste zone.
(Before we take a look at that leaderboard, I want to do a quick aside based on what I thought were exciting findings. We’re going to veer away from Gausman temporarily to get a little nerdier. If that’s not your bag, go on and skip ahead to “We Now Resume Our Scheduled Broadcast”.)
A Brief Soliloquy
While looking into this leaderboard, I was very curious about what was more indicative of overall success for a starting pitcher. Do pitchers that have the most overall success via RV do so because they succeed over the heart of the plate or in the shadows? I took every pitcher’s RV between 2018-2021 (min 2000 pitches) and explored the relationship between Heart RV and Shadow RV to overall RV.
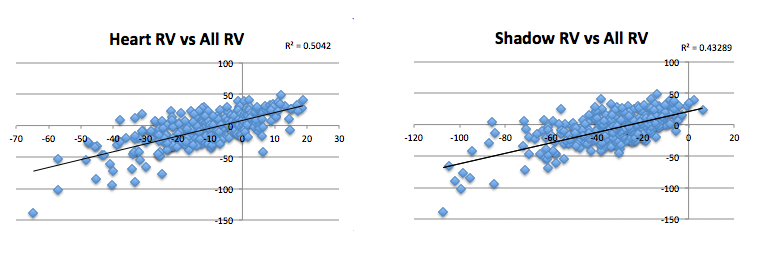
Much to my surprise, those who succeeded over the heart of the plate tended to have the most overall success. Intuitively, this makes sense. The Heart zone was designed so that you could rarely have the pitch result be a ball. Thus, possible outcomes over the heart of the plate include a called strike, swinging strike, foul, or a batted ball event. By removing what would be a positive run value for a pitcher in a ball, you’re creating a sort of un-level playing field. This may not be the most accurate way to answer my original question of which zone is more important to have success in, however.
Over the course of the season, far more pitches are going to be thrown in the Heart zone over the course of the year, so to get some more accurate findings, we need to look at RV on a per-pitch basis. The original formula was Heart RV / All RV and Shadow RV / All RV. Let’s see what would the results be if modified to Heart RV / total pitches thrown in Heart and Shadow RV / total pitches thrown in Shadow:

When we normalize for the number of pitches thrown, we see that pitchers who had the most success overall when it came to RVs did so because they succeeded in the Shadow zone. Thanks to Tom Tango, I realized there is yet another – and likely more accurate – way of approaching this. As mentioned, the All category is a summation of Heart RV + Shadow RV + Chase RV + Waste RV. It’s unfair to compare Heart RV to All RV because Heart RV is INCLUDED in the All RV. The better methodology would then be to compare two distinct data sets. So, let’s look at Heart RV to non-Heart RV and Shadow RV to non-Shadow RV:
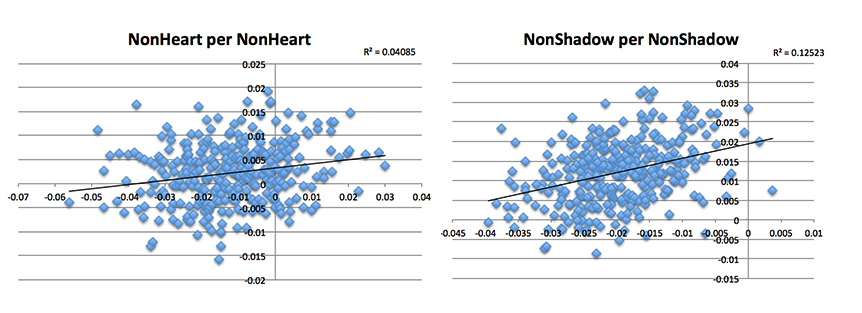
Once again, we see that pitchers who tend to have more overall success do so because they succeed in the Shadow zone. Yet, there’s another wrinkle. One that would only be solved with a baseball front office’s worth of data. Just like the Heart zone has its benefits in that it will never be impacted by a ball, the Shadow zone has its benefits in that it’s where most strikeouts are recorded.
Roughly 50% of strikeouts are recorded in the Shadow zone each year, with an additional ~25% occurring in the Chase zone, ~20% in the Heart, and the rest in the Waste zone. If you recall, a pitch is given a value based on its outcome, so pitches that result in strikeouts will reward RV more. Moreso, batters often don’t succeed as much in the Shadow zone in terms of wOBA, which raises the baseline further. Essentially, pitchers are almost given more opportunities to succeed in the Shadow zone than they are in the Heart, which could arguably make those who succeed in the Heart zone all the more impressive.
So do pitchers who have more overall success via RV do so because they succeed over in the Heart zone or Shadow zone? As I find with every baseball question I ask nowadays, there isn’t really a concrete answer. A pitcher that has success in the Heart zone isn’t inherently “better” than one that has success in the Shadow zone. The relationship between the two could be more interlocked than we realize, too; a lack of success over the Heart could theoretically lead to more success in the Shadow zone. As is seemingly true all the time, it’s better to look at this on a more case-by-case basis with the ever-important context of arsenal and all that encompasses.
Like we should get back to doing with Gausman.
We Now Resume Our Regularly Scheduled Broadcast

This is a screenshot of Baseball Savant’s Swing/Take leaderboard taken on April 27th. By RV standards, Gausman is one of the best pitchers in baseball. (Remember, Run Value is accumulative; deGrom having the 6th best RV with the 52nd most pitches thrown just reinforces his dominance). If we sort this RV list by Heart, we get a different picture:

According to Run Value, no pitcher in baseball is having more success over the heart of the plate than Gausman is right now. If we use the filters to group the run values by pitch type we can see how specifically he’s having his success.

Overall, by Run Value, Gausman is tied for the “best” fastball in baseball. Where is he having all of that success?

At my time of writing this, no pitcher is better over the heart of the plate with their fastball than Gausman. Sort of.
When we’re looking at the swing/take leaderboards, we’re looking at something that’s accumulative. If you checked out the soliloquy, you know that this may not be the best way to assess just how dominant Gausman’s four-seam has been in the Heart zone. It’s likely better to break this down on a per-pitch basis. After all, if Gausman has thrown the most Heart zone heaters, it would mean he’d have more of a chance to be atop that leaderboard.
To see if Gausman’s heater is as dominant as it seems, I divided each pitcher’s (min. 50 Heart zone four-seamers) Heart RV over total four-seamers in the Heart Zone to see how the pitch was performing on a per pitch basis. We’ll call this HrtRv/Total. Then I found the league average Heart RV per pitch by dividing the total Heart RV (-237.3) over total Heart zone heaters (10,560); we’ll call this LgAvgHeart. Lastly, I divided HrtRV/Total by LgAvgHeart (we’ll call this HrT/LgAvgHrt), used Excel’s handy percentile function, and was able to find the 6 heaters that were in the 90th percentile or higher.
| Player | HrT/LgAvgHrt |
|---|---|
| Brandon Woodruff | 5.34 |
| Trevor Williams | 4.38 |
| Kevin Gausman | 4.34 |
| Carlos Rodón | 4.20 |
| Michael Kopech | 4.20 |
| Aaron Nola | 4.05 |
That was a lot of acronyms and made-up formulas (though aren’t they all?) but the TL;DR is this: on a per pitch level, while Gausman’s Heart zone heaters don’t lead the league as the Swing/Take leaderboard would lead you to believe, the pitch is still a top-three fastball in the Heart Zone.
Fastball Breakdown
https://gfycat.com/educatedgrotesqueammonite
While Gausman isn’t attacking the Heart at career-high levels, he’s still doing it very frequently. 32% of his four-seamers are located in the Heart zone, which is currently 10th-most in baseball with a min of 200 FB thrown. While the above video is a great example of how Gausman has had success with the fastball alone – three consecutive heaters in the Heart zone, three consecutive whiffs – it’s slightly misleading as his success with the four-seamer in that location isn’t for the reason you would think.
| Metric | Rank | |
|---|---|---|
| CSW | 31.7% | 44th |
| SwSt | 8.5% | 43rd |
| wOBA | .029 | 2nd |
| xwOBA | .318 | 14th |
| wOBA-xwOBA | -.289 | 2nd |
(min 50 Heart Zone FB)
While Gausman hasn’t done a fantastic job getting whiffs in over the Heart with his four-seamer, he’s done a wonderful job of mitigating hard contact. While the discrepancies scream regression, I think there is some evidence that it may not be too severe.
Gausman’s four-seamer profiles a bit differently than it did last year. While the raw spin data largely maintained, there was a 1% uptick in spin efficiency, which has corresponded to Gausman getting a bit more carry on the pitch; specifically 1.2″ less drop.
He’s also added a bit more arm-side run and upped his vertical release point to the highest of his career. While both the vertical and adjusted vertical attack angle have gotten slightly steeper than what we saw in 2020, this could be explained by the slight uptick in vertical release point.
Overall, Gausman’s heater is returning the highest FlyBall% of his career at 53%; the highest launch angle of his career at 23°; and the most “poor/under” contact of his career at 36% (this metric from Baseball Savant looks specifically at poor contact as defined by hitters getting under the ball, a bit more context here).
Though Gausman’s average four-seam velocity is a tick down from what we saw in 2020, at 94.2 mph, it’s still among the 35 fastest four-seamers. All of these changes lead me to believe that Gausman is having success with in-zone fastballs because the slight uptick in rise and run is causing hitters to get under the ball, as Tom Murphy does on each…
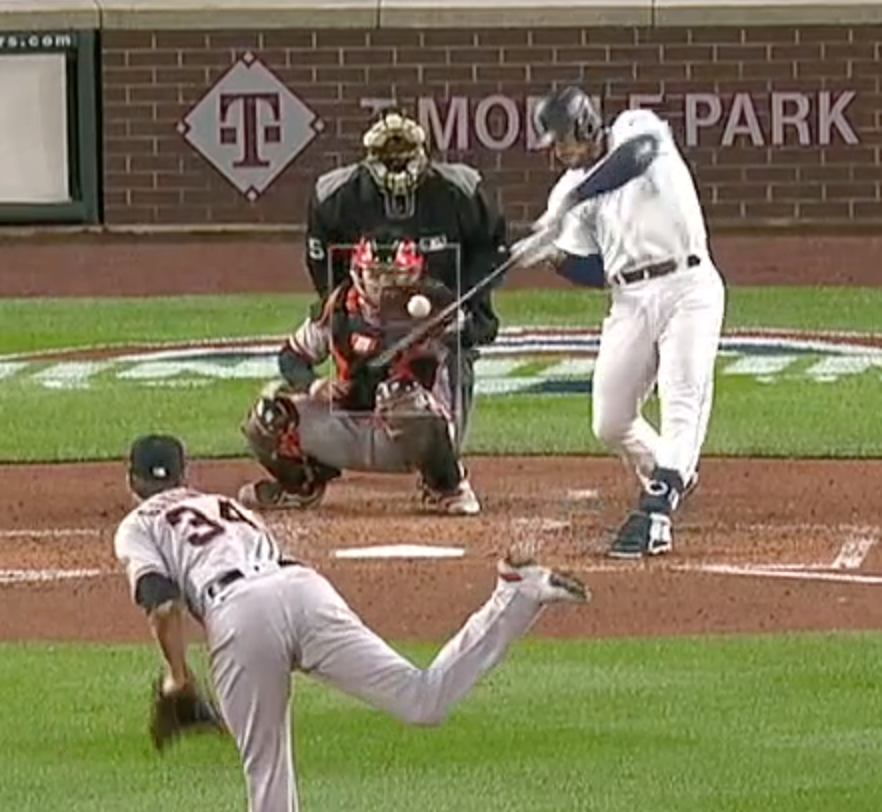
of Gausman’s…
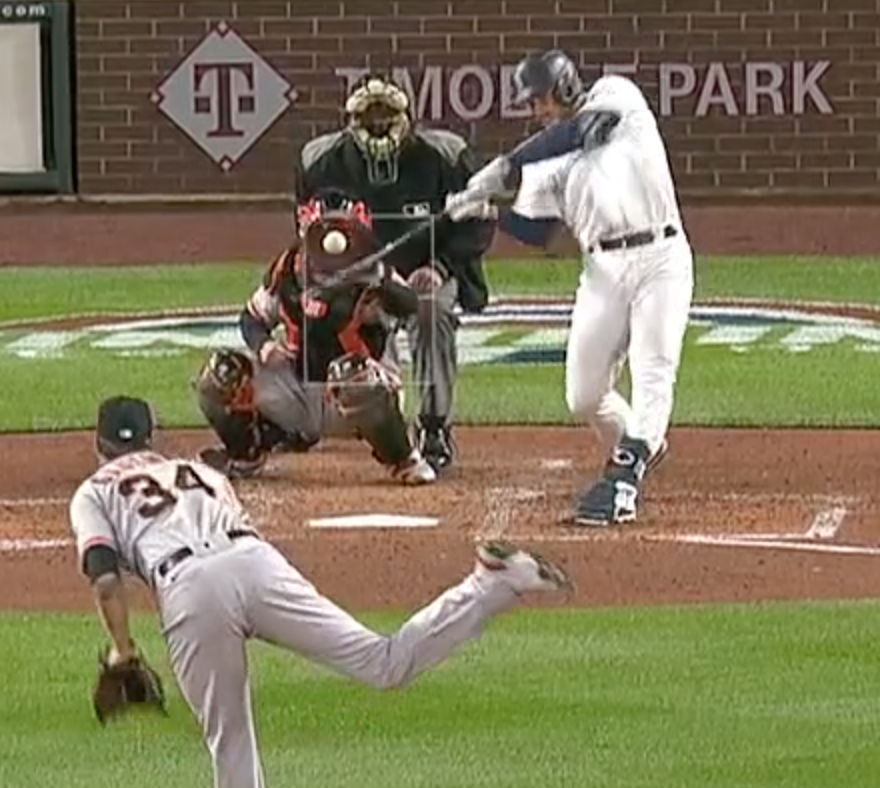
heaters.
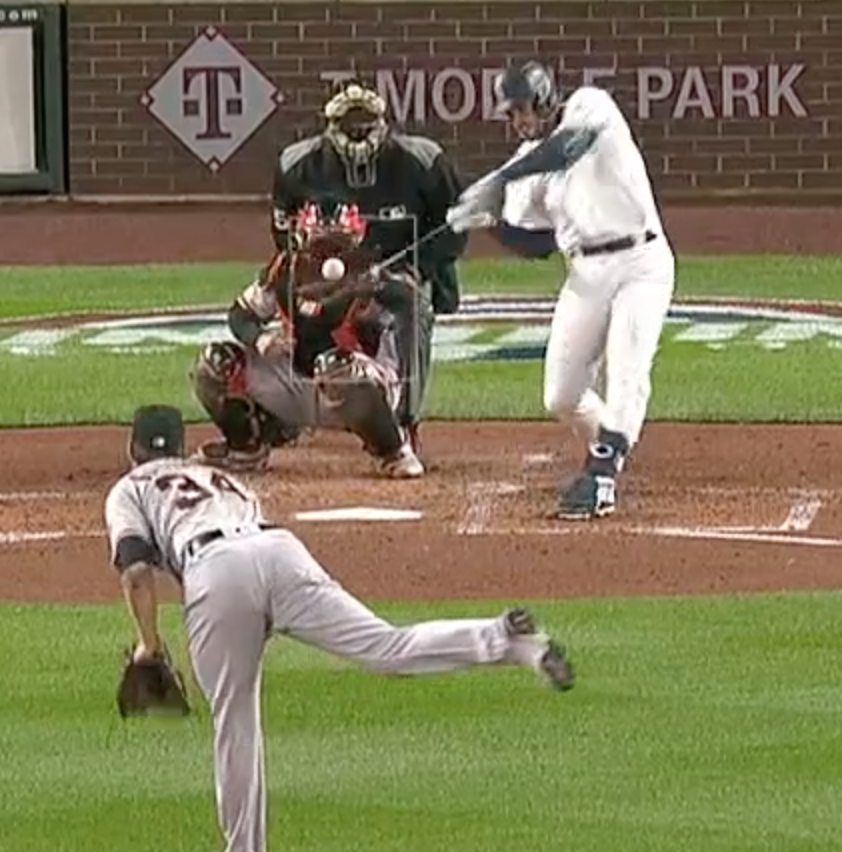
This doesn’t mean the BABIP or wOBA-xwOBA disparity is sustainable, but it could point to far less regression than one would think. Especially when you bring the splitter into the mix.
Splitter Breakdown
https://gfycat.com/yawningthornychafer
Gausman may not be putting the four-seamer in the Heart zone at career levels but he is with the splitter. If the above at-bat to Taylor Trammell is any indication, it’s been having a lot of success, too. Three straight pitches, three straight Heart zone splitters ending in one ugly sword. It’s not difficult to see why when you look under the hood. Gausman’s splitter is pretty unique.
There haven’t been too many changes in terms of the splitter, but the few changes that have occurred have compounded to make an already great pitch even better. While Gausman hasn’t seen any changes occur in terms of spin efficiency or deviation, he didn’t really need to.
The pitch is distinct in that it has the largest deviation between spin-based and observed movement which, combined with a contextually large amount of gyro spin, makes it a seam-shifted wake pitch. I should stress: this doesn’t inherently make the splitter better or worse than any other splitter as SSW is really yet to be quantified in that way. What I can say with certainty is that it makes the splitter very unique and when you make other small tweaks to an already unique pitch as Gausman did, you’re likely to get good results.
Gausman’s vertical release point on his splitter is the highest it has been since 2015. I don’t think it’s a coincidence that he’s getting over an inch more drop than he did in 2020 and more overall drop than he has in his career.
| Metric | Career Rank | |
|---|---|---|
| CSW | 34.7% | 1st |
| SwSt | 28.3% | 1st |
| Whiff | 50% | 1st |
| PutAway | 33.8% | 1st |
| wOBA | 0.14 | 2nd |
| xwOBA | 0.176 | 2nd |
| wOBAcon | 0.2 | 2nd |
| xwOBAcon | 0.273 | 2nd |
The splitter has been fantastic for Gausman, returning a career-high Whiff%, Put Away%, CSW, and SwSt in the season’s limited sample. While he’s using it at a career-high percentage in the Heart – and returning a 38.5 CSW, 27% SwSt, and .227/.299 wOBA/xwOBA – a lot of this overall success can be attributed to his career-high in Shadow usage.
| Metric | Career Rank | |
|---|---|---|
| CSW | 42.7% | 1st |
| SwSt | 32% | 2nd |
| wOBA | .082 | 2nd |
| xwOBA | .131 | 2nd |
The increased drop is likely a contributor to Gausman’s successes with his splitter, but it is more so a piece to the puzzle, as opposed to the entire puzzle itself. Pitches within an arsenal generally don’t have success in a vacuum. Instead, when things are going as they should, they work together to benefit one another in the way that we’re currently seeing with Gausman’s splitter and four-seamer.
Pairing the Two
If we take a four-seamer that is featuring new amounts of rise and is frequently over the heart of the plate and pair it with a splitter that not only features more drop than usual but comes in 10 mph slower than the heater and is finding the edges more than ever, we’re left with this…
https://gfycat.com/idioticsecondhandatlasmoth
and this…
https://gfycat.com/conventionalcornygrassspider
and this…
https://gfycat.com/freevariableborer
ok, sorry, this is the last one, I swear:
https://gfycat.com/freshforkedbudgie
Want to know why Tom Murphy was fooled by three four-seamers over the heart of the plate? There was likely a part of him waiting for this splitter to drop in at his knees. I posited earlier that he got under all three heaters because of the late movement and while that could be true, he also may have just been expecting one of them to be a splitter.
The same reasoning exists with Taylor Trammell. “There’s no way this guy’s about to throw three splitters to me in the zone, right?” Wrong. All the different factors that make each pitch so special – the SSW on the splitter, the increased rise on the heater, etc – are working together to make this four-seam/splitter pairing arguably one of the best in baseball right now.
That said, it isn’t all perfect for Gausman right now. There are some concerning issues occurring right under our noses.
Trouble On the Horizon?
There have been subtle clues dropped throughout this piece that serve as evidence to where Gausman could potentially regress more than I anticipated. Notice how Gausman is throwing more four-seamers in the Shadow zone than ever before, but if you look at the image that showed how he led baseball in RV on Heart zone heaters, you’ll notice he has a big old goose egg in the “Shadow” column. When Gausman elevates that four-seamer, which he’s been doing a lot, it has not had success.
| Metric | Rank | |
|---|---|---|
| wOBA | .410 | 75th |
| xwOBA | .462 | 84th |
| wOBAcon* | .444 | 47th |
| xwOBAcon* | .511 | 52nd |
| SwSt | 7.6 | 42nd |
| CSW | 39.4 | 31st |
While the wOBAcon and xwOBAcon should be taken with a grain of salt (not a lot of BBE so far this season), the rest of the data points to the fact that Gausman is struggling with his four-seamer in the Shadow zone. If you recall, the Shadow zone is essentially all four edges of the plate, so let’s break down the Shadow Zone into three parts: top, sides, bottom:
| Pitches | Pitch % | SwSt | wOBA | xwOBA | |
|---|---|---|---|---|---|
| Top | 40 | 15.7% | 17.5% | .293 | .466 |
| Sides | 60 | 23.5% | 5.0% | .481 | .458 |
| Bottom | 32 | 12.5% | 0.0% | .491 | .465 |
Again, we could be looking at too small a sample size here, but early returns speak to the fact that Gausman is not having success when he tries to find the edges with that four-seamer. A majority of the damage seems to be coming when he’s working east/west and when he tries to paint four-seamers at the knees, though Gausman appears to be putting it there the least.
The xwOBA is certainly a bit scary when he elevates, but we’re once again looking at a disparity between wOBA and xwOBA that may not regress as much as we think, based on the movement profile of the four-seamer.
I don’t feel comfortable saying Gausman should stop trying to elevate but it is worth noting that the early season elevation rate is a career-high for him. The biggest red flag for me is that career-high 23.5% “sides” location, as that’s where most of his Shadow zone heaters are going and that’s where most of the damage is being done.
There are a few reasons this could be happening: perhaps that newfound arm-side run is making it more difficult to locate, or maybe when he’s trying to get in on the hands of hitters, the four-seamer is coming out of whatever tunnel the splitter may have established. While it would be disingenuous to say an exact reason, it seems that this is a zone Gausman would do better to stay away from, though that is much easier said than done.
Closer To the Heart
There is no one thing (or two I should say) that makes Gausman effective, rather a combination of a bunch of disparate things. Gausman is able to have success over the heart of the plate with his four-seamer, not just because it features a bit more carry and arm-side run or because it has above average velocity and command, but also because of his splitter, which he can throw for strikes, get whiffs on, and induce weak contact with. Gausman’s two-pitch mix may give off the impression that hitters have a 50/50 shot of guessing right, but I think that’s a bit off.
The four-seamer and splitter come from virtually the same release point, look the same for quite some time (see overlays) then end up having a 10 mph difference with drastically different late break. Hitters aren’t just choosing four-seamer or splitter. It’s four-seamer up, down, middle or splitter middle, down, or in the dirt…or is this going to be that one slider he’s going to throw?
This isn’t something Gausman just found this year; it’s something he’s been doing for going on 100 IP now. While the facade may be a two-pitch pitcher who leaves too many heaters over the heart of the plate and is one lost splitter grip away from a high-4 ERA, underneath the surface is a very good pitcher who looks like he’ll have continued success.

Could his success over the heart be attributed to the opponents he’s faced?
Hey! In theory it could but we’re talking about an area where virutally all big leaguers have success. Not to mention he’s succeeded against the Padres (though the Reds start wasn’t as pretty).
Great article. You should include how many hits he has surrendered via the splitter over the last 100 innings.
I was waiting for it in the article as it is mind blowing.
He’s a Mike Scott clone. ;-)
Great article, Alex. Any ideas on why Gausman’s K% has dropped off to the extent it has. It looks like from certain of the data that his splitter is slightly worse? Any reason why?