Welcome back to Week 3 of the Pitcher Plate Discipline Rankings! For those of you seeing this for the first time, Alex Drennan and I will spend the season trying to use plate-discipline metrics to help determine a pitcher’s true skill set outside of, and sometimes separate from, on-field results. We’ve then taken those skills and are using a grading system to help rank pitchers by their skill sets. For more details on our methodology and how the grades are calculated, check out our primer article here. For quick reference, here are the formulas:
Plate Discipline A: [3*(O-swing%) + 3*(2*SwStr%+1%) + 3*(1-Contact%) + F-Strike%]/4
Plate Discipline B: 1.5*(1-xSLG)
Final Plate Discipline: (PDA+PDB)/2
Plate Discipline as of 4/24
[table id=71 /]
Every week, Alex or I will highlight different players based on the rankings, but I don’t want us to forget those who came before. So while I picked some interesting names for us to dive into this week, I first wanted to provide an update on the players I talked about in the previous weeks:
| Player | Week 2 | Week 3 |
| Collin McHugh | 10th | 18th |
| Jose Quintana | 27th | 24th |
For the most part, it appears like they both held their own in the second week in the top 30. So far, so good! I’ll keep an eye on how they do and am hoping to do an overall evaluation somewhere in maybe June or so. As Alex mentioned last week, we are rapidly nearing the stabilization points for a lot of these stats, but we still have quite a bit of room for outliers to change things up as well. With that, let’s jump right into this week’s players! Please note that all heatmaps come courtesy of FanGraphs.
Domingo German
2018 Rank: N/A
2019 Rank: 7th (PD Grade: 93%)
| Year | K% | eK% | BB% | O-Swing% | Contact% | SwStr% | F-Strike% | xSLG |
| 2018 | 27.2% | 31.5% | 8.8% | 35.3% | 68.7% | 14.9% | 61.9% | .361 |
| 2019 | 28.3% | 29.2% | 8.1% | 38.5% | 70.1% | 14.5% | 59.6% | .331 |
When the Yankees started the season looking more like a M.A.S.H. Unit than a baseball team, the obvious question became who would step up in the absence of Luis Severino and Jordan Montgomery and at the very least hold their fingers in the dike for the Bronx Bombers’ pitching staff. When the answer out of spring training turned out to be Domingo German, no one was particularly excited. The thing is, so far German has done way more than keep things together; he’s rebuilt the dike and then some. Take a look at his base pitching stats over the last three years:
| Year | IP | ERA | WHIP | BABIP | FIP | SIERA |
| 2017 | 14.1 | 3.14 | 1.40 | .294 | 3.44 | 3.93 |
| 2018 | 85.2 | 5.57 | 1.33 | .300 | 4.39 | 3.68 |
| 2019 | 25.2 | 1.75 | .082 | .180 | 2.88 | 3.72 |
As you can see, German is having a spectacular season, and while his FIP, BABIP, and SIERA are all showing there’s a decent amount of regression coming, there’s no denying he is having a great season. So how has German done it? First, let’s take a look at the plate-discipline stats I listed above. He has elite K rate, which is supported by his eK%, and we’ve actually seen an uptick in his chase rate, while everything else has pretty much stayed the same from 2018. Is this a good or bad thing, considering that his 2018 results were, how should I say, less than desirable? This is where it is important to remember that these rankings don’t care about the results, per se; they care about the pitcher’s skills.
In 2018, German fit the profile of a pitcher who had all the skills but couldn’t execute. So is it simply that German is now properly executing his pitches and fully using his skills? At first glance, it sure seems that way, but that pesky SIERA number keeps tugging at me. SIERA operates much like xFIP, only it takes gives more weight to balls in play (BIP) and what type of BIP they were, and therefore also places more value on strikeouts. See how his SIERAs all line up pretty neatly with each other? This leads me to think that somewhere around a 3.70 ERA is most likely what we should expect from German in a vacuum. With that being said, though, his skill set is clearly elite. So what is really going on here? Why aren’t his skills lining up with his production? Let’s take a deeper dive and see what is going on, along with perhaps finding if German is doing anything different this year that could explain his success.
The first thing that stands out lies in German’s pVal stats. Now it’s pretty early to take any real big-picture value from pVal, but it can be useful for seeing if a pitcher is having more success than normal with a particular pitch. Here’s his pVals so far matched up with last year’s numbers.
| Year | wFB | wFB/C | wCB | wCB/C | wCH | wCH/C |
| 2018 | -6.8 | -0.99 | 0.7 | 0.13 | -2.3 | 0.96 |
| 2019 | 3.1 | 1.78 | 4.5 | 3.33 | 0.7 | 0.96 |
It’s not hard to see where the improvement is coming from. Almost every single pitch across the board is getting better results this year. It’s worth noting that while he throws it much less often than his fastball, his curveball has been a run-prevention machine. These numbers tend to back up German’s season so far. This tells us that his pitches are vastly more effective this year, but the question still remains: Why? What is different that is allowing them to have so much success?
Unfortunately, I suspect a lot of his success is due to the competition he has faced. In order, he has so far gone up against Detroit, Baltimore, the White Sox, Kansas City, and the Angels, all of whom are considered below-average offenses. It would be lazy, though, to simply chalk it up to that and move on. Highly skilled pitchers who know how to use their skills should dominate weak teams, so let’s keep diving deeper and see if this all just opposition-related. When I see a fastball that has improved as much as German’s, I figure it has to be either velocity-related, due to a change in movement or location-based. The average velocity for his fastball has been actually down about 0.8 mph this year, so it can’t be velocity-related, and the fastball’s movement is right around the same, so I doubt it is movement-based either. It’s in the heatmaps that I start to see some clues as to what is fueling German’s success. Check it out. Here’s the 2018 heatmap for German’s fastball:
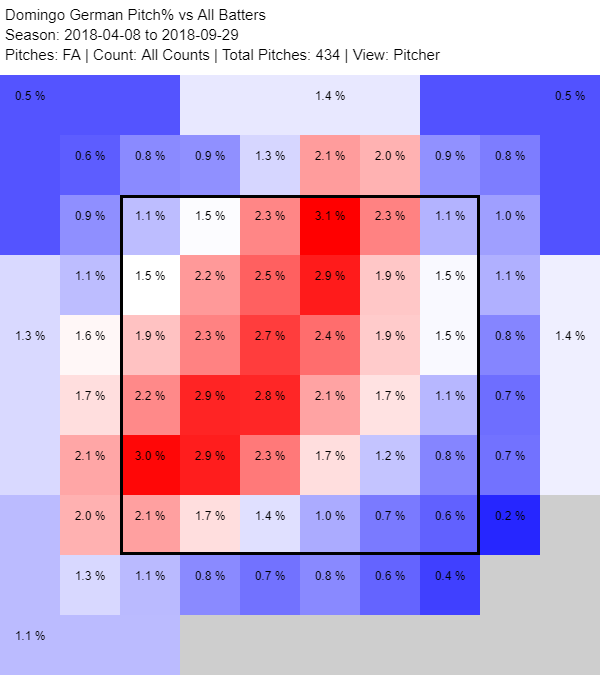
Lots and lots of fastballs sit up in the zone but not out of the zone or run down glove-side, or frankly just sit dead red in the heart of the plate. That’s really not ideal and would explain why it got hit for a .337 ISO last year. Now let’s look at this year’s:
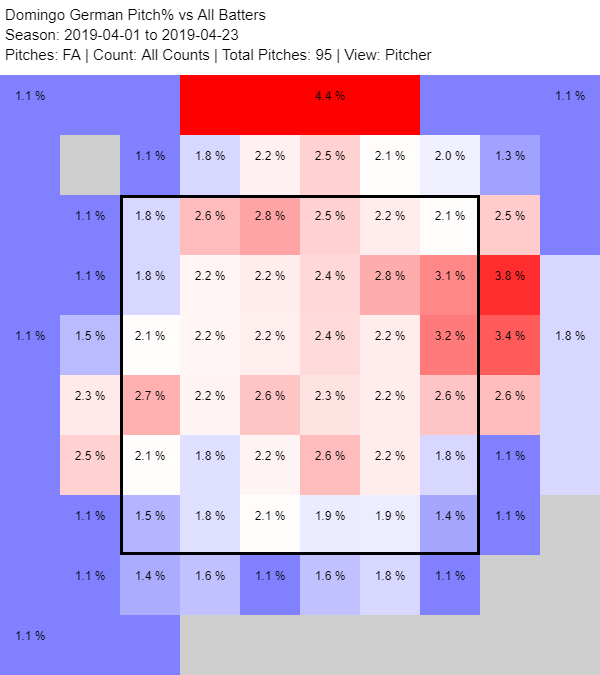
That’s a totally different spread for his fastball and tends to make me think it’s a genuine change in approach as opposed to blind luck or noise in the data. Look at that beautiful 4.4% up and out of the zone. That’s the new, modern approach to fastballs in a nutshell and is exactly what we want to see. It still ends up heavily up and in the zone, but that’s great when it has the pitch running out of the zone to play off. He’s also throwing right on the edge to the arm side way more often than before and seemingly having great success nibbling along that side of the plate. The other thing we love to see is all that blue down in the zone. Hitters are crushing low fastballs these days, and it’s pretty easy to tie a lot of his fastball success to German avoiding throwing the pitch in that area. We see this reflected in the shiny .158, average the fastball has given up along with a .221 ISO (It’s better at least!), and much of that improvement likely is due to where he is now throwing that fastball.
Now, what about that curveball? Let’s do the same exercise. The velocity is almost identical from 2018 to 2019, ditto for movement. Do the heatmaps tell us anything? Here’s 2018:
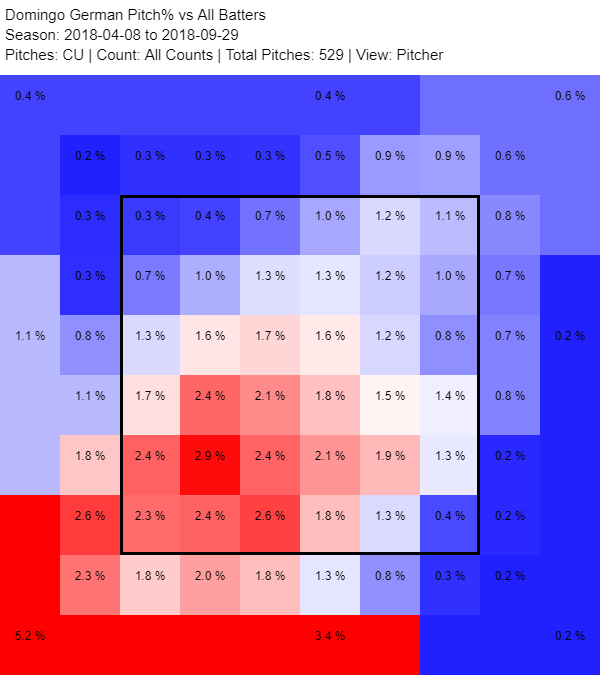
That’s actually pretty much exactly what you want to see for curveball location. He’s throwing it low and showing that he can both throw it for strikes and out of the zone. So how about this year?
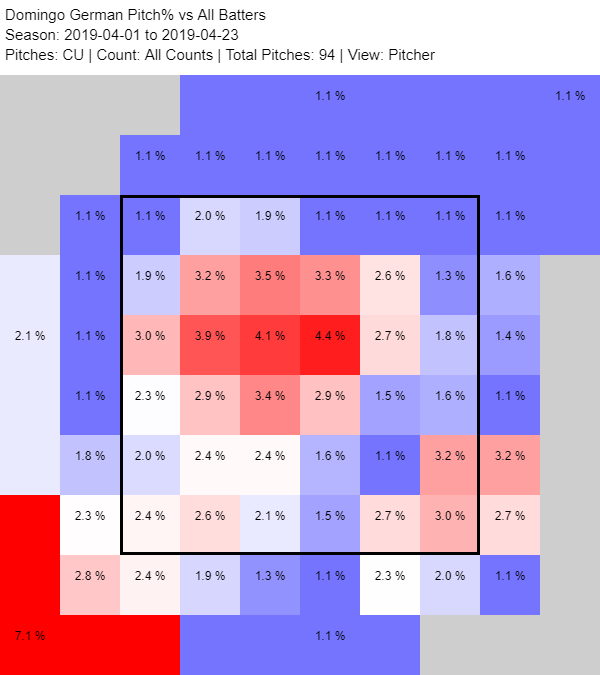
Well, it’s similar but he’s living way more on the extremes this season with his curveball; it’s either the dead center of the strike zone or way outside. This isn’t ideal, as you never want to see pitches straight down the pipe, but at the very least being able to establish your curveball for strikes is important, so there’s that.
That 7.1% down and out of the zone glove-side is a thing of beauty, especially when you consider that he’s essentially throwing it there around nearly a quarter of the time he throws it. The other thing that caught my eye: Check out the arm-side down corner. About 15.0% of the time he’s painting the corner with the pitch as well, which is fantastic. Being able to hit either corner 40.0% of the time you throw your curveball is definitely encouraging. I still wish he threw that curve over the heart of the plate less often, so we’ll need to keep an eye on that, but overall he is definitely using his curveball well.
This is sort of the template we look for these days. Fastball up, breaking pitch down. One other big reason for German’s success with his curveball: It has become a strikeout machine. So far this season it is generating a fantastic 51.9 K-BB% with an astonishing 21.1% swinging-strike rate, which will get the job done every time. In fact, when you add in the 42.0 O-swing% and 43.9% zone rate, we’re talking about a Money Pitch, which you know we love around these parts. If these are genuine changes in approach and they stick all season, perhaps we can see some of this success stick.
So what’s my overall take on German? The talent is there. If you look at his plate-discipline numbers, the talent has always been there; it’s just never shown up in the results. If he keeps the fastball-up, curveball-down approach, I think it could be reasonable to expect somewhere between a 3.40 to 3.60 ERA rest of season as he’s almost certainly not going to continue having a sub-2.00 ERA. If that holds true, we’re talking about a 3.60-ish ERA pitcher with a 28.0 to 29.0 K% pitching for one of the best teams in baseball? That’s a fantastic guy to have on your roster. I do still want to see how he fares against a good offense before I roll out the red carpet fully for German, but I am liking what I am seeing. Keep an eye on his pitch locations, and every time we see him repeat this approach, we can feel more secure in German’s season-long outlook. For now, I recommend a strong hold unless you’ve got someone willing to buy high, and then you should absolutely pull the trigger.
Recommendation: Hold or Sell High
2018 Rank: 52nd (82%)
2019 Rank: 4th (94%)
| Year | K% | eK% | BB% | O-Swing% | Contact% | SwStr% | F-Strike% | xSLG |
| 2017 | 29.1% | 26.6% | 6.7% | 33.4% | 73.7% | 12.9% | 63.5% | .345 |
| 2018 | 28.7% | 25.3% | 7.0% | 32.4% | 74.2% | 11.9% | 61.0% | .401 |
| 2019 | 31.2% | 29.75% | 7.2% | 37.7% | 69.1% | 13.8% | 63.2% | .339 |
Stephen Strasburg is a very good pitcher. You can see the skill right there in the above table. He is also one of the most confounding pitchers to own in fantasy. He drives me nuts. Look at those numbers above; there are a lot of reasons to assume he was having a career season so far, right? Not the case, as he has pitched in his five starts to the tune of 4.11 ERA across 30.2 innings. That’s just not what you paid for when you drafted Strasburg.
Somehow the skills improved, and the results got worse! He’s faced some pretty hefty competition with the Mets twice (10th as a team in wRC+), where posted starts of four earned runs and zero earned, and the Phillies (16th) once, where he gave up six earned. But he also gave up four earned runs to the Giants (29th in wRC+)! The Giants! Los Gigantes! So what is going on with Strasburg? Do we trust the skills increase we’re seeing or do we trust the results? First, let’s look at what BABIP, FIP, and SIERA from the last three years have to say.
| Year | BABIP | FIP | SIERA |
| 2017 | .274 | 2.72 | 3.37 |
| 2018 | .309 | 3.62 | 3.33 |
| 2019 | .264 | 3.57 | 3.18 |
So it definitely seems like some combination of bad luck and poor defense has hurt Strasburg in a big way. The Nationals are ranked pretty poorly on defense, especially with Trea Turner on the mend. So we have to factor that into the equation. There’s unfortunately not much we can do as fantasy owners to control for that, and given that Strasburg has upped his K% and lowered his contact rate this year, the defense will/should matter less than they have in other years. It is troubling that his BABIP is way down, so unfortunately, it’s difficult to get a true handle on just how much of an impact the defense is having on Strasburg’s struggles. Instead, let’s take a look at those skill gains that have placed Strasburg at the tippy top of the plate-discipiline rankings and see if they are sustainable, as that could be the key to understanding Strasburg for the rest of the season.
First things first: Look at that O-swing. A near five-percentage-point bump is huge, and if it holds could be the key to his incredible K rate and maintaining that swinging-strike rate all season. Yet, is he doing anything different this year to earn those chases outside the zone? For one thing, he’s throwing in the zone way less often.
| Year | Zone% |
| 2017 | 49.6% |
| 2018 | 42.9% |
| 2019 | 38.5% |
Yikes. Strasburg has always made a living on pitch movement, so it’s not surprising he throws out of the zone a lot, but during his best years, he was averaging closer to that 49.0%. Since then it has dropped almost 10 points! That has me concerned, but before we draw any conclusions, we need to figure out if there is perhaps a purpose to this. For one thing, if he’s getting hitters to chase more often, it makes some sense to throw more often outside the zone. What I’m wondering is if the real answer lies in his pitch mix. So according to his Pitch Info pitch mix on FanGraphs, he has actually radically changed his fastball usage, splitting nearly 50/50 between his four-seamer and a sinker he introduced last season. Right off the bat, I think I may have found part of the solution as that sinker has been AWFUL the last two years. Check out the numbers on it:
| Year | Percent Thrown | AVG | ISO | wRC+ | pVAL/C | Zone% |
| 2018 | 7.0% | .361 | .222 | 180 | -2.3 | |
| 2019 | 21.3% | .292 | .333 | 171 | -2.2 |
That’s not a good sign. Especially when he has traditionally found a ton of success with his four-seamer (worth 3.5 pVal this season). Here’s his four-seamer location this season:
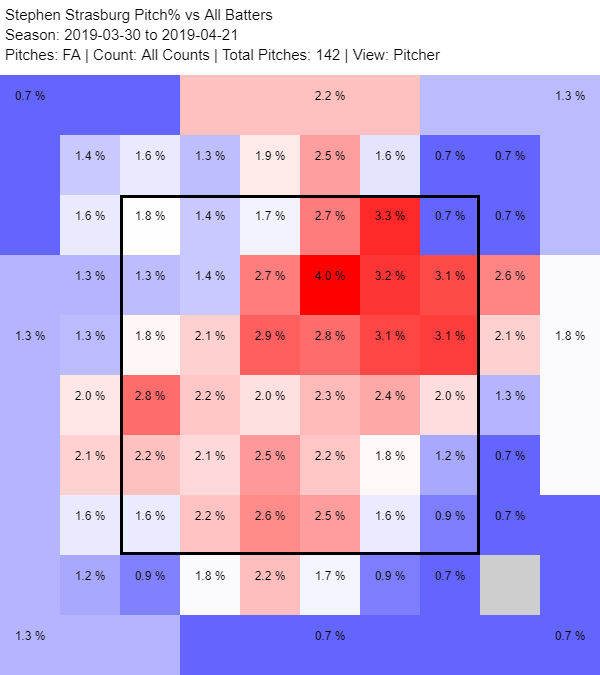
That’s a ton of elevated fastballs (just what we like to see!) and perhaps most importantly, a plethora of strikes thrown. That same fastball has given up a minuscule .125 average with a .156 ISO and 36 wRC+. Thrown in a 9.2 swinging-strike rate and a 28.6 K rate and where he is throwing it, I really wish Strasburg would just stick to his four-seamer.
Now what about that pesky sinker?
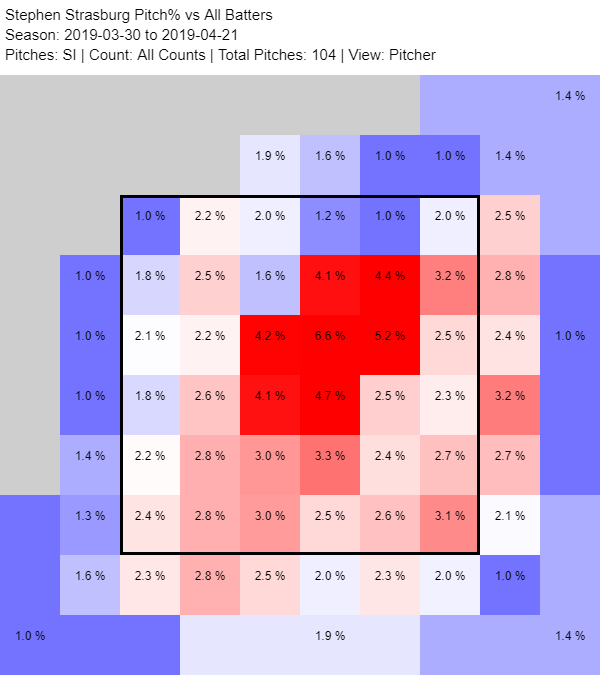
Gah! Great Googa-Mooga, that’s not where you want to throw your sinker. Right now, one out of every three sinkers he throws is ending up right down the heart of the plate and over 50.0% of them are in pretty much in the hitter’s sweet spot. That is not a recipe for success with a 93 mph sinker. By the way, two of his five home runs given up have been hit off his sinker, seven of his 24 singles, and four of his nine walks have occurred when he throws his sinker. That’s not good. So we’ve found the likely culprit as to why Strasburg has struggled, but what about the skill gains? Where are those newfound strikeouts coming from and which pitches is he actually throwing out of the zone? Here are the numbers for his offspeed and breaking balls for the last two years.
| Pitch | Usage% | K% | SwStr% | BB% | Zone% | AVG |
| Changeup 2018 | 19.9% | 48.0% | 21.5% | 6.9% | 23.3% | .160 |
| Changeup 2019 | 21.1% | 40.0% | 26.2% | 3.3% | 34.0% | .207 |
| Curveball 2018 | 19.5% | 40.0% | 12.1% | 5.5% | 47.2% | .175 |
| Curveball 2019 | 26.0% | 48.0% | 18.1% | 0.0% | 40.9% | .125 |
| Slider 2018 | 8.6% | 15.6% | 11.8% | 6.7% | 44.6% | .286 |
| Slider 2019 | 2.5% | 0.0% | 8.3% | 0.0% | 41.7% | 1.000 |
First off, don’t worry about his slider. It’s never been a huge part of his repertoire, and he’s only thrown it seven times this season. But when you combine that the increased curveball and changeup usage with how often those pitches are thrown out of the zone, it’s pretty easy to see where the drop in zone rate came from. It’s also becomes pretty clear where that bump in K rate and swinging-strike percentage come from. He’s taking his two biggest strikeout pitches and throwing them more than ever. Sometimes it’s that simple. So where does that leave us with regard to our outlook for the rest of Strasburg’s season? I’m leaning cautiously optimistic. I will always get excited about a pitcher starting to throw their best pitches more often and see it result in more Ks. If I could guarantee that at some point he will realize that he should throw his sinker less and go back to the four-seamer full time while still holding on to the increased curveball and changeup usage. I would feel much better about the rest of his season. I guess to emphasize my point, I want to show one last time where he ranks in terms of pVal/100 pitches for each of his four main pitches.
| Pitch Type | pVal/C | Rank |
| Four Seam FA | 2.50 | 10th |
| Sinker | -2.11 | 52nd |
| Curveball | 2.87 | 10th |
| Changeup | 1.53 | 29th |
So three of his four main pitches all rank within the top 30 in the league, with two of them falling within the top 10. It’s abundantly clear that so far this season it’s that sinker that his holding him back from what might be the best arsenal of his career. It’s worth noting the pVal for the four-seamer and curve are both the second-best values for those pitches in his career. If he cuts back on that sinker usage, we might see a whole ‘nother level of Strasburg in 2019. The question is who is going to convince him to do it.
Recommendation: Hold but closely monitor that sinker usage. If we go through a few more starts with that sinker usage staying where it is, then I might be out. Could be a really nice buy-low candidate.
2018 Ranking: 15th
2019 Ranking: 9th
| Year | K% | eK% | BB% | O-Swing% | Contact% | SwStr% | F-Strike% | xSLG |
| 2017 | 26.4% | 23.7% | 8.1% | 29.4% | 75.5% | 10.9% | 61.1% | .362 |
| 2018 | 28.9% | 25.9% | 9.2% | 28.8% | 73.1% | 11.9% | 61.0% | .328 |
| 2019 | 30.9% | 27.8% | 10.9% | 34.5% | 71.2% | 12.9% | 56.4% | .309 |
To wrap things up, I want to talk briefly about one last player who is having an incredible start to 2019, and that’s Charlie Morton. We’re seeing him put together a five-start stretch that includes a 3.38 ERA over 26.2 innings with 34 strikeouts and just two homers given up. Those strikeout numbers are the kind of thing you see out of the elite relievers, not a starting pitcher. Look at his main plate-discipline numbers up above. A 30.9 K% needs an NSFW disclaimer, and he has improved vastly in almost every major area we cover. So how has he managed to find this fantastic success? Mainly two things have been the key, and let me know if you see a pattern here, but they’re pitch mix and how he locates his two best pitches. Repeat after me, class: We want pitchers to throw their best pitches as often as possible, and we like fastballs up in the zone and breaking balls down. Nowhere do we see these two ideas play out more than in Morton’s 2019 stats. First, let’s check out his pitch usage over the last three years:
| Year | FA | FC | FS | SI | SL | CB |
| 2017 | 13.0% | 11.3% | 6.2% | 41.3% | N/A | 28.3% |
| 2018 | 29.2% | 5.2% | 6.0% | 29.1% | 1.0% | 29.3% |
| 2019 | 25.2% | 4.4% | 3.7% | 22.6% | 9.0% | 35.1% |
While we’re here how about the respective pVal/C for those pitchers the last three years:
| Year | FA/C | FC/C | FS/C | SI/C | SL/C | CB/C |
| 2017 | 0.69 | -1.21 | -1.56 | -0.34 | N/A | 2.41 |
| 2018 | 0.22 | -2.74 | 0.86 | 0.86 | -0.54 | 1.25 |
| 2019 | 0.46 | -0.72 | -2.45 | -1.64 | 1.91 | 3.12 |
Morton throws a whopping four different fastballs, which is a lot, but as you can see from his usage numbers it looks like he is slowly phasing out his cutter and his split-finger in favor of his excellent four-seamer and his sinker (which has also seen vastly reduced usage every year). So far this year we’re actually seeing a reduction in fastballs across the board in favor of Morton doing what he does best, which is throw nasty breaking balls. Last year during his career year with the Astros, Morton threw roughly 30.3% breaking balls.
In 2019 that number is up to 44.1%. In case you were curious (and I hope you were!) Morton’s curveball carries a 50.0 K rate and a 19.4 swinging-strike percentage, while his new and improved slider has an astounding 24.4 swinging-strike rate to go along with his own shiny 50.0 K rate thus far. We want him throwing those pitches more, no ifs, ands, or buts about it. When you see this increased breaking-ball usage, it’s pretty clear that where that overall increase in K rate and swinging-strike percentage came from in his plate-discipline numbers.
Now, what about the location? Let’s take a look at his three best pitches, his four-seamer, his curveball, and his slider. First the fastball:
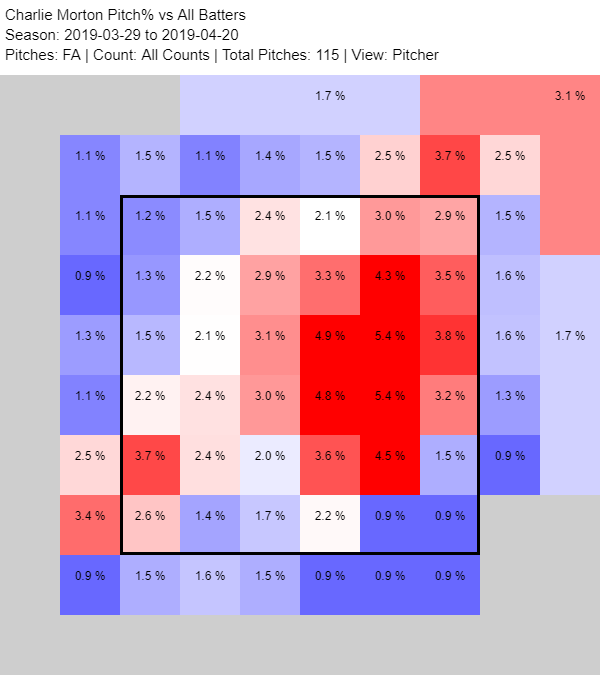
That’s pretty much textbook for what we want a pitcher to do with his fastball. It ends up the heart of the zone a bit more than I would like, but for the most part, it is all arm-side and up location-wise. This is perfect. We want fastballs up in the zone, which Morton does a great job of, but he also shows that he can run it in on the hands of righties as well. The part that I love here is that he does show the ability to nail the down, glove-side corner, which gives him both a great spot to throw his four-seamer to lefties, but also can run the occasional fastball down and away to righties. Woof, I think I’m feeling faint. Now, what about his curveball?
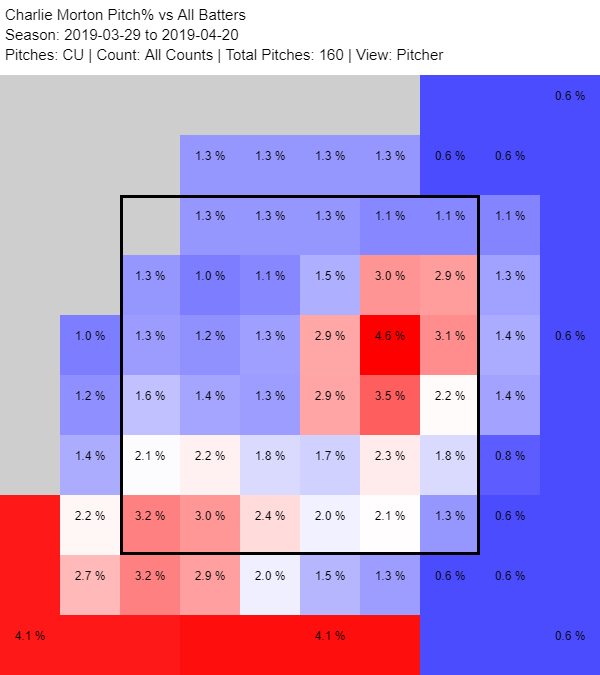
Call McGraw-Hill (the publishing company, not the singers! Stop ruining my jokes!) because once again this is textbook curveball location. We see it down in the zone with a couple of nice red boxes showing he can throw it for strikes, and it’s all out of the zone. On the other side, you can see how he uses it just like his fastball to jam righties inside as well. It’s easy to see why he’s finding success with his curveball when he’s locating it this well. Now finally on to the slider.
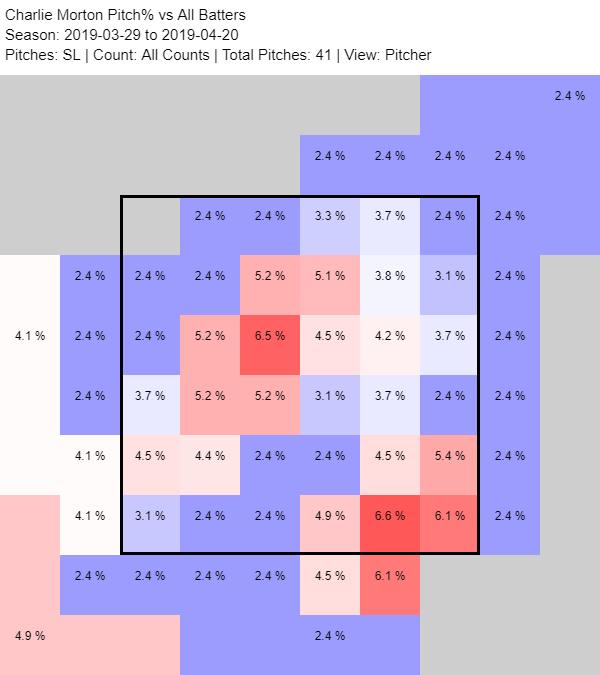
There’s a lot to like here. He has a tendency to throw it right down the pipe more often than I would like to see, but you can see he has the ability to throw it pretty consistently to either corner down in the zone, meaning it’s an effective weapon against both righties and lefties. Overall when you’re locating your best pitches this well and you’re throwing them more often than ever, you’re going to find success. His ability to throw his breakers just inside the zone for strikes sets him up nicely for when he pitches outside the zone and explains the huge increase in his O-swing% this season in addition to the strikeouts.
While I had to do some sleuthing to figure out what was going on with the other two pitchers, it was pretty easy to find the source of Morton’s excellence. The plate-discipline numbers back the performance up, and it feels pretty cut and dried. So why talk about it? Mainly because we started with a pitcher who is starting to find success due to an improving pitch mix and location but isn’t fully there yet and then we talked about an ace who is struggling because of his pitch mix and location. Ending things on a pitcher who has seemingly put it all together to perfection seemed like a good way to bring it all full circle.
I don’t really need to make a recommendation here for Morton, as it seems pretty obvious, but if you have Morton on your team this year, hold on to him and enjoy every minute of it as it’s definitely for real and hitters are going to be flailing at the plate all season.
Recommendation: Hold and reap the sweet, sweet rewards.

Just for fun, I took the top 16 from this list (why 16? I attempted 15 but grabbed one too many) and did my crude analysis that I made up based on real outcomes a week or two ago (K – BB – H). here is how it shakes out:
Snell +13
Smith +13
Cole +13
Morton +12
Paxton +10
Castillo +8
German +7
Boyd +7
Stras +6
Scherz +4
Gaus +3
Musgrove +2
Thor -3
Marquez -4
Maeda – 15
Alcantara -21
To further test my metric out, I grabbed a few guys from the league leaders in Ks (top 10) as that is very clearly the bias.
Verlander +12
Bauer +3
Greinke +3
Corbin + 9
And I grabbed a few of the WHIP leaders (top 10), which should potentially be among the leaders.
Paddack +12
Shoemaker -1
Chirinos -1
Glasnow +2
Its not perfect but nothing ever could be – that shuoldn’t even be our attempt. My point is that my list is better than the xSourced list in some ways and probably a little worse in others, but that there isn’t any inherent truth in Statcast based analysis. I think it gets oversold pretty hard. Overall my list of these names is:
Snell +13
Smith +13
Cole +13
Morton +12
Verlander +12
Paddack +12
Paxton +10
Corbin + 9
Castillo +8
German +7
Boyd +7
Stras +6
Scherz +4
Gaus +3
Bauer +3
Greinke +3
Musgrove +2
Glasnow +2
Shoemaker -1
Chirinos -1
Thor -3
Marquez -4
Maeda – 15
Alcantara -21
Let’s meet in the middle here and I will ask what you think of Maeda and Alcantara, who appear to be the frauds based on my methodology (I don’t want to own it, but I don’t know what to call it). On the other hand, you have Verlander, Paddack and Corbin that seem to get dismissed on yours a lot more than mine. I think those might be cases worth examining. Thanks for the list and analysis.
I’ll keep these guys in mind for next week’s analysis. Love that you’ve done your own analysis and want to learn more about the disparity within each ranking methodology
Is there a particular reason you don’t include Z-swing% in your metrics? It seems that this metric will always under-value guys who get a lot of strikes looking like Kyle Hendricks, Aaron Nola, and Rich Hill.
Hi J,
The metric doesn’t use Z-Swing% because the research done by last year’s author, Chaz Steinberg, showed that there was almost no correlation between Z-Swing% and K% or BB%. I understand your concern about this metric undervaluing guys who get a lot of called strikes, and in the future we will almost certainly incorporate CSW, which should lift their values up. Appreciate the feedback!