Maybe it’s my age showing, but I’m feeling nostalgic. When I first got into writing about fantasy baseball at what feels like 10 years ago, I wrote my second piece ever for Pitcher List on Anthony DeSclafani, aka Tony Disco, comparing him to Cole Hamels and predicting he’d finish the 2019 season as a top 60 pitcher with an ERA between 3.75 and 4, if he continued to increase his slider usage. For the most part I got it right that year, as he ended the year with a 3.89 ERA over 166.2 IP with a 24.0 K%. I was excited to see how DeSclafani continued to grow in 2020, but it just wasn’t in the cards. He battled injuries to start the season and after two good starts to the season, he essentially fell apart, which led to an awful 7.22 ERA over 33 IP and a demotion from Cincinnati’s rotation.
Largely forgotten by the fantasy community this offseason, Tony Disco signed with the San Francisco Giants and has hit the ground running in 2021, putting together an impressive 1.50 ERA (with a 2.65 FIP and 3.41 SIERA) over 30.0 IP, a career-high 25.0 K%, and just two home runs allowed. It has only been 5 starts, so this hot start could be everything, or it could mean absolutely nothing. This is about as small a sample size as you can get but that doesn’t mean there isn’t good information hidden in the sample noise. What I want to do here is see if we can determine whether not DeSclafani’s early-season performance is purely luck and randomness, or if there has been a change that can help explain his early success. That way we have something we can monitor to see if the success is sustainable and if DeSclafani can be a valuable fantasy player throughout the entire season.
When I evaluate a change like this in a pitcher’s level of success, I look to see if:
- If they’ve changed how they throw their pitches or how their pitches move
- If they’ve changed how often they throw their pitches
- If they’ve changed where they throw their pitches
- If they’ve changed when they throw their pitches
If I don’t see any real significant change in either of these four areas then I tend to lean towards the explanation that it was just lady luck and randomness at play and I won’t expect their success to continue. Why don’t we do the same and see if Disco is making a comeback after all?
Let’s go pitch-by-pitch, using these four questions, and see if we can see a pattern. We’ll start with the fastball by analyzing his pitch’s movements over the last three seasons along with spin rates and some context numbers that go with them. Here’s the fastball:
| Year | Vertical Movement | Horizontal Movement | Spin Rate | Active Spin | K% | SwStr% | Zone% | CSW% | pVAL/C |
|---|---|---|---|---|---|---|---|---|---|
| 2019 | 14.3 | 9.6 | 2249 | 89% | 18.7% | 8.1% | 52.6% | 28.9% | 0.2 |
| 2020 | 14.2 | 8.1 | 2222 | 86.6% | 6.3% | 8.0% | 45.7% | 28.5% | -4 |
| 2021 | 14.2 | 10.9 | 2275 | 94.9% | 20.0% | 14.9% | 68.4% | 35.4% | 1.1 |
His fastball has made a significant shift in horizontal movement that seems to coincide with a slight increase in Spin Rate and Active Spin%. This does seem to indicate that there might be a connection for DeSclafani between increased horizontal movement and increased spin and spin-related movement.
You should also turn your attention to the astronomical 35.4 CSW% rate he’s getting with his fastball, along with nearly doubling the pitch’s SwStr% and K%. Are a few inches of added movement and added spin enough to cause this level of success for his fastball? Not on its own, but it’s certainly a good first piece of the puzzle. Now, let’s look at how often he throws the four-seamer:
| Year | FA% | K% | SwStr% | Zone% | CSW% | pVAL/C |
|---|---|---|---|---|---|---|
| 2019 | 35.6% | 18.7% | 8.1% | 52.6% | 28.9% | 0.2 |
| 2020 | 33.1% | 6.3% | 8.0% | 45.7% | 28.5% | -4 |
| 2021 | 26.2% | 20.0% | 14.9% | 68.4% | 35.4% | 1.1 |
We’ve seen that usage decrease every single year since 2019. This year, we’ve seen it dip well below 30% usage and yet the heater has been more effective than it has ever been. It’s not unheard of for pitches to find greater effectiveness with smaller usage rates, especially fastballs. But it also depends on where is he throwing it and when. With decreased usage, these factors can make all the difference in the world.
| Year | Up in the zone | Up out of the zone | Up Borderline | K% | SwStr% | Zone% | CSW% | O-Swing% |
|---|---|---|---|---|---|---|---|---|
| 2019 | 20.6% | 19.2% | 19.5% | 18.7% | 8.1% | 52.6% | 28.9% | 24.9% |
| 2020 | 27.3% | 22.7% | 34.9% | 6.3% | 8.0% | 45.7% | 24.3% | 25.9% |
| 2021 | 23.6% | 10.2% | 22.1% | 20.0% | 14.9% | 68.4% | 35.4% | 30.2% |
This one is fascinating to me. So, it’s currently the pitching meta that we want fastballs up, and for the most part, that’s never been a part of the problem for Disco. The problem has always been one of deception. When you throw that fastball up, it’s important to locate it up in the zone and above the zone but if there is too much distance between those spots you lose the deception effect of throwing up and out of the zone to get hitters to chase. This is where the borderline designation is important. Pitches with that label can end up balls or strikes, but the important part is that it can be near impossible for the hitter to tell the difference and have to chase. So even though DeSclafani is throwing fewer FAs up in the zone and out of the zone, his borderline pitches show he’s doing a much better job of tightly grouping those fastballs and adding an extra layer of deception to the mix. Let me demonstrate this by showing his high fastball groupings over the years. Here’s 2019:
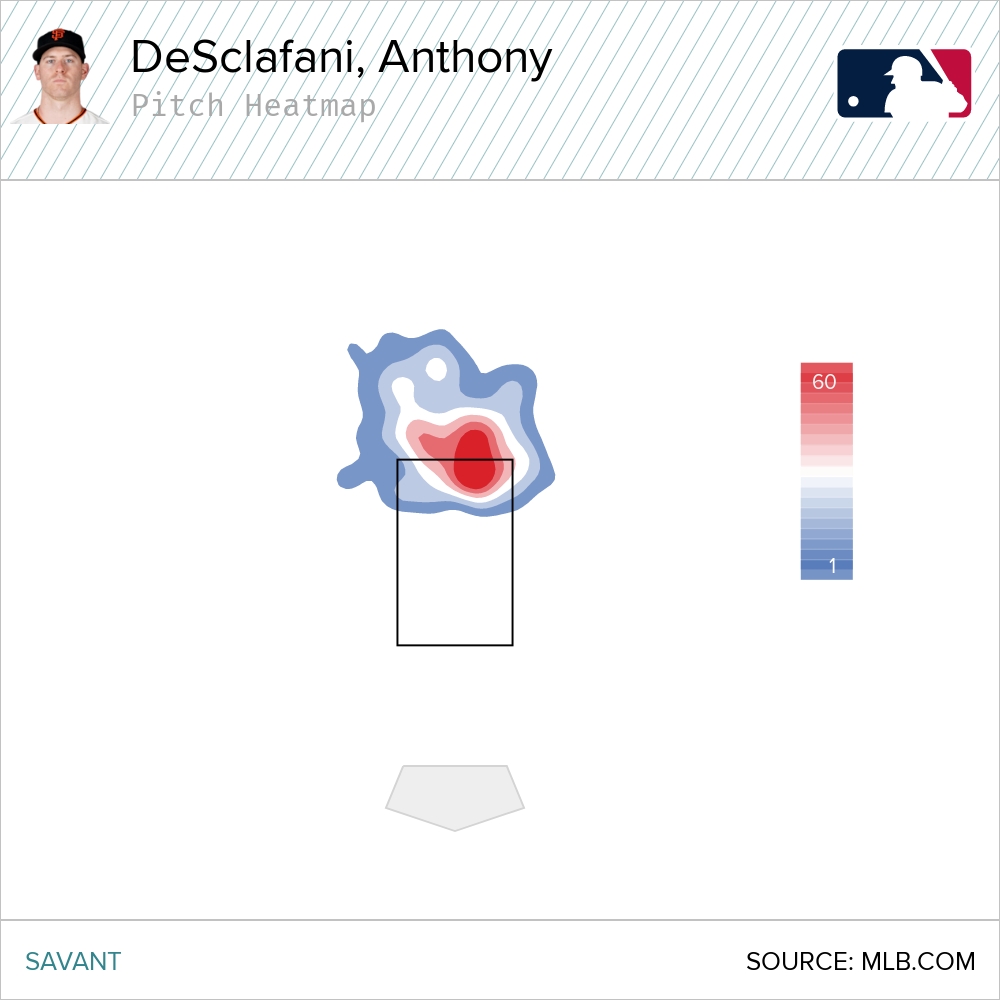
There is plenty of red right where we want it, yet there’s a decent amount of them that are too far out of the zone to be effective pitches. Now, what about 2020?
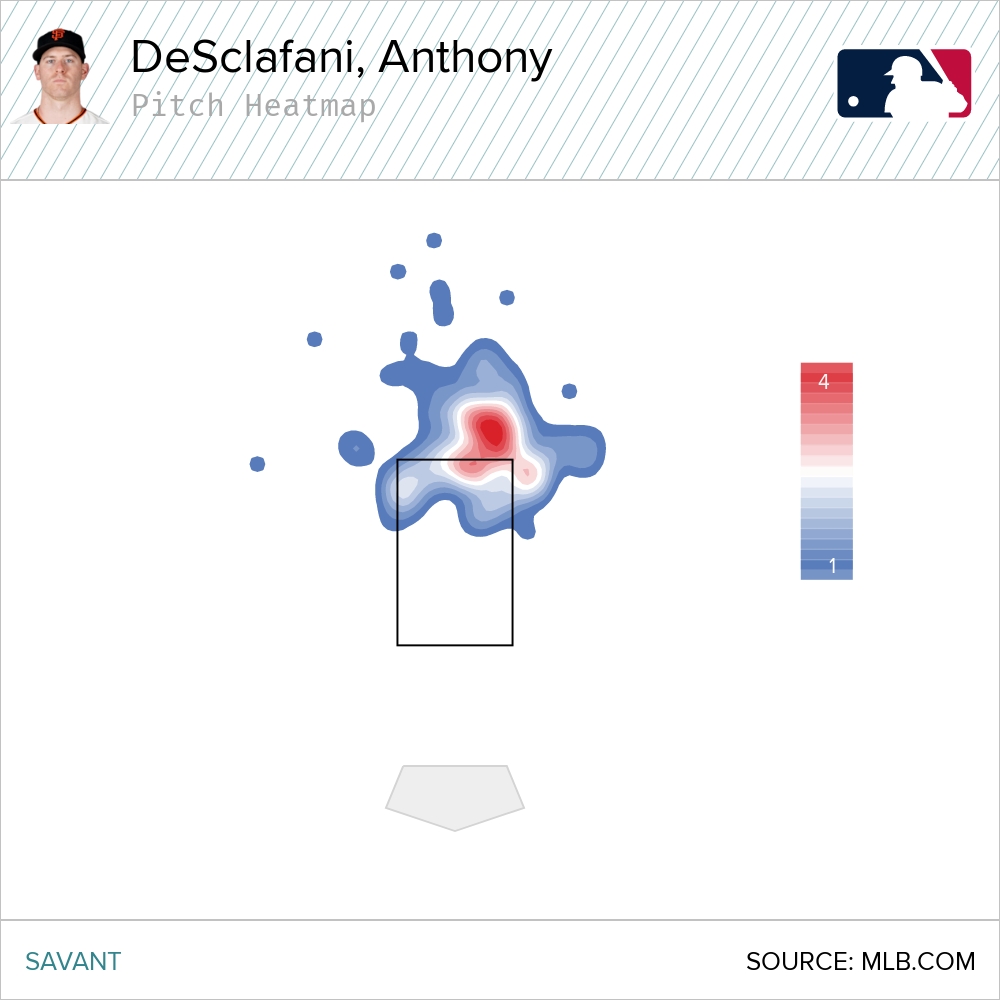
This definitely not what you want to see. That red zone has shifted way too far out of the zone, and while the numbers show he was throwing up in the zone more, he still wasn’t really locating his pitches well enough to be deceptive or get hitters fooled on them. Now, on to this year:
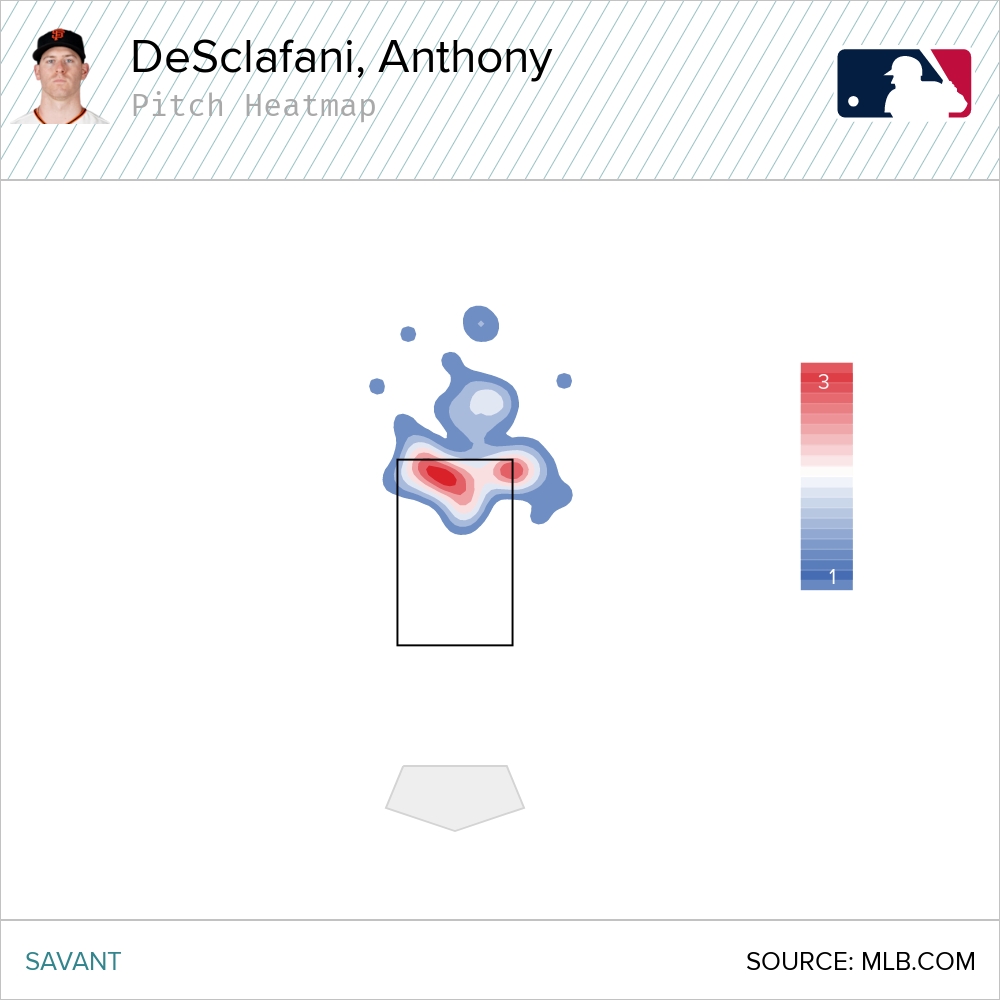
This is far fewer pitches than the other heat maps, but those fastballs are much more tightly grouped than in years prior. It’s hard for any hitter to know with any certainty if that high fastball is a ball or a strike, which causes them to chase the pitch, resulting in a greatly increased O-Swing% (chase rate) and CSW%. Adding in the new horizontal movement has suddenly turned the fastball into a useful weapon for Tony Disco this season. Fastball improvement? Check. Now let’s move on DeSclafani’s signature pitch, his slider.
The Slider
There’s a bit more to unpack here, as you will see in a moment, but let’s go through our paces just like we did with his four-seamer. Disco’s slider has long been his calling card. Pretty much all hope for a breakout has always been pinned on it, and for most of his career it has been one heck of a pitch, averaging 2.0 pVAL/C, but that number is down to 1.0 pVAL/C this year. So, what’s going on? What’s changed? Let’s put the slide piece through its paces just like we did the fastball, starting with how he threw it.
| Year | Vertical Movement | Horizontal Movement | Spin Rate | Active Spin | K% | SwStr% | Zone% | CSW% | pVAL/C |
|---|---|---|---|---|---|---|---|---|---|
| 2019 | 27.4 | 3.7 | 2315 | 36.0% | 18.6% | 14.4% | 47.2% | 27.6% | 1.2 |
| 2020 | 38.2 | 4.2 | 2218 | 27.4% | 21.3% | 16.6% | 39.4% | 27.2% | 2 |
| 2021 | 33.3 | 4.2 | 2128 | 29.7% | 15.6% | 14.4% | 49.6% | 31.7% | 1.0 |
So this pitch has always been a bit all over the place in terms of its vertical movement but has been pretty darn consistent in its horizontal movement, spin rate, and active spin, so there’s nothing too new there. I’m not too concerned with the 5-inch drop in vertical movement simply because its movement is closer to 2019, where the SL was worth 7.6 pVAL over the entire season. Most importantly, though, we do see a massive drop in K%, despite a big bump in CSW%, but I think as we dive deeper, an explanation will reveal itself. Was there an increase in usage?
| Year | SL% | K% | SwStr% | Zone% | CSW% | pVAL/C |
|---|---|---|---|---|---|---|
| 2019 | 24.4% | 18.6% | 14.4% | 47.2% | 27.6% | 1.2 |
| 2020 | 32.1% | 21.3% | 16.6% | 39.4% | 27.2% | 2 |
| 2021 | 28.7% | 15.6% | 14.4% | 49.6% | 31.7% | 1.0 |
There’s an obvious drop-off from 2020 to 2021, but once again, it’s back in line with 2019’s numbers, so I’m not entirely sure that’s the big difference. What about location?
| Year | Total | Down in the zone | Down | Down Borderline | K% | SwStr% | Zone% | CSW% |
|---|---|---|---|---|---|---|---|---|
| 2019 | 628 | 19.1% | 22.0% | 17.7% | 18.6% | 14.4% | 47.2% | 27.6% |
| 2020 | 195 | 24.1% | 34.4% | 20.5% | 21.3% | 16.6% | 39.4% | 27.2% |
| 2021 | 123 | 20.3% | 26.8% | 16.3% | 15.6% | 14.4% | 49.6% | 31.7% |
Again, we see regression back to 2019’s numbers. It’s clear that in 2020 he was using it differently, but the regression doesn’t explain the lack of strikeouts, since it matches the numbers of a more successful year for that slider. That just leaves the question of when is he throwing his slider.
| Year | Total | % in 0-0 | % with 1 strike | % with 2 Strikes | K% | SwStr% | Zone% | CSW% |
|---|---|---|---|---|---|---|---|---|
| 2019 | 628 | 25.7% | 26.1% | 26.1% | 18.6% | 14.4% | 47.2% | 27.6% |
| 2020 | 195 | 24.6% | 25.6% | 25.6% | 21.3% | 16.6% | 39.4% | 27.2% |
| 2021 | 86 | 30.2% | 24.4% | 19.8% | 15.6% | 14.4% | 49.6% | 31.7% |
Well, what do we have here? He’s starting off way more at-bats with his slider than he has in previous years and throwing it far less often in two-strike counts. It’s hard for the slider to strike people out if you don’t throw it in strikeout situations. Why would he choose to do this? It’s his best pitch.
I don’t have any insider information and can’t ask DeSclafani himself, but if you’ll allow me an indulgence I think I have a pretty good idea why. Much like the Starlight Vocal Band or Wild Cherry, for most of his career, Tony Disco has been known as essentially a one-pitch pitcher, which limits the effectiveness of his slider, no matter how good it is. Look at those K% and SwStr% from 2019 and 2020. Such high SwStr% rates would normal imply much higher K%…unless hitters knew it was likely coming in two-strike counts, which made it harder to fool them on those pitches.
In both 2019 and 2020, less than 1/3 of his slider’s swinging strikes were in two-strike counts. He was getting the whiffs, just not when it counted the most. This seems to show that the slider is a more effective swing-and-miss weapon earlier in counts when hitters aren’t looking for it. This year, DeSclafani has seemingly caught onto that as well and has clearly shifted his slider usage to earlier in counts to take full advantage of the pitch, hence the CSW% improvement.
Despite this change, he’s putting together the best K% of his career. Where are the strikeouts coming from then if not from his slider? We’ve already seen some of them come from improvements in the four-seamer, but that’s not enough. It turns out that Tony Disco may have found himself a third pitch. Let’s chat about his curveball.
Curveball
Back when I wrote about DeSclafani before the 2019 season, I said the key to his success was to increase his slider usage. Instead, a few months later, he debuted a new reworked curveball and we all thought it would be the key to unlocking the true Tony Disco. It worked well that year as a strikeout pitch, clocking in at a fantastic 57.1% K rate but still managed a -4.8 pVAL. Why? When hitters hit it in the air, it got hit hard, as it put up a 50.0 HR/FB% rate and had a .250 ISO overall. This season, it still boasts that stellar strikeout rate but this year it hasn’t given up a single HR and is worth a fantastic 3.0 pVAL/C. So what changed? Let’s do the work, starting with movement.
| Year | Vertical Movement | Horizontal Movement | Spin Rate | Active Spin | K% | SwStr% | Zone% | CSW% | pVAL/C |
|---|---|---|---|---|---|---|---|---|---|
| 2019 | 45.2 | 4.8 | 2048 | 42.9% | 57.1% | 15.4% | 34.2% | 25.9% | -1.3 |
| 2020 | 48.7 | 7.1 | 1794 | 62.5% | 16.7% | 3.4% | 39.7% | 25.9% | -1.1 |
| 2021 | 45.8 | 4.7 | 1841 | 71.7% | 53.3% | 15.3% | 32.2% | 15.3% | 3 |
So, not a lot of difference in movement between 2019’s curveball and 2021’s, but there is a huge difference in terms of the Active Spin% between those two pitches. 71.7%% Active Spin% means that most of the movement of DeSclafani’s curveball is due to its spin. Recently, an article written in the International Journal of Exercise Sciences demonstrated, based on a single-variable model, that improving a curveball’s Active Spin significantly decreases the opponent’s batting average against the curveball, so making a 9% leap in the Active Spin% in DeSclafani’s curveball could the be key to explaining the 0.71 BA and 71.4 GB% (a 31.4% improvement over 2019). So, we can definitely say that he’s made some changes in how he’s throwing his curveball. Has he changed how often he throws the curveball too?
| Year | CU% | K% | SwStr% | Zone% | CSW% | pVAL/C |
|---|---|---|---|---|---|---|
| 2019 | 13.5% | 57.1% | 15.4% | 34.2% | 25.9% | -1.3 |
| 2020 | 9.6% | 16.7% | 3.4% | 39.7% | 25.9% | -1.1 |
| 2021 | 13.6% | 53.3% | 15.3% | 32.2% | 15.3% | 3 |
It doesn’t look like there’s been a big change to the pitch’s usage. What about its location?
| Year | Total | Down in the zone | Down | Down Borderline | K% | SwStr% | Zone% | CSW% |
|---|---|---|---|---|---|---|---|---|
| 2019 | 363 | 15.7% | 41.1% | 18.7% | 57.1% | 15.4% | 34.2% | 25.9% |
| 2020 | 58 | 17.2% | 44.8% | 15.5% | 16.7% | 3.4% | 39.7% | 25.9% |
| 2021 | 49 | 15.3% | 20.3% | 15.3% | 53.3% | 15.3% | 32.2% | 15.3% |
This is pretty similar to what we saw with the fastball! He’s tightening up the locations for his curveball when he throws it down while locating it enough in the zone to keep hitters guessing. Let’s look at the heatmaps again. Here’s 2019:
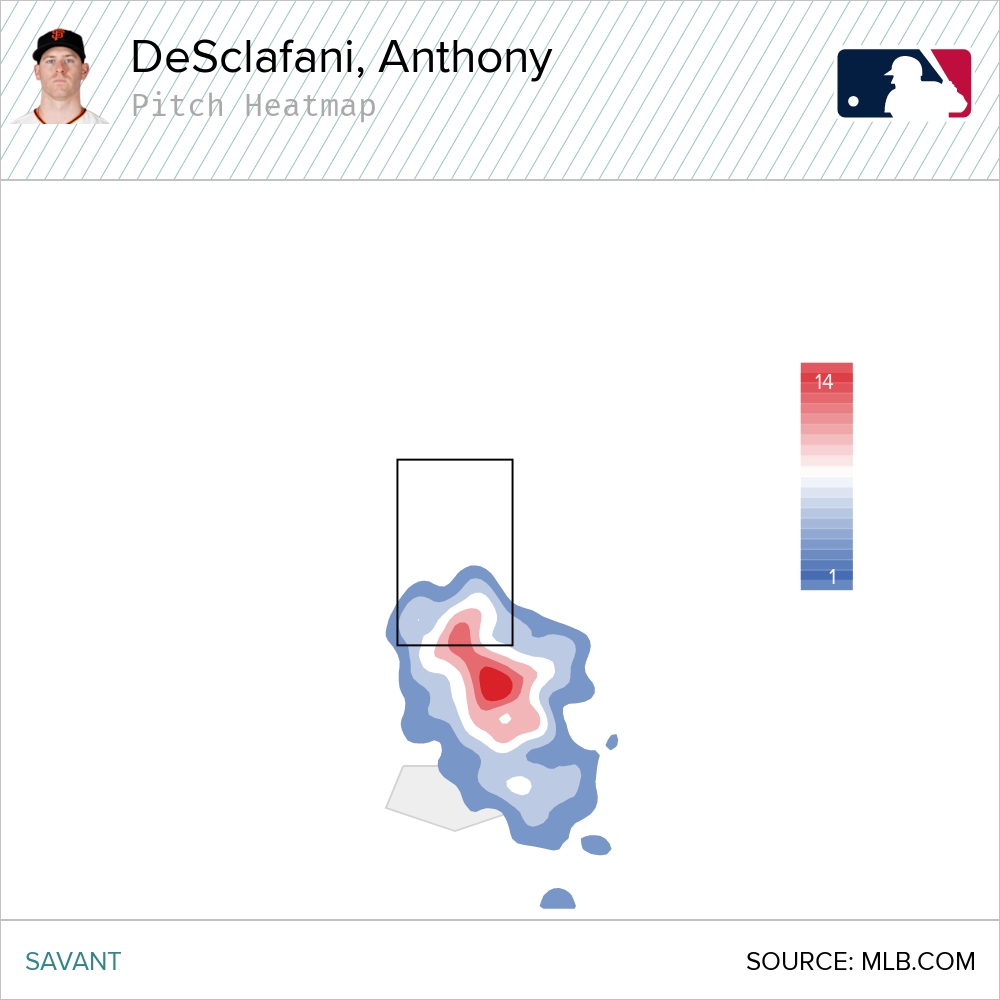
This is a pretty good heat map for a curveball. You’d like to see more red in the zone, but this pretty much the location you want. How about 2020?
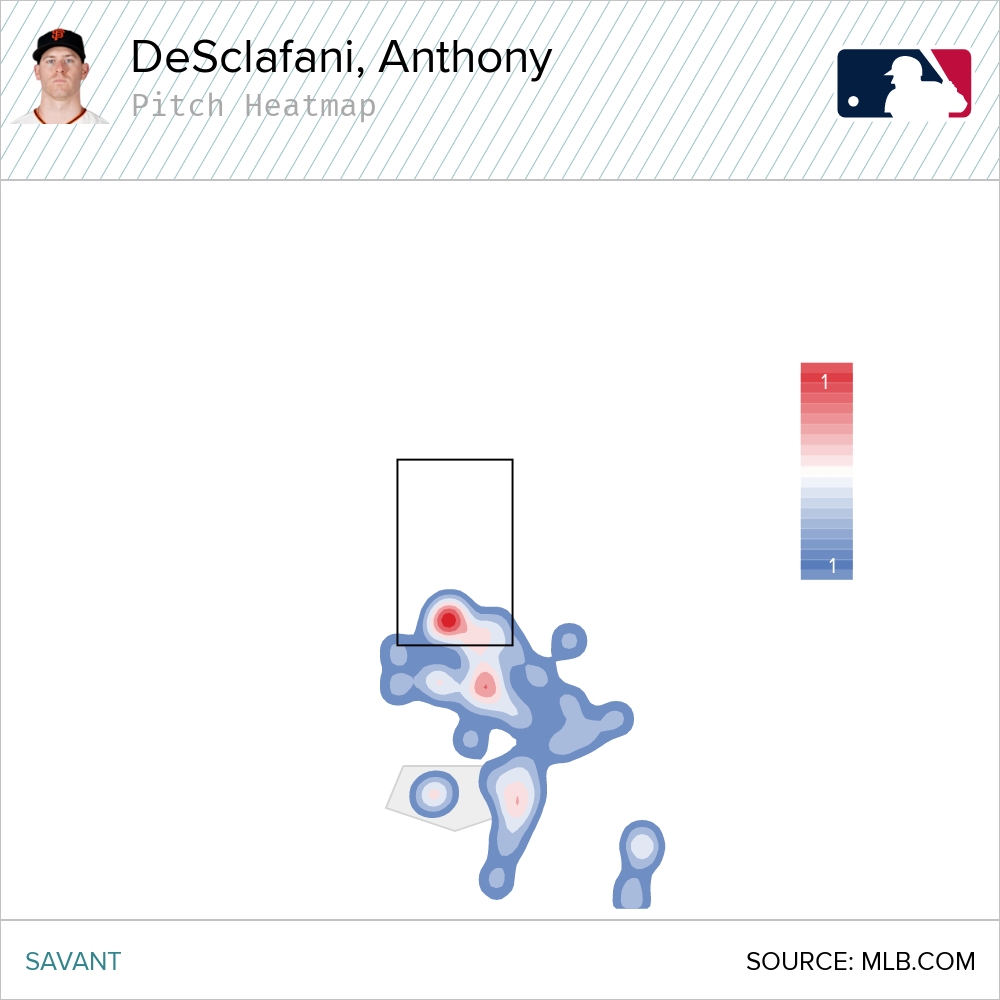
You can see that’s a bit more spread out than you want, with not enough curveballs in the zone nor enough near the zone. You have to keep the hitter from being able to recognize the pitch and assume it’ll be a ball down and out of the zone. When it’s this spread out, it can be a lot easier for the hitter to pick out the pitch, which reduces its effectiveness in both locations. Now, let’s look at this year:
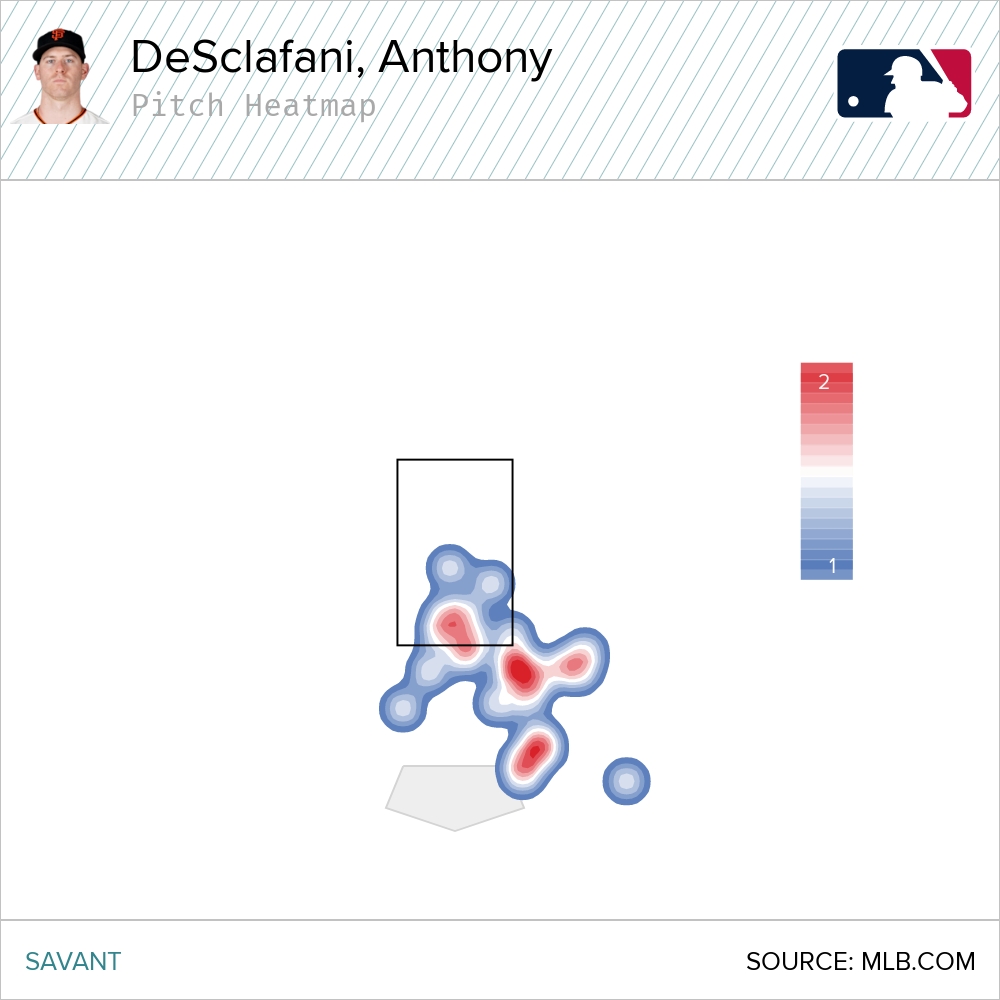
See how this spread is more tightly packed than the others, especially when it comes to the red sections? These are absolutely perfect locations for curveballs. The hitter sees the curve heading in that direction and he has no idea if it’s in the zone or outside of it. Then it’s got a third hot spot way down and out of the zone, which is the perfect out pitch once you’ve established that you can throw the curveball to those other spots consistently. To me, these three heatmaps are perfect for demonstrating the progression from control to command. Before, he was putting the pitch in the general area he wanted it. This year, he’s been throwing the curveball exactly where he wants to and that’s exciting. I think we’ve got this pitch pretty well figured out, but let’s also look briefly at when he’s throwing that curveball as well.
| Year | Total | % in 0-0 | % in 1 strike | % with 2 Strikes |
|---|---|---|---|---|
| 2019 | 363 | 27.3% | 26.5% | 47.4% |
| 2020 | 58 | 51.7% | 24.1% | 13.8% |
| 2021 | 59 | 2.0% | 18.6% | 79.7% |
Yes, yes, yes! If this is your biggest swing and miss pitch and you are locating it that well, you should be throwing it to get strikeouts, not to get easy called strikes earlier in the count. Between the increased Active Spin%, the newfound command of the pitch, and this type of sequencing, I could not be more excited to see what this curveball can do for DeSclafani’s season. Suddenly, we’re looking at an SP who might have made the leap from a 1.5-pitch pitcher to a nice complimentary 3-pitch repertoire. The thing is, we’re not even done yet. Could Tony Disco have a fourth pitch?
Sinker
While DeSclafani’s four-seamer has benefited from a reduction in usage, his sinker has done the exact opposite. He’s throwing it more than he has in years and it’s getting fantastic results, as it currently sits as a 3.0 pVAL/C pitch on the season, just one year after an abysmal -3.9 pVAL/C last year. What’s different? Once more into the breach, my friends. Let’s take a look and see if we can find out! Once again…Movement for the sinker:
| Year | Vertical Movement | Horizontal Movement | Spin Rate | Active Spin | K% | SwStr% | Zone% | CSW% | pVAL/C |
|---|---|---|---|---|---|---|---|---|---|
| 2019 | 19.5 | 15 | 2086 | 93.2% | 25.3% | 5.5% | 60.0% | 23.2% | 1.2 |
| 2020 | 18.8 | 13.9 | 2045 | 91.4% | 21.6% | 2.7% | 58.2% | 18.2% | -3.9 |
| 2021 | 19.4 | 16.5 | 2139 | 97.4% | 27.6% | 6.3% | 65.8% | 24.7% | 3 |
Three things stand out to me. First, notice that he has always gotten exceptionally high K% and pretty solid CSW% with his sinker, despite relatively low SwStr% and high Zone%. I have a feeling that location will play a big part in that, but we will have to see. The second thing that catches my eye is that several added inches of horizontal movement, which should help it mirror his four-seamer a bit more and create some deception. What I like the most here, though, is that we once again see a big jump in Active Spin%. That’s the fourth pitch for DeSclafani that has seen Active Spin% improvement. I was unable to find any correlation data for sinkers and Active Spin, but it could at the very least help explain the additional movement, if not the .080 batting average against that the pitch is currently getting. We mentioned he is throwing his sinker more often:
| Year | SI% | K% | SwStr% | Zone% | CSW% | pVAL/C |
|---|---|---|---|---|---|---|
| 2019 | 17.7% | 25.3% | 5.5% | 60.0% | 23.2% | 1.2 |
| 2020 | 18.3% | 21.6% | 2.7% | 58.2% | 18.2% | -3.9 |
| 2021 | 23.6% | 27.6% | 6.3% | 65.8% | 24.7% | 3 |
Now, what about his locations?
| Year | Total | Down in the zone | Down | Down Borderline | K% | SwStr% | Zone% | CSW% |
|---|---|---|---|---|---|---|---|---|
| 2019 | 475 | 13.1% | 4.2% | 9.5% | 25.3% | 5.5% | 60.0% | 23.2% |
| 2020 | 110 | 12.7% | 6.4% | 9.1% | 21.6% | 2.7% | 58.2% | 18.2% |
| 2021 | 79 | 13.9% | 7.6% | 8.9% | 27.6% | 6.3% | 65.8% | 24.7% |
He is throwing it down and out of the zone more often and that certainly helps, but it’s not a huge leap, at least not one that fully explains a 27.6 K%. This is where we go back to that added horizontal movement. Four of his nine strikeouts with the sinker have been backwards Ks, meaning they were on called strikes. Overall, 68.4% of all the strikes he’s gotten with the sinker are of the called strike variety. What does horizontal movement have to do with that? Well, let me show you a couple of examples. First, check out this called strike three on Garrett Cooper.
I get Cooper’s frustration here. That is just perfect placement for a pitch that moves like this. From his viewpoint, that pitch looks down and out of the zone, but before he can react, it breaks back arm-side and ends up in the corner of the strike zone for the punch-out. Even if he hits that pitch, he’s not going to be able to do anything with it. Being able to throw that pitch against RHH in that spot is essential for success with the sinker. Another important location for beating hitters from both sides of the plate is being able to run the sinker inside on the hands.
These two pitches are textbook sinker location and the horizontal movement is what makes it so deadly in those locations. Sam Hillard swings at that first sinker in on his hands. But it practically heads at him before breaking back over the plate. By the time he realizes it’s going to be in the zone it’s too late. That location is key to getting lefties out with the slider. Then you see a similar spot to Adam Duvall, except on the opposite side, since he’s a right-hander. While he probably sees the ball better here, the pitch definitely looks like it’s going to break in off the plate and ends up in the strike zone. Even if he did swing, it’s going to end up in a broken bat or a ground ball. There’s one other spot I love seeing him throw his sinker. He doesn’t do it often, but he’s been able to find success throwing the pitch up in the zone as well.
Disco probably gets a call here from the ump, but again, you see the effect that horizontal movement has on the hitter. Corey Dickerson sees this coming up and in and lays off, only to see it break back towards the plate just enough to get the called strike three. You don’t want to do it too often but being able to locate that pitch up and in to lefties is huge. I’ve got one more here:
This is another great pitch to a left-hander. Normally you wouldn’t want to throw a sinker up and away to a hitter, as it’ll get creamed, but with that horizontal movement, that’s a pitch that looks like a hitter up and into the middle of the plate, until it suddenly breaks a foot and a half to the right. That’s basically a slider at that point, only at 94 MPH. To give you an idea of that level of break, that 16.5-inch horizontal break is the same you would see on Sergio Romo’s, Trevor Bauer’s, or Yu Darvish’s SLIDER. Now, it doesn’t have the vertical break those pitches have — it probably moves to0 fast for that — but you get the idea of the deception potential this pitch has with that much break. So with location out of the way, when is he throwing it?
| Year | Total | % in 0-0 | % in 1 strike | % with 2 Strikes | K% | SwStr% | Zone% | CSW% |
|---|---|---|---|---|---|---|---|---|
| 2019 | 475 | 16.2% | 21.1% | 43.0% | 25.3% | 5.5% | 60.0% | 23.2% |
| 2020 | 110 | 19.1% | 24.6% | 43.6% | 21.6% | 2.7% | 58.2% | 18.2% |
| 2021 | 79 | 20.6% | 17.5% | 37.1% | 27.6% | 6.3% | 65.8% | 24.7% |
He’s essentially throwing it to either open ABs or to end them. If you combine the locations with the timing data, check out where he is throwing those first pitch sinkers:
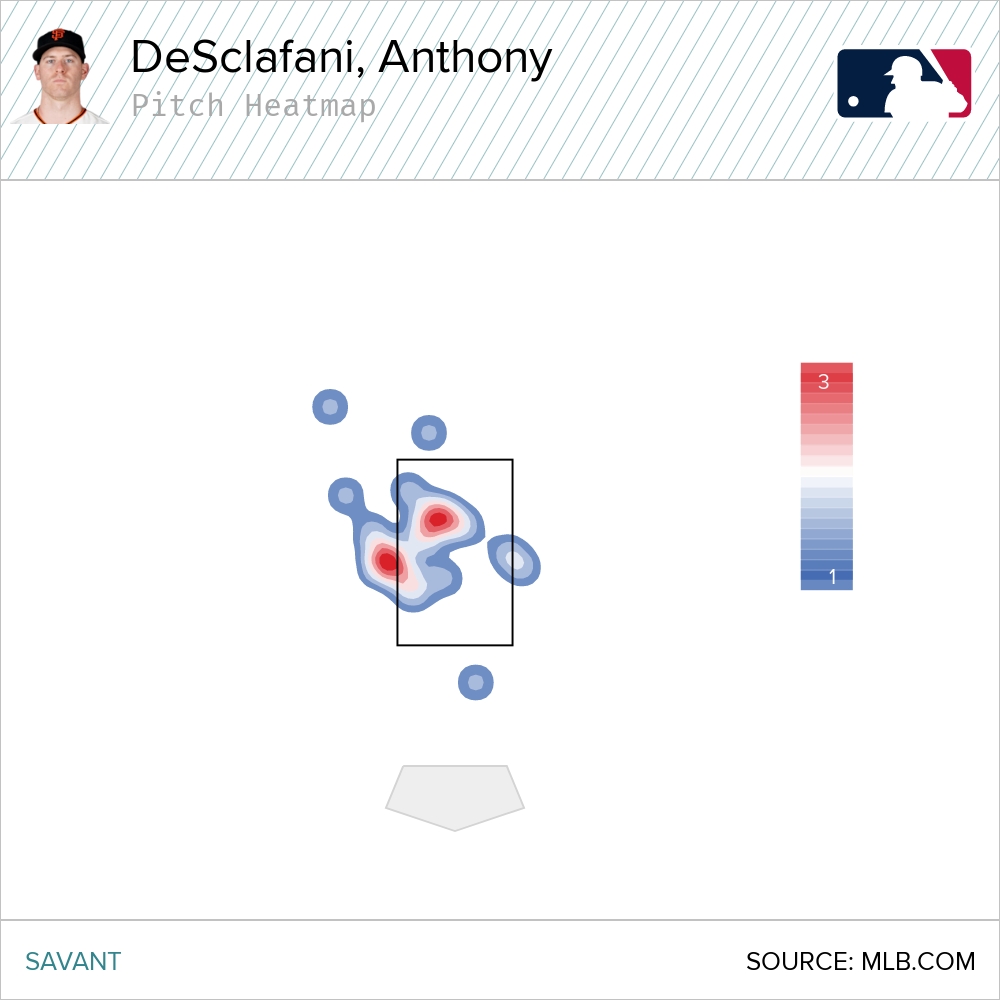
It’s worth noting that 16 of the 21 first-pitch sinkers he’s thrown were to RHH, so you see him mostly coming inside or up and inside with that sinker. It’s a great way to steal a first-pitch strike because most hitters are going to take it even if it is in the zone because there’s not a lot a RHH can do with a sinker in on the hands. What about in those two-strike counts? He threw the sinker against both types of hitters more often, so I split the charts up. Here’s RHH:
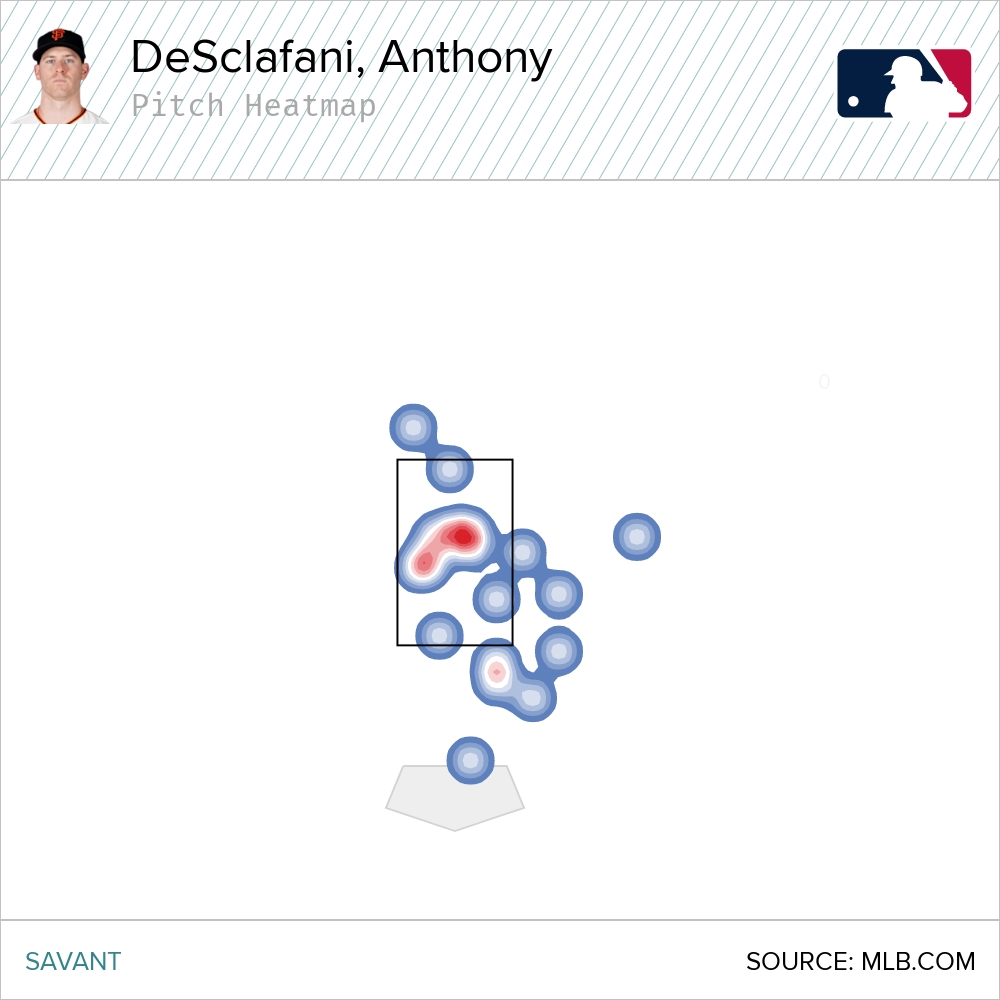
It finds the heart of the zone a bit much for my tastes with two strikes, but I do like seeing that hot zone inside on the hitter and how the rest of the pitches are concentrated up and in or down and away. Now, for those who have less fun with scissors:
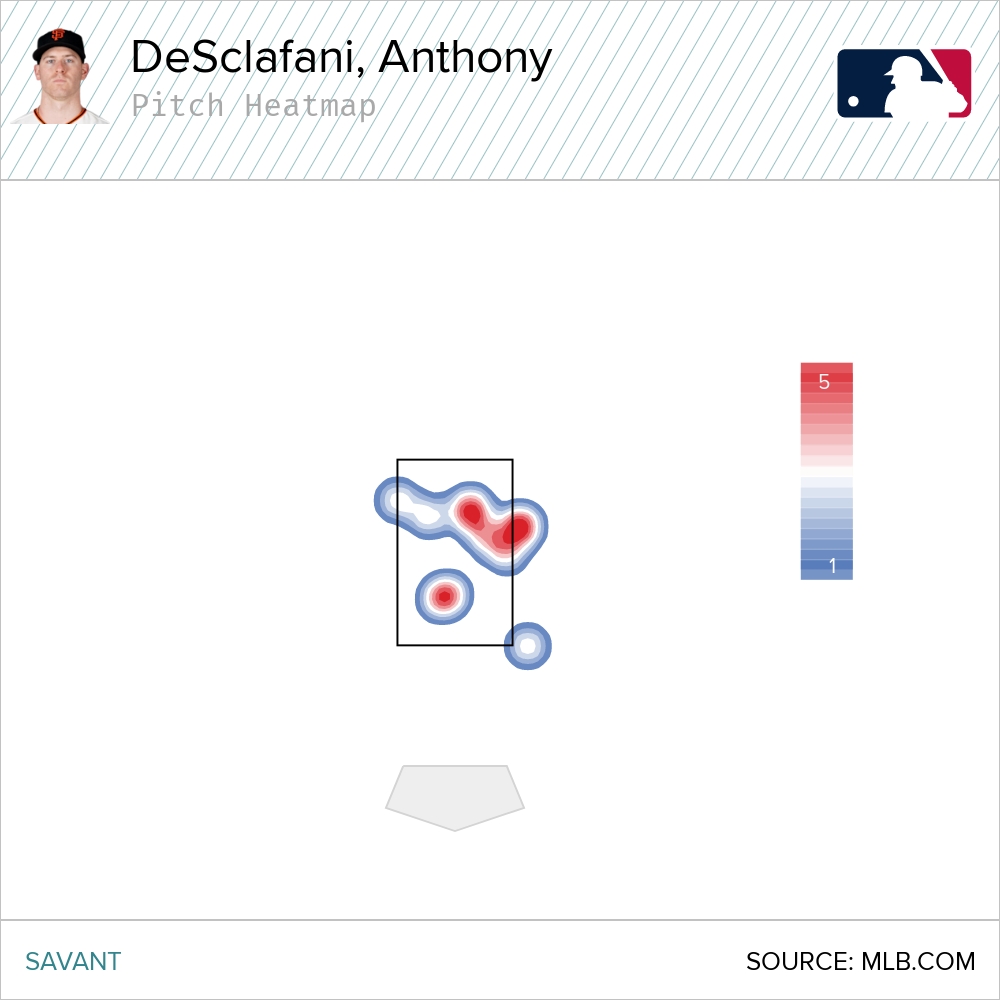
Same thing, just opposite side. Not as bad with the meatballs, but still a little too much of the plate for my tastes with the first hot spot, but I love the other hot spots in on the hands and down. That’s where you want to throw a sinker in these situations. I’m always a little skeptical about sinkers sustaining success, but when you consider the movement factor, I have hope this pitch can continue to be useful for DeSclafani this season.
Conclusion
We’ve now looked through Anthony DeSclafani’s main repertoire and found a lot of reasons to be optimistic that this might finally be the leap we’ve been waiting for since he first burst on the scene in 2016. It’s starting to look like he’s gone from a thrower with about 1.5 pitches to potentially becoming a pitcher with a full array of pitches to attack hitters that he has not just control of, but that he is commanding as well.
He seems to have figured the best time to use them and having Buster Posey calling games has been a huge boost for him as well. He’s limiting the long ball, which has always been his Achilles heel, and is striking out hitters at a better rate than he has in his entire career. There’s a lot to like beyond just his skills too. The NL West is full of pitcher-friendly parks between L.A., Arizona, San Diego, and his home park in San Francisco. And, with the moribund Rockies lineup, even Coors isn’t that scary for him right now. Sure, he has to face the Dodgers and Padres often but he also gets to feast on the Rockies and Diamondbacks.
It’s easy to get too excited by this, coming on the heels of a complete-game shutout, but there are signs that some of this is for real, at least to a reasonable degree. I don’t expect this sub-3 ERA to hold but I wouldn’t be shocked if he finishes with a healthy 150+ IP at about a strikeout per inning, around a 3.50 – 3.60 ERA, and a top-40 to 50 SP in fantasy. That’s finishing somewhere around, say, Kyle Hendricks, Jameson Taillon, Corey Kluber, Freddy Peralta, Chris Paddack, or Marcus Stroman, if you’re looking at Nick Pollack’s newly updated version of The List. I don’t think that’s all that crazy, given what I’ve seen from him this season. He’s only 45% rostered in Yahoo leagues, so if you see him out there on the wire, I absolutely recommend picking him up because he won’t be out there for long.
Photo by Gregory Fisher/Icon Sportswire | Design by J.R. Caines (@JRCainesDesign on Twitter and @caines_design on Instagram)

Well analyzed, but I suspect you’ll eat your words by mid-season as hitters digest exactly what you’ve pointed out. He’ll get the pluses playing in SF and playing the Rockies at home and the Snakes generally, but in-game video returning, etc will probably put him at ~4+ ERA.