


The mental shortcuts all humans use to quickly and efficiently judge something or make a snap decision are called Heuristics. Often, these shortcuts are derived from our prior experiences and can be especially helpful when a quick, short-term approximation is good enough.
On the other hand, heuristics come with a significant risk of cognitive biases—such as confirmation bias, among many others—and relying on heuristics for making highly consequential decisions is not advisable.
In baseball, we frequently use “rules of thumb”—a type of heuristic—to make quick assessments and judgments about player statistics. Most of us probably have a list of numbers to rattle off as benchmarks for identifying good stats. Mine includes seasonal marks like a .300 batting average; 30 home runs; and 20 wins on the mound.
In many cases, these were imprinted in our minds during our formative baseball fan years or when we started playing fantasy baseball, whenever that may have been. This is a form of anchor bias, the tendency to lean on the first pieces of information we learn.
However, we hold those marks static over time while the way the game is played changes, which changes the context in which stats are produced and accumulated. For example, batting .300 in a season in one era (say the late 1960s) could be a quite different achievement from batting .300 in another (like the early 2000s).
With that in mind, I thought it might be interesting to look at some of those benchmarks in the context of how the game is being played today. The way baseball is played has never been more driven by home runs, batting averages have never been less valued, and starting pitchers have never worked fewer games and innings.
What do those realities mean for these iconic benchmarks? As we head into the 2024 season, it’s a good time to take a minute to contextualize our mental shortcuts for today’s game.
.300 Batting Average
Let’s start with batting average. Although this staple stat does not carry the same authority it once did, it’s still one of the most common shorthand stats used to evaluate hitters, and hitting .300 in a season remains an important achievement for a player.
One of the most prominent ways to contextualize stats across eras is to index them against the league averages at the time. You can see from the plot below that the league average batting average has fluctuated significantly between the low .240s and near .270 since the mound was lowered before the 1969 season:
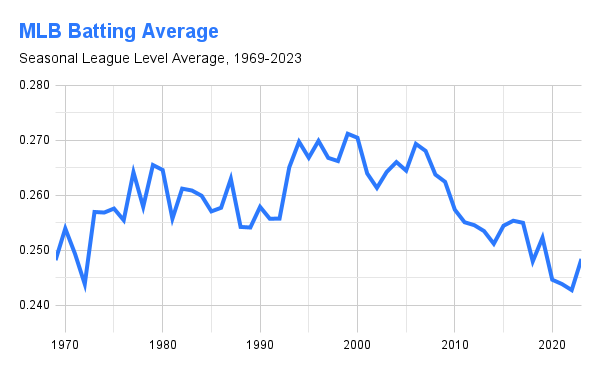
Data from FanGraphs
You can also see that the league’s batting average in the past few seasons is the lowest it has been in about 50 years. Back-to-back batting champ Luis Arraez hit .354 last season, which was 41% better than the league average. For comparison, Todd Helton and Nomar Garciaparra both hit .372 in 2000, but their averages were 36% and 35% better than their respective league averages that season.
Hitting .300 in this era, as Arraez has regularly done, is significantly more difficult than it was in 2000. That point is also illustrated by looking at how many qualified hitters have hit .300 or better in each season:
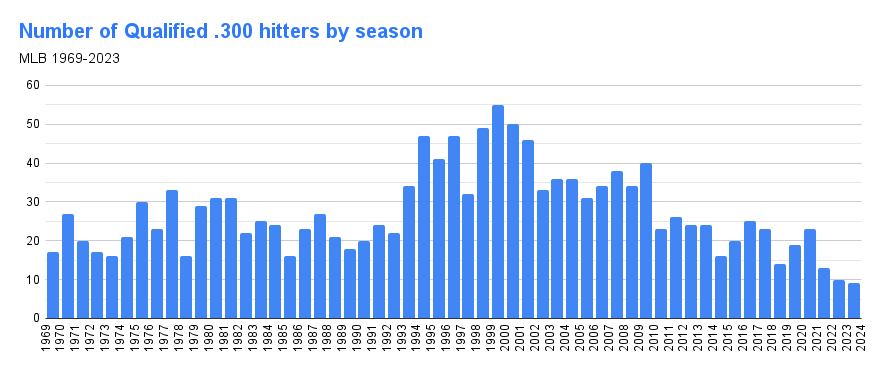
Data from FanGraphs
Over the 54 seasons, an average of 27.8 qualified players (3.1 PA per team game, or 502 PA in a 162 schedule) players have hit .300 in a given season. Only nine managed to do that last season, the lowest number of such hitters since 1969. (And that beat 2022’s then-record low of just ten hitters.)
Over the period reflected here a .300 batting average in a season has been about 16% above the league’s average batting average. The seasonal variation around that mark has ranged as low as 1999’s 10.6% above league average to as high as 23.6% above average in 2022.
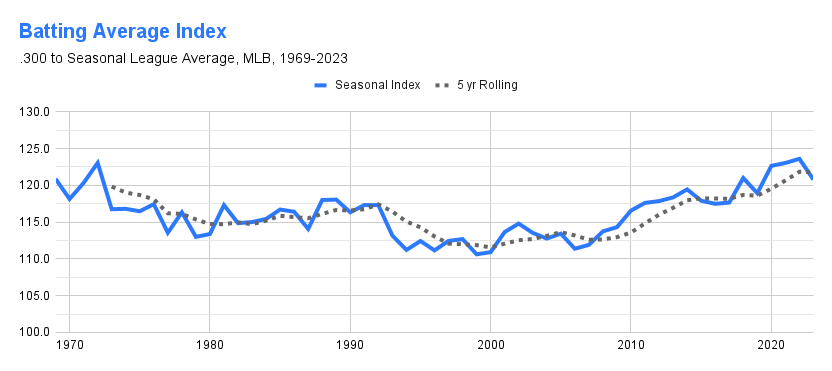
Data from FanGraphs
Suppose we want to understand today’s equivalent of hitting .300 in 1999, which is the era when I first started paying attention to baseball stats and playing fantasy baseball. In that case, we can just add 10.6% to the seasonal league average. Last season the league hit .248, which means a .275 batting average would be a reasonable 1999 equivalent.
Using a five-year rolling average index might be a more conservative way to contextualize this because it’s not as sensitive to single-year shifts, such as what we experienced with last season’s rule changes. That approach, again against 1999, yields a .278 equivalent.
One way to test if this is in the ballpark is by counting up the number of hitters that passed this threshold. Remember, the historical average has been 27-28 hitters hitting .300 in a season. Last season there were 25 hitters at .278 or better and 32 hitters at .275 or better, so this approach appears to be in range.
30 Home Runs
While hitting for average has never been more difficult, popping one over the fence has never been easier. The 2018 Yankees set the team home run record with 267. That mark was surpassed by four teams in 2019, with the Twins quickly resetting the record at 307 and the 2023 Braves have since tied that. Those Twins and Braves clubs each had five hitters bash 30 or more dingers, something that has also become much more prevalent in recent years:
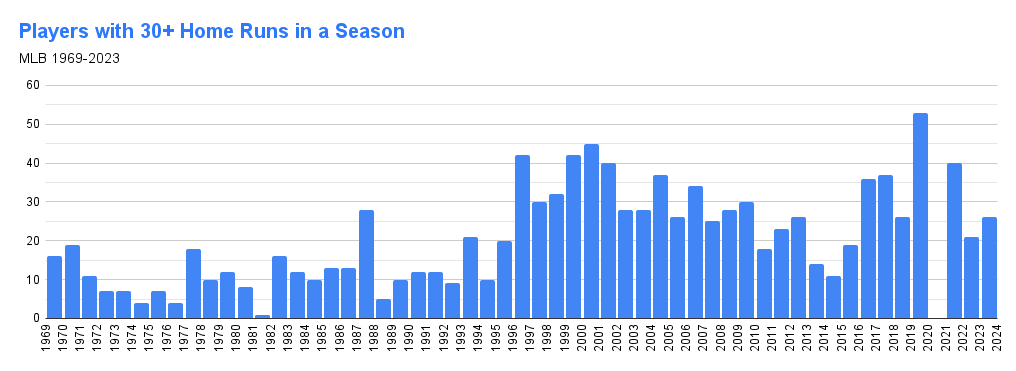
Data from FanGraphs
In the first 27-year span of the data, 1969-1995, an average of 11.6 and a median of 11 players hit 30 or more home runs in a season. If we adjust to exclude the shortened 1981 and 1994 seasons, those numbers increase slightly to 12.2 and 12. About 9.2% of qualified players per season hit 30 or more home runs over this period.
In the second 27-year span, covering 1996-2023 (excluding 2020), the average and median have been 30.3 and 28, and an average of 20.2% of qualified players met or exceeded 30 dingers per season.
Using our same indexing approach as we did with batting average above, we can compare 1976, when Mike Schmidt (38) was one of four players to hit 30+ homers and the league average of qualified players was just above 10 home runs, to the 2019 season when 53 different players bopped 30 or more over the fence, including the Twins’ Max Kepler. Kepler popped 36 in what turned out to be a false alarm breakout and 2019 remains the only season of his career with more than 24 home runs.
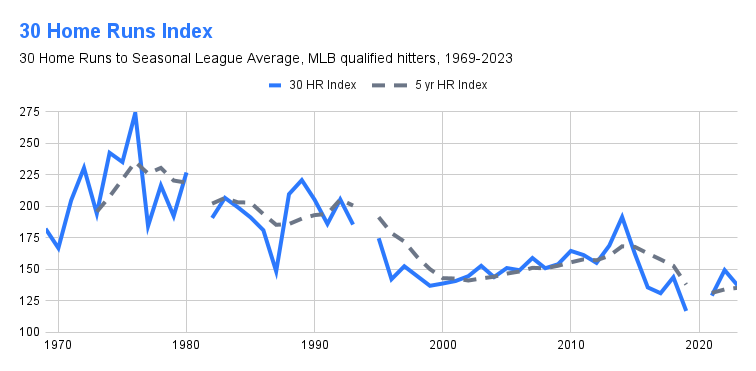
Data from FanGraphs
The 30-home run index to league average in 1976 was 273.9, which implies approximately 70 home runs as the 2019 environment equivalent. That probably is not quite right, because this relationship is likely not perfectly linear, there is probably some upper limit for home runs in a season, and 1974 and 2019 were extreme in opposite directions. Using the more conservative five-year index of 235.2 puts the 2019 equivalent of hitting 30 homers in 1974 at about 60 home runs.
Another way to look at this is by comparing the distributions. Twenty-six players hit 30 or more home runs last season. Twenty-one did so in 2022. Those compare reasonably well to the average of 22 players who hit 21 or more home runs in a season from 1974 to 1976. By this method, hitting 30 homers in today’s environment is about the same as hitting 21 in the mid-1970s.
20 Pitcher Wins
Next, let’s turn our attention toward the pitcher’s mound, where winning 20 games has long been the symbol of a superlative season. This has become an increasingly rare feat, however, as starting pitchers are taking the ball less often and for shorter bursts in today’s environment.
In 1969, the average qualified pitcher started 32.7 games, worked 233.1 innings, and won 14.3 games. Seventy-nine pitchers threw at least the 162 innings required to qualify for the league leaderboard (1 inning pitched per team game) and 15 different pitchers won at least 20 games. Tom Seaver, then 24 years old, led the league with 25 wins over 35 starts and 273.1 innings pitched.
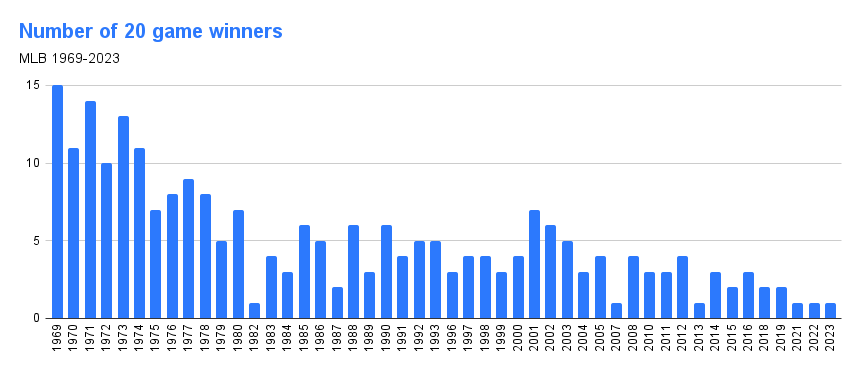
Data from FanGraphs
Compare that to the past three seasons when an average of just 42 pitchers qualified, with just over 182 innings pitched, per season. Just three pitchers, one each season, have managed to accumulate 20 or more wins. Blake Snell won his second Cy Young Award last season with just 14 wins. He won his first in 2018 with 21 wins from just 180.2 innings pitched.
The index for pitching wins is not quite as steeply sloped as it was for home runs. As winning 20 games has become significantly less frequent, the average win total for qualified pitchers over this period has decreased from just over 14 to just under 12.
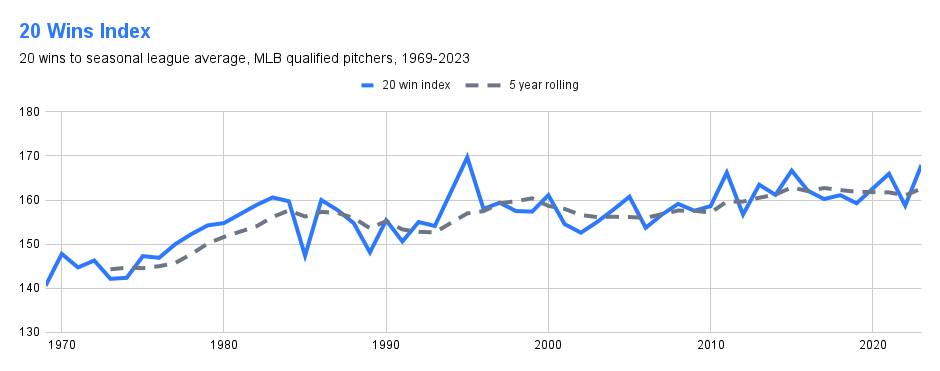
Data from FanGraphs
Winning 20 games in 1969 meant you had about 40% more wins than the average of all qualified pitchers. Doing so the past three seasons has meant you had about 62% more wins than the average. By this method, a pitcher winning 17 games (16.7, rounded up) in 2023 was approximately equivalent to winning 20 in 1969.
But, only two pitchers even managed to win 17 or more games last season. Just 8 total have done so since 2021. If we wanted to get back to the pre-1980 averages of about ten 20-game winners annually, we need to lower our equivalency to between 14 and 15 wins, which have happened 39 and 24 total times, respectively, since 2021.
Conclusion
As we move into the 2024 season and we’re drafting our rosters, it might be helpful to make these adjustments to our rules of thumb. If you’re thinking you want a .300 hitter, in a historical sense, for your club, know that you might be looking for someone who hits between .275 and .280 in today’s environment. For home runs, 30 isn’t what it used to be. You might want to raise your sights to a higher benchmark if you want to stand out from the competition. And for pitchers, wins are a fickle thing, and starting pitchers are getting fewer opportunities to snag them. If you’re thinking you need a bona fide, Tom Seaver-esque, 20-game winning Ace, you’re probably looking for someone who can win 15 games in 2024.
