This past offseason, Pitcher List introduced PLV, a new set of metrics. I won’t try to explain the machinations here, suffice it to say they provide us with a more intuitive way to evaluate player performance by dissecting outcomes at the individual pitch level. For example, was this a good pitch? And what might the expected result be based on the quality of the pitch? Basically, PLV provides better context by accounting for variance while assessing player performance. For a much more thorough explanation, be sure to read Nick Pollack’s primer on PLV here.
For reference, the definitions are listed below straight from the source. Grades are on a 20-80 scale.
Swing Aggression: How much more often a hitter swings at pitches, given the swing likelihoods of the pitches they face.
Strikezone Judgement: The “correctness” of a hitter’s swings and takes, using the likelihood of a pitch being a called strike (for swings) or a ball/HBP (for takes).
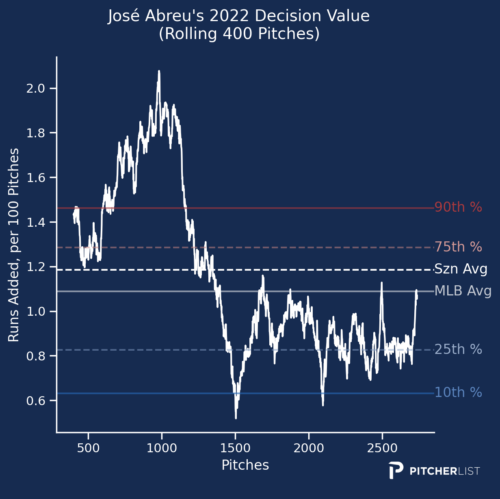
Decision Value (DV): Modeled value (runs per 100 pitches) of a hitter’s decision to swing or take, minus the modeled value of the alternative.
Contact Ability: A hitter’s ability to make contact (foul strike or BIP), above the contact expectation for each pitch.
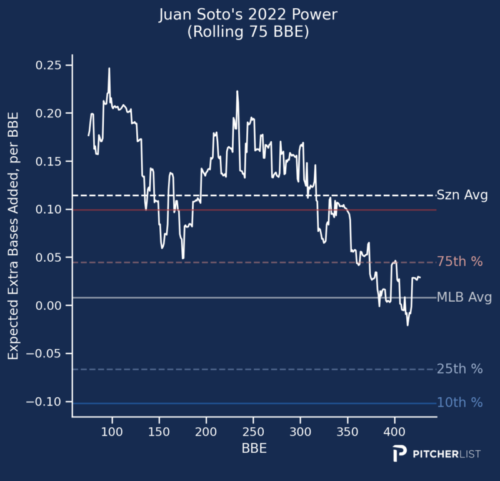
Power: Modeled number of extra bases (xISO on contact) above a pitch’s expectation, for each BBE.
Hitter Performance (HP): Runs added per 100 pitches seen by the hitter (including swing/take decisions), after accounting for pitch quality.
Pitch Level Average (PLA): Value of all pitches (ERA Scale), using IP and the total predicted run value of pitches thrown.
Pitchtype PLA: Value of a given pitch type (ERA scale), using total predicted run values and an IP proxy for that pitch type (pitch usage % x Total IP).
For reference, here are the stabilization points, i.e., when the results tend to become a bit less noisy. They come courtesy of Kyle Bland, one of the very smart and talented people that helped develop PLV. You can follow him on Twitter @blandalytics.
For PLA and Pitchtype PLA, things tend to stabilize at around 500 pitches.
For hitters, it’s a little different.
SZ Judgment and Decision Value: 500 pitches, or roughly 32 games played.
Swing Aggression: 75 pitches, five games played. This is one of the variables that’s stable by now for most players.
Contact: 90 swings, about 12 games played.
Power: 95 Batted ball events, about 35 games played.
The last two depend a little bit on the type of hitter. For example, aggressive hitters will reach it more quickly relative to hitters who are passive and don’t swing as often.
Last week, we surveyed hot hitters. This week, we’ll do the reverse and try to get a better idea about what’s going on with some prominent hitters who are off to frigid beginnings. We’re about four weeks into the season, so there’s still a bit of noise in batted ball data which should still cause some fluctuations in power and HP. However, Swing aggression % and contact are pretty stable by now. We’re also getting pretty close to that point with SZ Judgment and Decision Value. DV is definitely something I’m keeping a close eye on as swing decisions are a critical piece of the puzzle.
(Note: All PLV data is current through Thursday 4/28).
We’ll start in Toronto where it’s still chilly outside. So too is their leadoff hitter who has a .603 OPS, the 16th-lowest among qualifiers.
There’s still a lot of noise in batted ball data, so the first thing I’m looking for are walks and strikeouts. Last year, Springer’s walk rate dipped below 10% for the first time in his career, this year it’s at 7.5%. However, his walk rate might come up some considering the drop in swing aggression %. To that point, his chase rate is also down about three points relative to last year.
Despite having a slightly higher K rate this year (18.9% compared to 17.2%), Springer’s contact rates out better this year. You can see that if you look at his SwStr%, which is down almost five points from 14.4% to 9.5%. His grades in Strikezone Judgment (SZ) and Decision Value (DV) are down a little but the picture we have is incomplete since they both stabilize at around 500 pitches (he’s at 398).
Springer’s power (45) is the big thing that’s missing right now. As mentioned earlier, batted ball data is still unsettled but to get a better picture, his average EV on FB is currently 81.2 (12th percentile) which would be a drop of about four points compared to last year. Not great. But, his xwoBACON of .403 (66th percentile) is actually better than last year’s .391. That has me optimistic that this could just be a weird blip and we should see his power start to tick back up. Combined with the gains in contact and Springer might make some sense as a buy-low candidate.
Ben Pernick might have been onto something. This offseason, he predicted that Manny Machado would fall out of the top seven third basemen. So far, Machado’s .583 OPS is the tenth-worst among all qualifiers.
In addition to Machado’s surprisingly bland batted-ball numbers, another thing Ben Pernick mentioned was Machado’s swinging and missing more. So far, his contact grade remains unchanged relative to last year. But, his current Z-Con% of 79.4% would be the lowest of his career. His chase rate is also up about four points, which is reflected in the dip in Strikezone Judgment (SZ).
For power, it’s still a little early since we’re looking for about 95 BBE, and Machado is at 78 BBE but so far, his is down noticeably. His current xwoBACON of .306 is a big dip from last year’s .453. Maybe at 31, it’s possible that his best days are behind him, but the grades here aren’t enough for me to believe that he’s clearly on the downslope. It’ll be interesting to see how his power output rates once we get a better sample.
In fairness, Arenado might not be off to a frigid start compared to the other four players mentioned, but this is more in relation to what he did last year. His PLV grades right now could point to him as a potential disappointment if they stick. For the record, I did say if.
His swing aggression % is up a bit and it’s reflected in his overall swing rate which is up almost three points this year. That might not seem like a lot but once you consider that his chase rate is up from 34.4% to 40% along with a noticeable drop in DV things get a little interesting. Again, DV isn’t quite stable yet (500 pitches) but his approach will be worth monitoring.
Arenado’s power is also down a little bit relative to last year, but the more interesting thing, to me at least, is that his contact rate is down too. Last year he had a 9.2% SwStr% rate, and now it’s at 13.6% which has led to an almost doubling of his K rate to 22%. That’s still ahead of the league average of 23.3%. But that combined with the notable drop in DV (35) might make it difficult for him to repeat last year’s production.
Coming off a career-low 15 home runs, there were still reasons for optimism about Abreu’s outlook. He had solid batted-ball numbers including an xwoBACON of .398, reasonably close to the .426 he posted in 2021, a season in which he hit 30 home runs. Plus, this year he could take aim at the Crawford Boxes in Minute Maid Park. Fast forward 25 games, and he’s yet to make the choo-choo train at Minute Maid go around the rails.

Many people, myself included, thought Juan Soto made sense as a bounceback player following a disappointing debut in San Diego last year. Just about four weeks in, Soto has a batting average that would make even Mr. Mendoza, AKA Joey Gallo, smirk.
In his final 101 games with the Nationals, Soto hit .246 with 21 home runs, and a .893 OPS. In 52 games with San Diego, his average dipped ten more points but it was his power that took the more noticeable hit as he mustered only six home runs with a nearly 100-point drop in his SLG% as depicted below in Power via PLV.

As Jay Jaffe wrote last year on FanGraphs, there were some unusual things going on in his batted ball profile, most noticeably some wonkiness in his launch angle. It’s tempting to say that whatever happened last year, has followed him this season. And maybe that is the case, in that whatever problem he had last year is also the conspirator behind this year’s mess. But Soto has a different issue this year and that’s strikeouts. A below-average contact grade is not something I think anyone could’ve expected. His whiff rate on fastballs is 24.5%, an increase of almost ten points relative to last year.
Despite last season’s less-than-stellar results, Soto’s strikeout rate was 14.5%, basically right around the previous two years. This year? It’s shot up to 25%. His plate discipline has long been a calling card, and that hasn’t changed this year with a chase rate in the 96th percentile.
But there can be a fine line between being patient versus passive. And it looks like Soto might be on that line right now. As Al Melchior recently pointed out in The Athletic, Soto’s Z-Swing% (swing rate on in-zone pitches) this season is the lowest it’s ever been. Via FanGraphs, Soto’s Z-Swing is the third-lowest among all qualifiers ahead of only Rowdy Tellez and Max Muncy. It’s also depicted by PLV’s Swing Aggression. This year, Soto’s -12.6% represents a drop of over three points relative to last year and is the eighth-lowest of any hitter tracked this season.
PLV has also noted a dip in Decision Value (DV) this year. Although, in his case, it’s merely a dip from 80-grade perfection. But maybe there’s something to it. As The Athletic’s Eno Sarris noted last week on Twitter, Soto is seeing more pitches at the bottom of the zone. That combined with his low swing rates on pitches inside the zone provides a possible mechanism behind the rise in strikeouts.
As far as power goes, Soto ranks similar to last year. As mentioned earlier, batted ball data is still flimsy but for illustrative purposes, his 38% flyball rate is identical to last season. And his EV on FB/LD of 92.9 (89th percentile), and .418 xwoBACON (71st percentile) are fairly close to his last two seasons.
The big question is can he get correct this strikeout issue? It’s admittedly anecdotal, but I’m reminded a little bit by another very patient hitter, Mike Trout. Three seasons ago, he dealt with a similar spike in strikeout rate as pitchers attacked him a little differently. Granted, he remains one of the game’s most productive hitters, but Trout’s strikeout rate never came back down. Maybe Soto is at a similar crossroads. I’ve not the slightest clue where this latest example of the neverending cat-and-mouse game between hitter and pitcher ends, but for a player who famously turned down an extension worth over $440 M, the stakes couldn’t be higher.

