


Once Spring Training starts, we’re all itching to grab onto the next big thing. Baseball is back, but unfortunately, baseball is a sport that doesn’t do well in short samples. Social media can explode over Wyatt Langford’s first home run or share caution over Chris Bassitt’s drop in velocity, but traditional wisdom is to ignore Spring Training stats generally.
For those with a Baseball Savant tab open every day of the year, that’s easier said than done. We see numbers on the page and instinctively need to take something away from them.
As Spring Training comes to a close, it’s a good time to take a closer look at which stats from this period are significant. Understanding which physical and traditional stats are most important can give you an early advantage in determining which players may have significantly improved before the start of the regular season.
I looked at stats from 2021 to 2023 for Spring Training and the regular season. For the rate stats, I took those who qualified for Spring Training leaderboards. Some SwStr% and barrel rate data have smaller samples because not every Spring Training park had pitch-level & Statcast data. Since stats such as ERA, AVG, HR/9, and others take almost full seasons, if not more, to stabilize, they don’t need to be touched on.
Pitching Stats
The first thing that usually comes to mind on the pitching side is velocity. It is a crucial factor that can be seen immediately without requiring much time to stabilize. When you watch a Spring Training game and witness a new fastball making opposing hitters uncomfortable in the batter’s box, you can see there might be something significant.
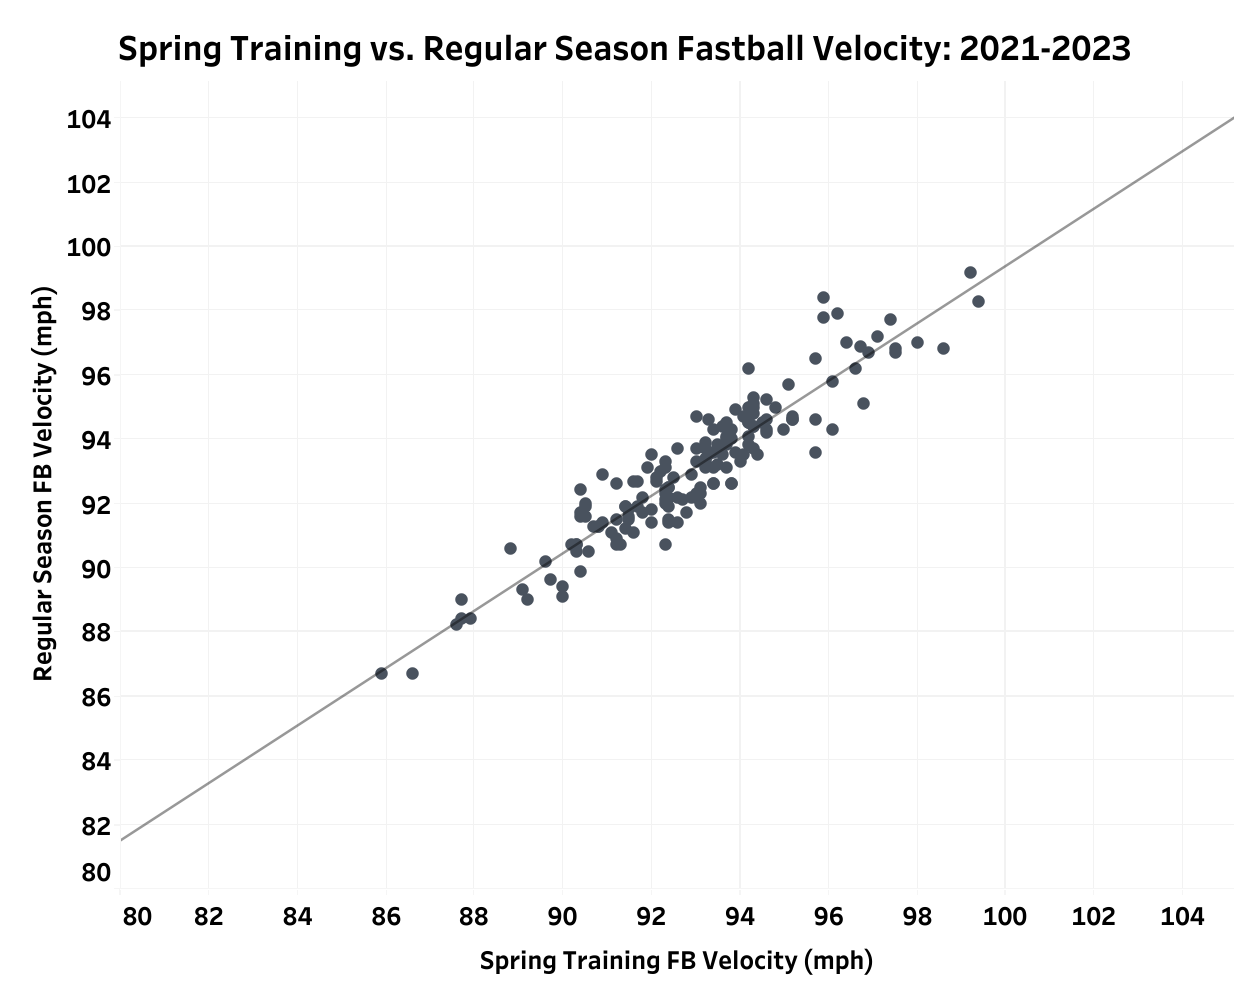
Fastball velocity translates very well from Spring Training to the regular season. The two have a strong correlation, as it’s hard to alter velocity from March into the season significantly. However, because the pitching sample is primarily aimed at including starting pitchers, there is a trend that players are still ramping up for the season in Spring Training.
During the transition from Spring Training to the regular season, 55% of pitchers experienced an increase in their velocity, 40% experienced a loss, and only 5% could maintain their velocity. However, the overall trend is not as straightforward when the data is further analyzed based on velocity bands.
More pitchers who don’t throw as hard in Spring Training increase their in-season velocity. They have more room to grow as the fireballers already hitting 95+ mph are not able to go up as much.
Fastball velocity is important for a pitcher’s effectiveness and stabilizes very quickly. The rest of the available Spring Training stats don’t stabilize within the necessary timeframe, but some progress quicker than others. Going off of fastball velocity, we get to swinging strike rate, which indicates how often a pitcher obtains swings and misses out of all their pitches.
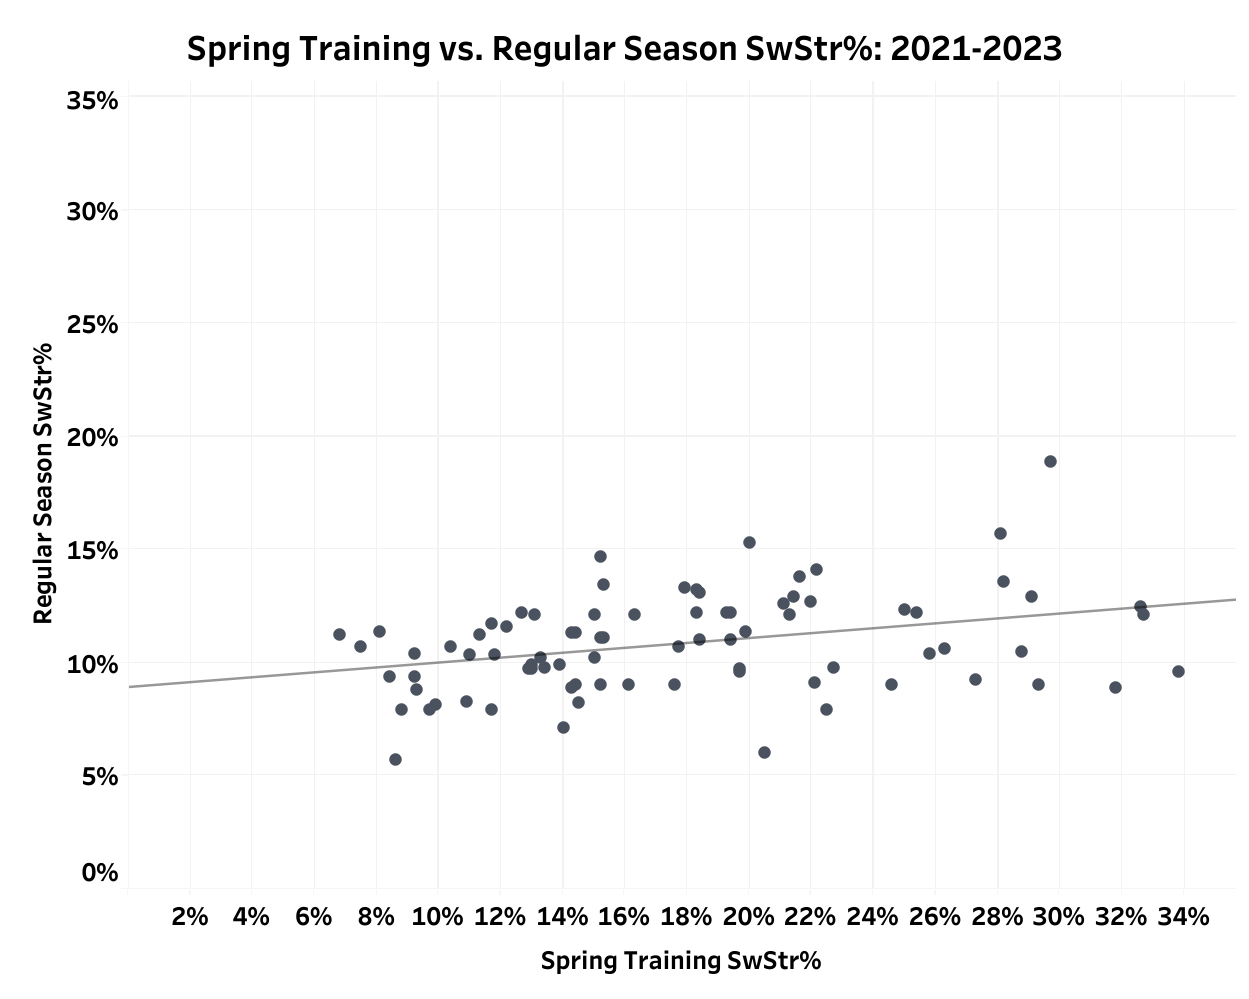
This dataset is much noisier, as SwStr% ticks up in the smaller sample against weaker lineups. There’s a small positive relationship between SwStr% in Spring Training and the regular season, but many players who miss bats in Spring Training have strong regression. A handful of breakout arms, such as Julio Teheran, Jared Shuster, and Kyle Muller, do not have any swing-and-miss ability come the regular season.
However, two pitching rate stats are more powerful in-season than SwStr% in Spring Training: strikeout rate and walk rate. They take slightly longer to stabilize in-season, but recent Spring Training data gives K% and BB% stronger relationships to in-season performance than SwStr%.
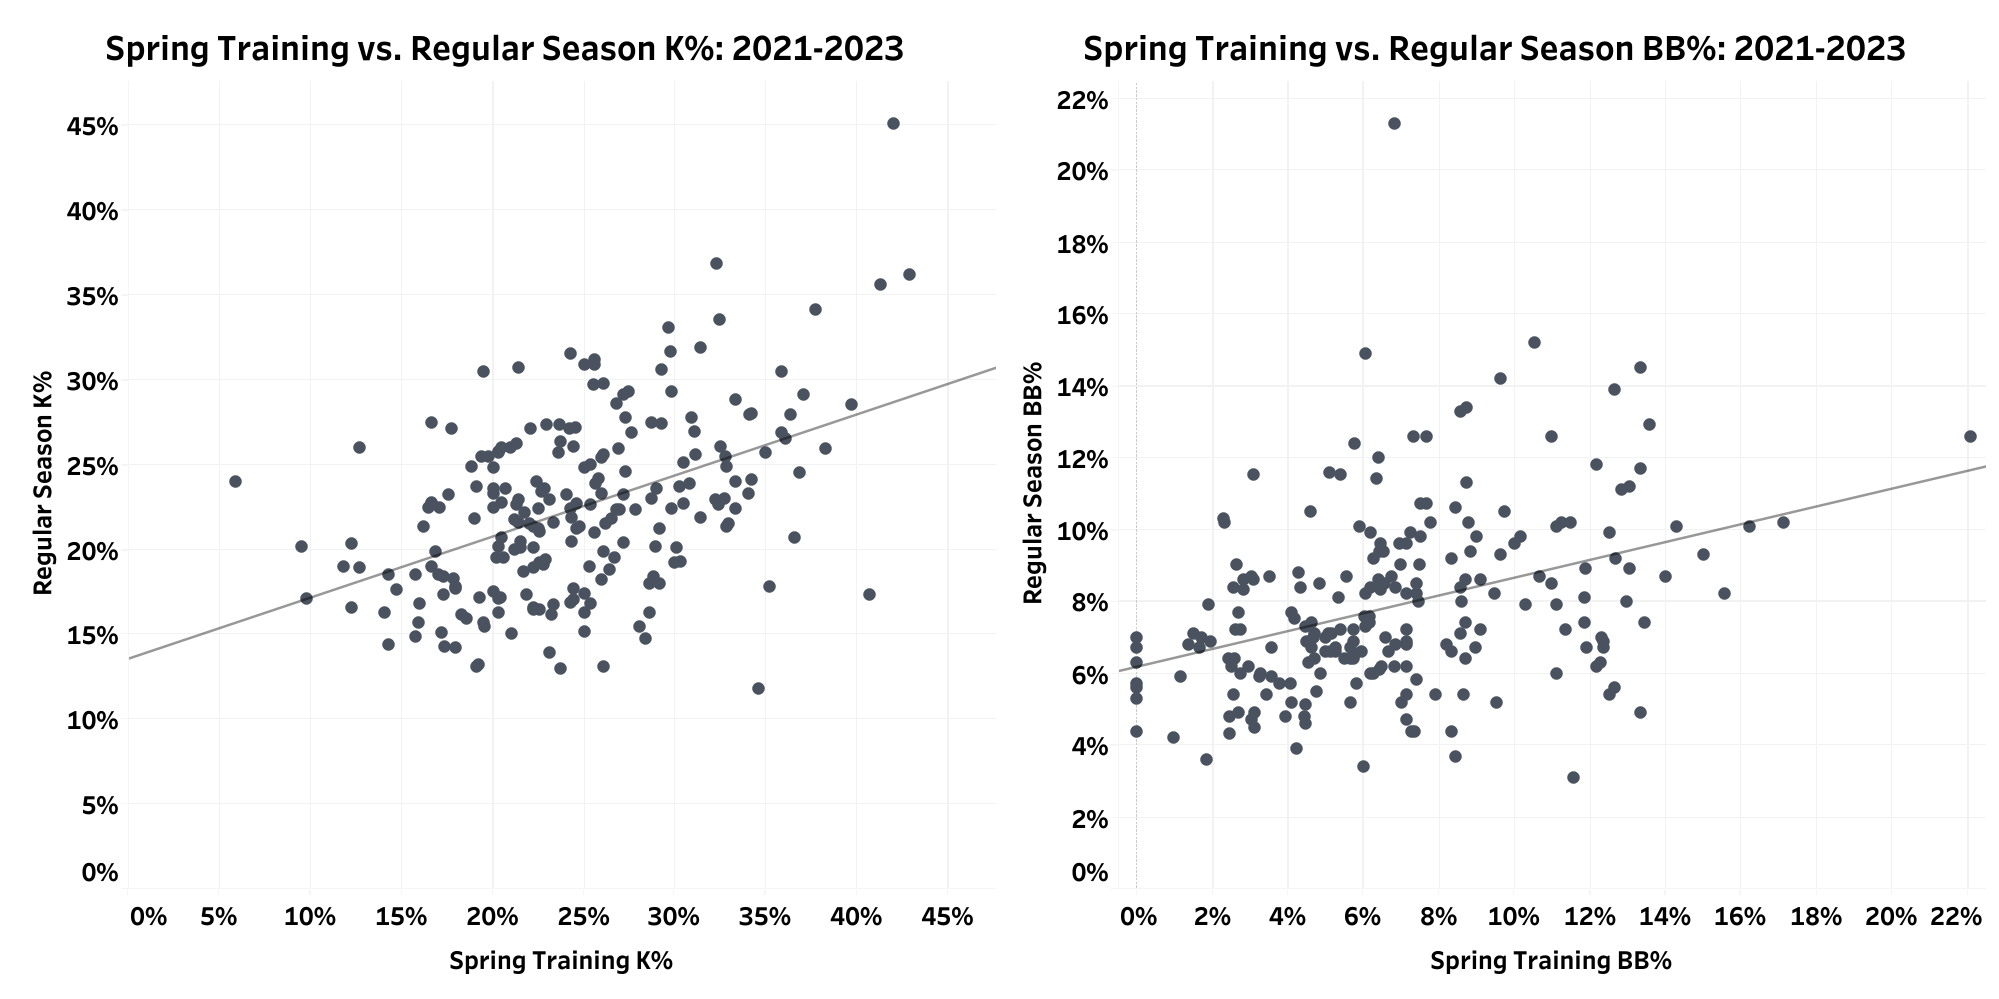
Strikeout rate has a .21 r-squared, a stronger relationship than the .14 r-squared for walk rate. Combining the two in K-BB% results in a .17 r-squared value. This means early strikeouts are more valuable for pitchers, as it’s harder to miss bats, and this skill is more consistent from Spring Training to the regular season.
Hitting Stats
On the hitting side, barrel rate has some of the strongest predictive power among hitting statistics. However, it’s quite the opposite when used with Spring Training data. This is due, in part, to the messier data. Statcast data has only been available in some ballparks, which makes the player population smaller. 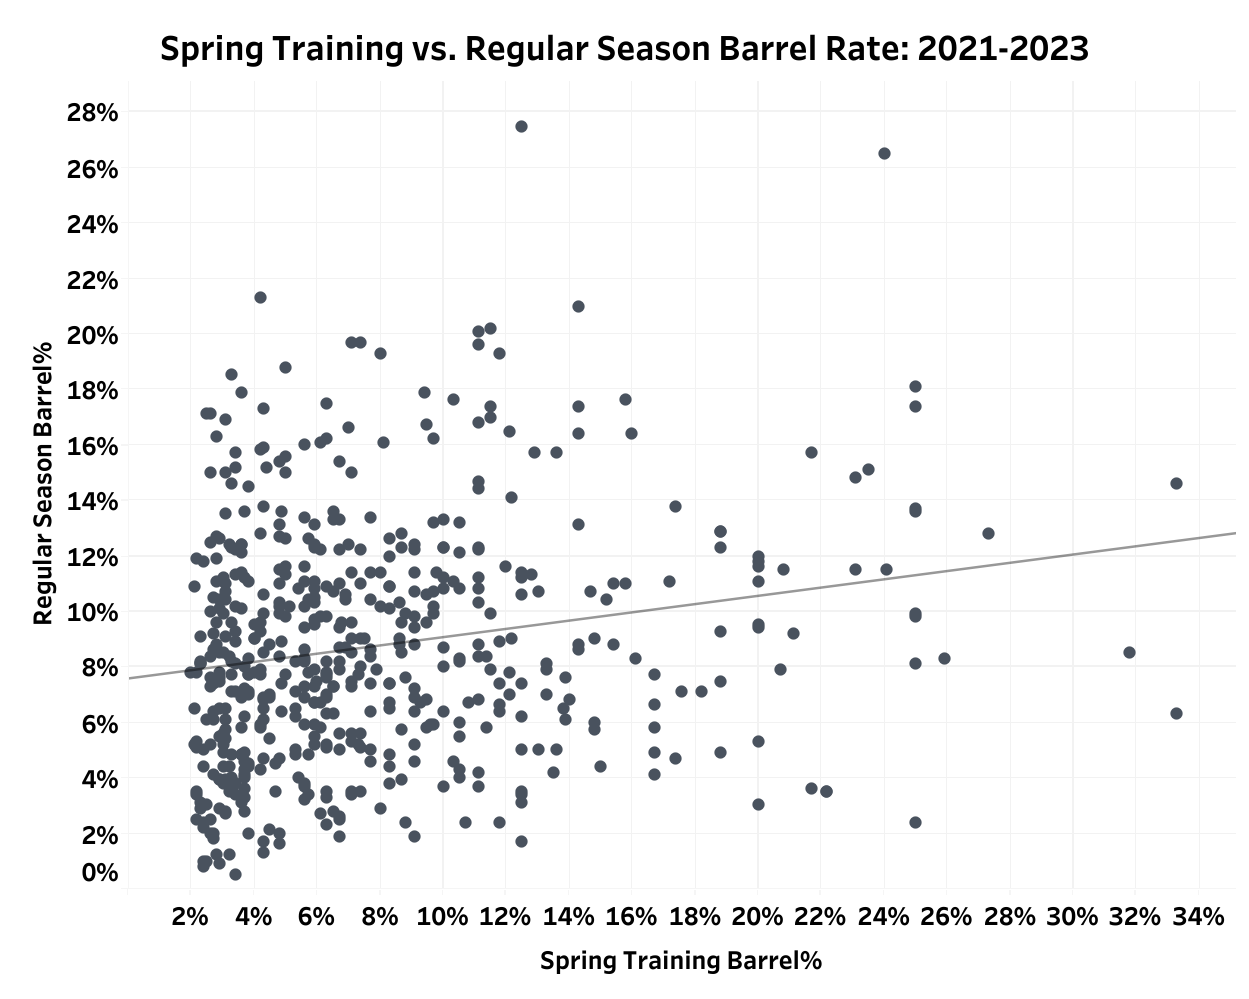
There’s virtually no correlation between barrel rate in Spring Training and the regular season. There are such few barrels in Spring Training that there’s high variance among specific players. Interestingly, the average barrel rate for the population is nearly identical: 8.0% in Spring Training and 7.8% in the regular season.
Moving on to strikeouts and walks, we have meaningful results for hitters.
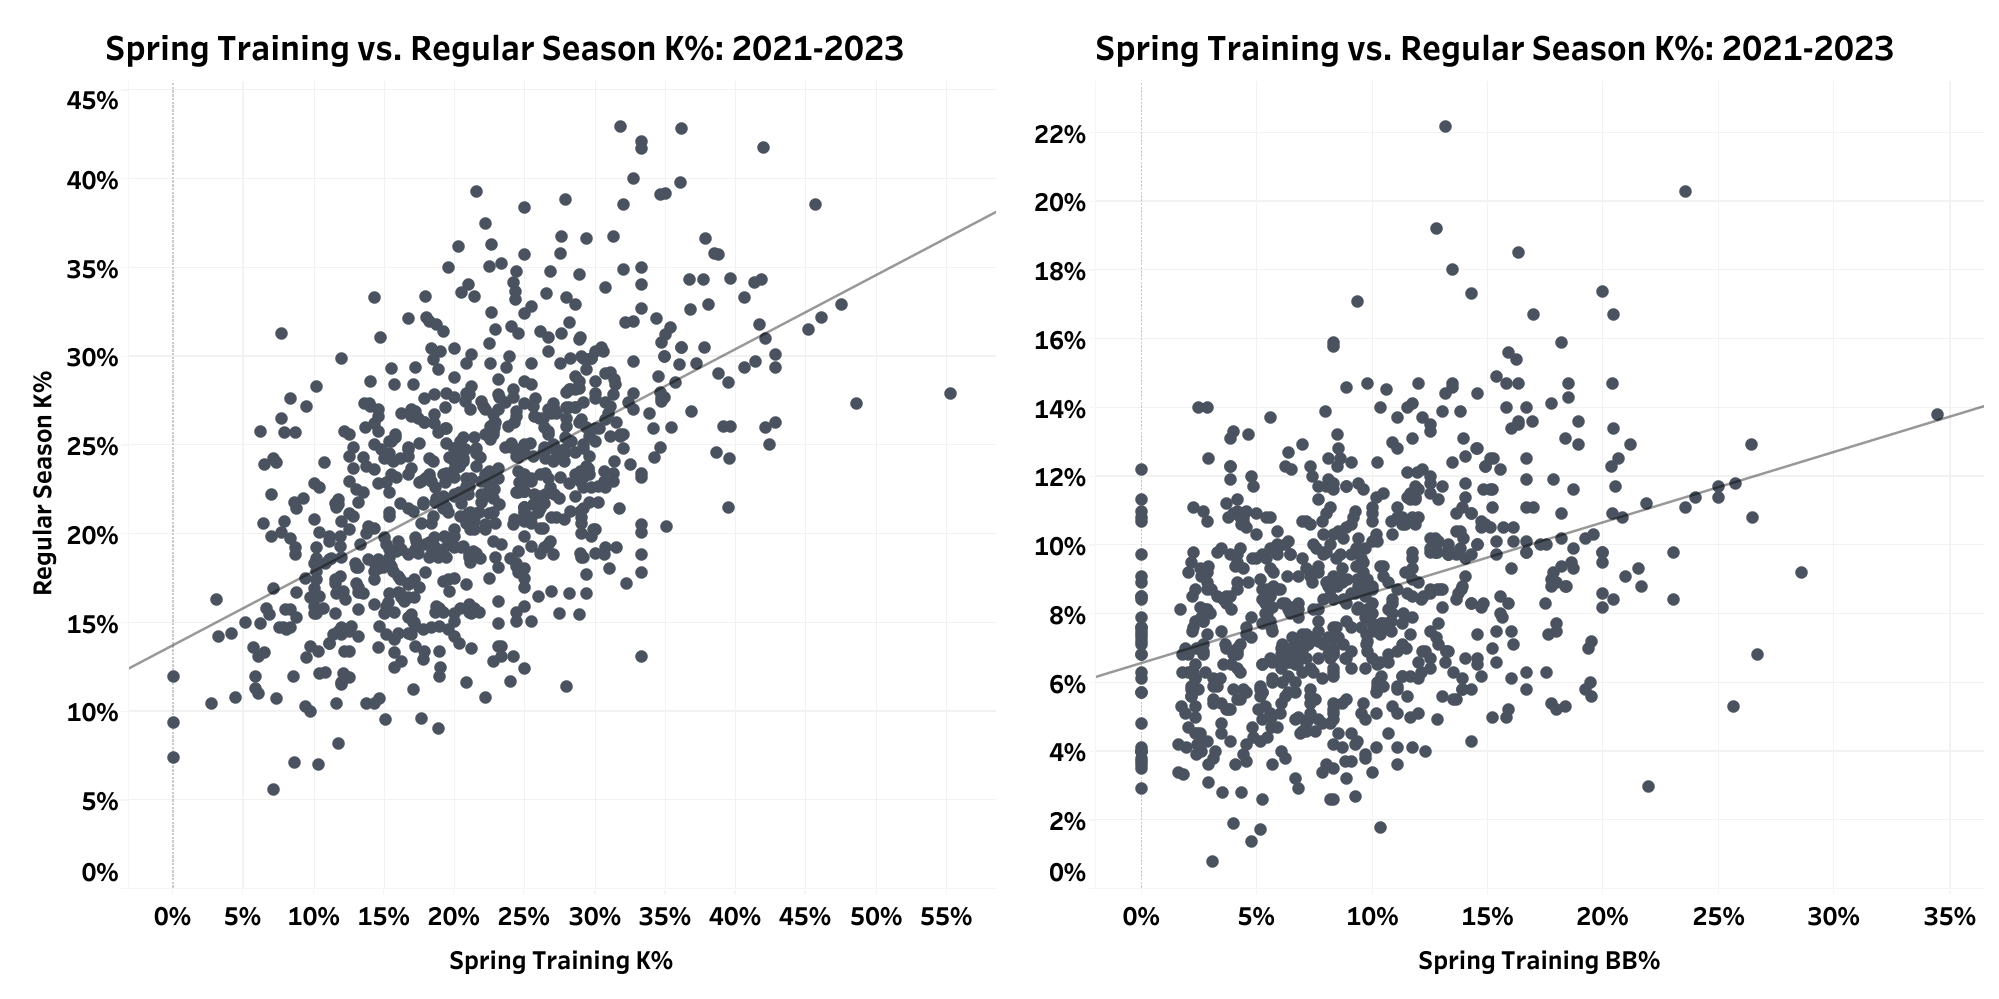
Walk rate has an identical relationship for hitters as it did pitchers, and strikeouts are more powerful for hitters too. However, strikeout rate is much more important for hitters than for pitchers. The hitting strikeout rate has a .31 r-squared value compared to .21 for the pitching strikeout rate. Should we just ignore Mike Trout’s 37.5% K% in Spring Training? Probably not!
When analyzing Spring Training box scores, strikeouts and walks are the most crucial stats to watch. Most other averages barely stabilize by the end of the season, if at all. Changes in strikeout and walk rates in Spring Training can indicate skill changes for the upcoming season and even suggest that a player has made more under-the-hood changes than we can see now.