


As I’ve been evaluating hitters over the course of this offseason, one thing I’ve found myself coming back to is fly ball distance, pulled fly balls, and expected slugging, or more simply, xSLG. It started when I first evaluated Rowdy Tellez and saw that he was ahead of some notable names in terms of xSLG, and I wanted to find out why. Then, I noted that Willie Calhoun does a lot of damage when he pulls the ball, which is one of the most positive outcomes a batted ball can have. Next, I assessed Mike Yastrzemski and noted that his power wasn’t likely to be a fluke because he hits the ball super far. Most recently, I took a look at Byron Buxton and noted the reasons why I felt the difference between his actual and expected slugging numbers are one of my big concerns about his future offensive output, and that one reason why that could be is that he doesn’t hit his fly balls all that far.
The purpose of this isn’t just to plug my previous posts, but I just wanted to note that this is something that has become one of my biggest areas of interest when evaluating hitters. It’s easy to just go on a player’s Baseball Savant page and look at how their slugging compares to their xSLG, and make a judgment that his actual slugging mark is either going to regress or surge, based on everything else being equal. Instead, I really want to try and drill down and see what makes a hitter’s expected numbers either lag behind or come ahead of their actual ones. That’s why I was especially thankful to be scrolling through Twitter one day to see a thread by one of the best sabermetricians of all time, Tom Tango, that started with this tweet:
There were 6757 HR that were tracked in 2019 (reg+post). There were 6751 batted balls that went for over 383.7 feet.
Here’s how that looks at the player level.
Bregman and Garnder had 13 more HR than long flyballs, while Meadows had 12 fewer. The reasons would be as you’d… pic.twitter.com/de6xuPM1oe
— Tangotiger (@tangotiger) February 28, 2020
The whole thread is worth a read, but what really jumped out at me at first, was how much Alex Bregman stands out when looking at how hitter’s home runs compare to their long-distance fly balls. Bregman is a fascinating case to me, because he was the runner-up for the AL MVP, but as I’ve scrolled through so many leaderboards this offseason, I haven’t exactly seen him towards the top of many Statcast-related ones. Other than his 90th percentile xwOBA, which factors in his strong plate discipline, a lot of his Statcast metrics aren’t all that impressive. For instance, the metrics in the following table:
| AVG EV | Hard-Hit% | Barrel/BBE% | Sweet Spot% | xSLG | |
|---|---|---|---|---|---|
| 89.3 | 37.5 | 5.4 | 36.5 | 0.471 | |
| Rank (out of 273) | 121 | 159 | 205 | 89 | 97 |
These don’t exactly look like the numbers you would expect from a hitter who posted the .296/.423/.592 slash line that Bregman posted in 2019, especially when compared to the actual MVP, Mike Trout. That’s not to say that Bregman is some scrub, but it was curious knowing Bregman’s Statcast metrics and seeing that he had so many more home runs than his long-distance fly balls would suggest he deserved. I figured that there had to be more cases of this in the 2019 season, and that this could perhaps explain some things about some hitters. My guess is that there are some hitters who may have underperformed based on how many long fly balls they hit, some who overperformed, and just some overall mashers that I wanted to highlight. This simple metric of “long fly balls” may explain some discrepancies between actual and expected slugging, and perhaps unearth some gems who may be flying under the radar. This look is going to be two parts. The first will feature a more general overview about why I feel long fly balls an important metric, and the second will highlight some notable hitters who may be in line for a power surge or an outage this season, based on their long fly ball rate. First up though, an introduction.
Long Fly Ball Rate: An Introduction
Before we get into the juicy details, let’s first define what a “long fly ball” is. For the purposes of this research, I have defined a long fly ball as a fly ball that traveled at least 380 feet per Statcast. For context, on average in 2019, a hitter had around 68% of their home runs come from long fly balls, with the leader, Ronald Acuña Jr., having 95% of his home runs come from long fly balls. Long fly balls are also extremely more valuable in terms of wOBA compared to all fly balls, evidenced by the table below:
| Year | wOBA on Long Fly Balls | wOBA All Fly Balls |
|---|---|---|
| 2015 | 1.476 | 0.317 |
| 2016 | 1.472 | 0.374 |
| 2017 | 1.568 | 0.473 |
| 2018 | 1.550 | 0.457 |
| 2019 | 1.604 | 0.522 |
Looking at the results among all hitters in each of the five seasons of the Statcast era, we can see how much better the results are on long fly balls compared to all fly balls. We also see the offensive explosion that has taken place in recent years, as the wOBA on all fly balls in general has increased by over 60%. But for the most part, even in an offensive environment that was tamer in 2015 and 2016, long fly balls have been extremely productive, getting even more so in 2019 thanks in part to a juiced baseball.
Getting into more of the nitty-gritty details, let’s compare long fly balls to total home runs. Take a look at the following graph:
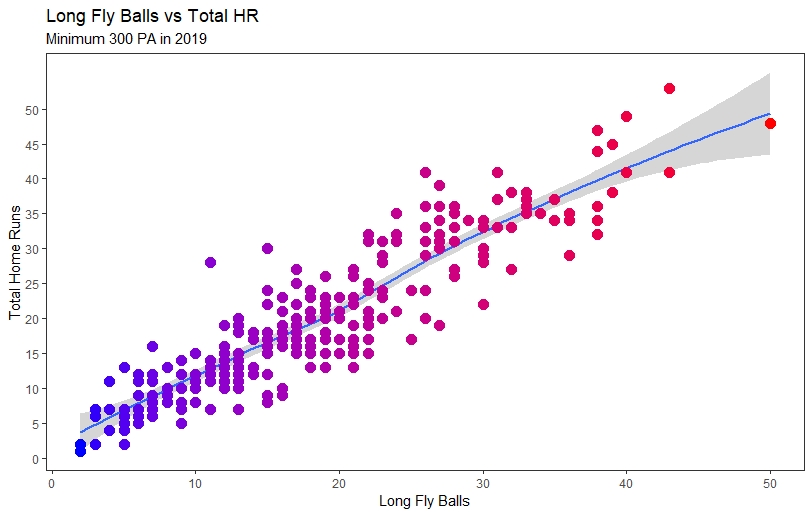
This graph more or less reflects the graph in Tango’s original tweet from up above. From this graph, it appears that long fly balls are a pretty good indicator of total home runs, and that is true, with an R-squared of .82, which should not be a surprise because chances are, if a hitter hits the ball that far consistently, they’ll have a lot of balls that clear the fence. We already know that average fly ball distance is one of the best indicators of power, so it’s not shocking that long fly balls are also a strong indicator of power. It’s also pretty consistent with the averages in this group, as the average amount of long fly balls hit by the 271 hitters with at least 300 plate appearances in 2019 is around 18.5, while the average amount of home runs hit by this group is around 20.3, which further shows that long fly balls should be a good source of home runs.
You’ll also see from this graph, that there are quite a few hitters that stand out as having quite a few more long fly balls than home runs, and vice versa. We can evaluate those over or underperformers using a handful of additional metrics, including HR/FB%, and Pull% to evaluate why they may be considered over or underperformers based on their long fly balls. That’ll come in the second part of this analysis. First off though, I want to take a look at the overall leaders in long fly balls, and what we can learn from the hitters who were the absolute best in this department from a season ago.
Long Fly Ball Rate: The Overall Leaders
Now we’re getting into the fun stuff. It’s time to start evaluating players, and first up are the hitters that mashed long fly balls at the highest rates. Here’s a link to the full leaderboard, but for now, here are the top-10 hitters from 2019 with the highest long fly balls rates:
| Player | Long FB | Total FB | Long FB % | Total HR |
|---|---|---|---|---|
| Miguel Sano | 35 | 72 | 48.6% | 34 |
| Jorge Soler | 50 | 115 | 43.5% | 48 |
| Garrett Cooper | 18 | 46 | 39.1% | 15 |
| Nelson Cruz | 31 | 81 | 38.3% | 41 |
| Franmil Reyes | 35 | 92 | 38.0% | 37 |
| Matt Adams | 22 | 58 | 37.9% | 20 |
| Pete Alonso | 43 | 118 | 36.4% | 53 |
| Christian Yelich | 38 | 105 | 36.2% | 44 |
| Josh Donaldson | 33 | 93 | 35.5% | 37 |
| Trey Mancini | 33 | 96 | 34.4% | 35 |
| League Average | 18.5 | 84.5 | 21.2% | 20.1 |
Don’t worry, I’m going to touch upon maybe the biggest surprise of this group in Garrett Cooper in the second part of the analysis. Matt Adams is another surprise, but if there’s one thing that he’s good at these days, it’s in the power department. He still hit 20 home runs in 2019 in just 330 plate appearances and had a .239 isolated power mark. Not too shabby at all, but that’s about all you get from Adams these days. Other than that, there’s nothing overly surprising about the rest of these eight names. It shouldn’t be much of a shock to see Miguel Sano and last year’s American League home run leader Jorge Soler at the top, but seeing Sano as the clear cut leader by over 5 percentage points is really nice to see. Not far past these ten hitters, there are some other great names such as JD Martinez, Eugenio Suarez, Acuña, Trout, and — one of my favorite names to see — Yastrzemski all inside the top 25.
One thing I noticed about a lot of the hitters that were towards the top of this leaderboard was that a lot of their home runs were not of the pull-type. I calculated the Pulled-HR rate of each hitter and saw that there were very few hitters inside the top 50 who were a great deal above the league-average in terms of Pulled-HR rate, and if they were above average, it was only by just a touch. Take, for instance, the Pulled-HR rates of the hitters inside the top-10:
| Player | Long FB | Total FB | Long FB % | Pulled HR | Total HR | Pulled HR % |
|---|---|---|---|---|---|---|
| Miguel Sano | 35 | 72 | 48.6% | 21 | 34 | 61.8% |
| Jorge Soler | 50 | 115 | 43.5% | 30 | 48 | 62.5% |
| Garrett Cooper | 18 | 46 | 39.1% | 6 | 15 | 40.0% |
| Nelson Cruz | 31 | 81 | 38.3% | 18 | 41 | 43.9% |
| Franmil Reyes | 35 | 92 | 38.0% | 10 | 37 | 27.0% |
| Matt Adams | 22 | 58 | 37.9% | 17 | 20 | 85.0% |
| Pete Alonso | 43 | 118 | 36.4% | 25 | 53 | 47.2% |
| Christian Yelich | 38 | 105 | 36.2% | 20 | 44 | 45.5% |
| Josh Donaldson | 33 | 93 | 35.5% | 14 | 37 | 37.8% |
| Trey Mancini | 33 | 96 | 34.4% | 9 | 35 | 25.7% |
| League Average | 18.5 | 84.5 | 21.2% | 11.8 | 20.1 | 60.3% |
Adams is the only hitter in this group to be so extreme with his pulled home runs. While this on its own maybe doesn’t mean that much, I do find it interesting that the top hitters in terms of long fly ball rate generally don’t pull the majority of their home runs. I’m also extremely fascinated by Franmil Reyes, as someone with as much power as he does is not exactly expected to be a hitter who sprays the ball to all fields. To further add to that fascination. his 32.2% pull rate in 2019 was among the lowest last season. Take a look at his spray chart, and you’ll see what I’m talking about. That’s a lot of home runs to the center and opposite field, and with power like that, he’ll remain a player I’m very interested in for a while, but that’s a post for a different time.
The point of this though isn’t to ooh and aah over how well Franmil spreads his home runs out. I think it is notable though that the majority of hitters in the top 50 in long fly ball rate don’t pull their dingers much more than the average, or do so at a rate that is below average. You expect hitters that hit the ball consistently far to have a good xSLG, which is the case for the majority of the hitters in the top 50 in long fly ball rate. The average xSLG in 2019 of all hitters with at least 300 plate appearances from a season ago is .450. There are only three hitters inside the top 50 that have a below-average xSLG: Brandon Dixon (.442), Jonathan Schoop (.439), and Ryan McMahon (.429). This would lead me to guess that hitters who can consistently hit long fly balls will generally have a better xSLG, which makes sense, since further hit balls generally get better results. While the correlation coefficient of .53 isn’t the strongest, it is still significant. Here’s a graph showing how long fly balls relate to xSLG:
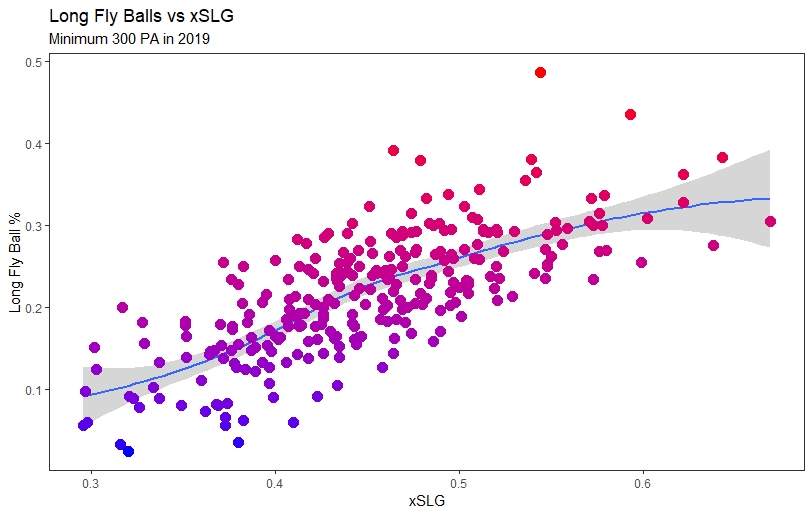
You can see that there are some extreme cases, but there is a nice big cluster that exists right around where the smoothing line suggests that they should be, but it’s not all about the correlation coefficient. What I think is more significant are the differences in xSLG between the hitters who hit the most Long Fly Balls, and the hitters who hit the most pulled home runs. Take a look at the following table:
| Top 50 in Long Fly Ball % | Top 50 in Pulled HR % | |
|---|---|---|
| xSLG | 0.522 | 0.397 |
You see how drastic the difference is. The average xSLG of the hitters in the top 50 in long fly ball rate is .522, which is equivalent to the actual slugging mark of Marcus Semien in 2019. Meanwhile, hitters inside the top 50 in pulled home run rate have an xSLG that is roughly equivalent to Alex Gordon’s actual slugging mark from a season ago.
You might be thinking though: “That’s just xSLG, of course the hitters who hit the ball hard and far will look more favorable in terms of xSLG!” You aren’t wrong. Balls hit hard and far have a better expected hit probability, and that is a big part of what makes up xSLG. If you prefer the actual results, that’s fine, I got that covered too. Take a look at the same table as the one previously, using actual slugging numbers, but this time, let’s include out to the hitters in the top-150:
| Interval | Long Fly Ball % Leaders | Pulled HR % Leaders |
|---|---|---|
| Top 50 | 0.532 | 0.421 |
| Top 100 | 0.503 | 0.437 |
| Top 150 | 0.495 | 0.452 |
Not only is the actual slugging for hitters in the top 50 to 150 in long fly ball rate much better than the ones for pulled home run leaders, but the actual slugging for hitters in the top 50 in long fly ball rate is higher than their expected one. For additional context, a hitter in the top 150 in long fly ball rate slugs at a rate that is in between Kyle Schwarber on the high end and Michael Conforto on the low end. If you do the same exercise for the hitters in the top 150 in pulled home run rate, you’ll get a hitter that is in between Daniel Murphy (the 2019 version) on the high end and Jackie Bradley Jr. on the low end. I know which range I prefer.
So, does that mean that it’s bad to pull the ball? No, not at all. Hopefully the above shows just how valuable long fly balls can be, and that the hitters who hit them consistently, usually get not just the better expected stats, but the more important actual ones. But, no it is not bad to pull the ball and I’m not here to start the “pulled balls are bad” movement. Pulled fly balls are still one of the most optimal results a hitter can achieve in terms of isolated power. However, it is notable that out of the top 50 hitters by pulled home run rate, only 12 have expected slugging marks that are greater than the .450 league average. I’ll get into some of the more specific cases when we look at some of the notable over performers, but for now, let’s keep talking a bit more generally.
Why would there be so many hitters with a lot of pulled home runs but poor expected slugging numbers? Well, for one thing, hitters do not necessarily have to hit the ball all that hard or far to get a pulled home run, something that I know all too well as someone who watched nearly every single plate appearance by Brett Gardner in 2019. See this example from 2019 off the bat of Gardner to see exactly what I’m talking about:
It’s hit plenty high, but it ends up in the first or second row of the outfield seats. It all counts the same, but this is pretty close to the definition of a Yankee Stadium cheapie. That’s a good batted ball for Gardner’s home run total, but not exactly for his xSLG. Would it surprise you to learn that Gardner has a 78.6% pulled home run rate, which puts him inside the top 50, but he also has a .372 xSLG and an extremely low 13.8% long fly ball rate? Hitting a lot of pull-side home runs is a great way to set career highs in both slugging and total home runs at the ripe age of 36.
Gardner is an extreme case, sure, but the point is that while pulling home runs isn’t bad, it doesn’t always do much in the expected stats department. Of course, if a hitter can continue to keep pulling the ball, or keep playing in a friendly offensive environment (or in Gardner’s case, both!), then they should be able to keep beating their xSLG. It should also be noted that out of the top 50 hitters in pulled home run rate, that only eleven had xSLG numbers that were better than their actual ones, and there are many where the difference is just by the slightest margin, such as Albert Pujols (.433 xSLG vs. .430 actual) and Brian Dozier (.432 xSLG vs. .430 actual). The bottom line should be that, if you want hitters who should consistently hit a lot of home runs, long fly balls should be one of the better indicators. Again, it’s not that hitting a lot of pull-side home runs is a bad thing, but hitting a lot of pulled home runs could be a major explanation for differences between actual and expected slugging.
Overall though, it should be clear that long fly balls are more than just an obvious metric that correlates well with home runs. Yes, long fly balls will lead to more home runs, but hitters who consistently hit more long fly balls won’t have to rely on a steady stream of pulled home runs, which while not inherently bad, aren’t always the best indicators of solid contact. The best hitters in terms of long fly balls generally have much more solid stat lines than those who struggle to hit many of them, and should be seen as surer things, at least in the power department.
That wraps up this first part of this analysis, which was more of a prolonged introduction. In the next part, we’ll take a closer look at some hitters, who based on their long fly ball rate, maybe didn’t quite deserve as many home runs as they actually hit in 2019, not just by using long fly ball rate, but also by incorporating a few other metrics such as overall average fly ball distance, and home run per fly ball rate. Finally, to end on a more positive note, we’ll look at some more specific hitters who may be in line for a power surge based on their long fly ball rate. I teased out Garrett Cooper earlier, and while he is one, he still isn’t quite the most glamorous hitter that’ll get a lot of people excited. We’ll look at the more glamorous types which we all prefer in that section too.
Photo by Nick Wosika/Icon Sportswire | Adapted by Justin Paradis (@freshmeatcomm on Twitter)
