


In perusing the exit velocity and barrels leaderboard the other day, something caught my eye.
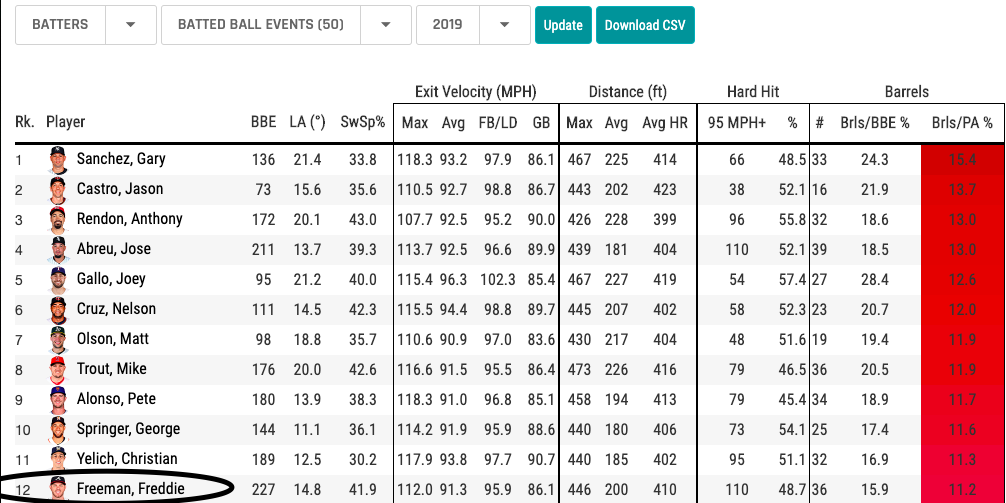
I remember thinking last year that Freddie Freeman wasn’t the power threat he was billed to be in years prior. For starters, he only hit 23 homers in 707 PAs last season with a .196 ISO and .505 SLG. So what changed? And how does Freeman have 19 homers already in less than half the PAs?
Mostly, I write about buy lows and sleepers. But today, I’m doing something a little different. Whenever a hitter makes an adjustment it’s notable, even if you can’t go scoop him off the waiver wire.
Freddie Freeman in Three Parts
For simplicity’s sake, I’ll start Freeman’s story in 2016. To be sure, he had productive seasons with the Braves before, but several of those pre-2016 seasons are similar to either 2016, 2017, or 2018 anyway.
| Season | PAs | HRs | AVG | OBP | SLG | wOBA |
| 2016 | 693 | 34 | .302 | .400 | .569 | .402 |
| 2017 | 514 | 28 | .307 | .403 | .586 | .407 |
| 2018 | 707 | 23 | .309 | .388 | .505 | .378 |
| 2019 | 322 | 19 | .311 | .401 | .593 | .411 |
In 2016 and 2017, Freeman mashed baseballs with no resulting loss in batting average or OBP. By wOBA, he was one of the best hitters in baseball. Indeed, he managed 28 homers in 2017 in just 514 PAs. Yet in 2018, there was a steep decline in power. Freeman still hit for average and got on base at an elite clip, but he only swatted 23 homers in 707 PAs. Hence my initial skepticism of Freeman’s raw power.
Now, Freeman’s back to mashing baseballs, and with 19 homers in just 322 PAs he’s on pace to eclipse his career high from 2016. His AVG, OBP, SLG and wOBA all look like the Freeman from 2016-17. But is it that simple? Is he just that guy again?
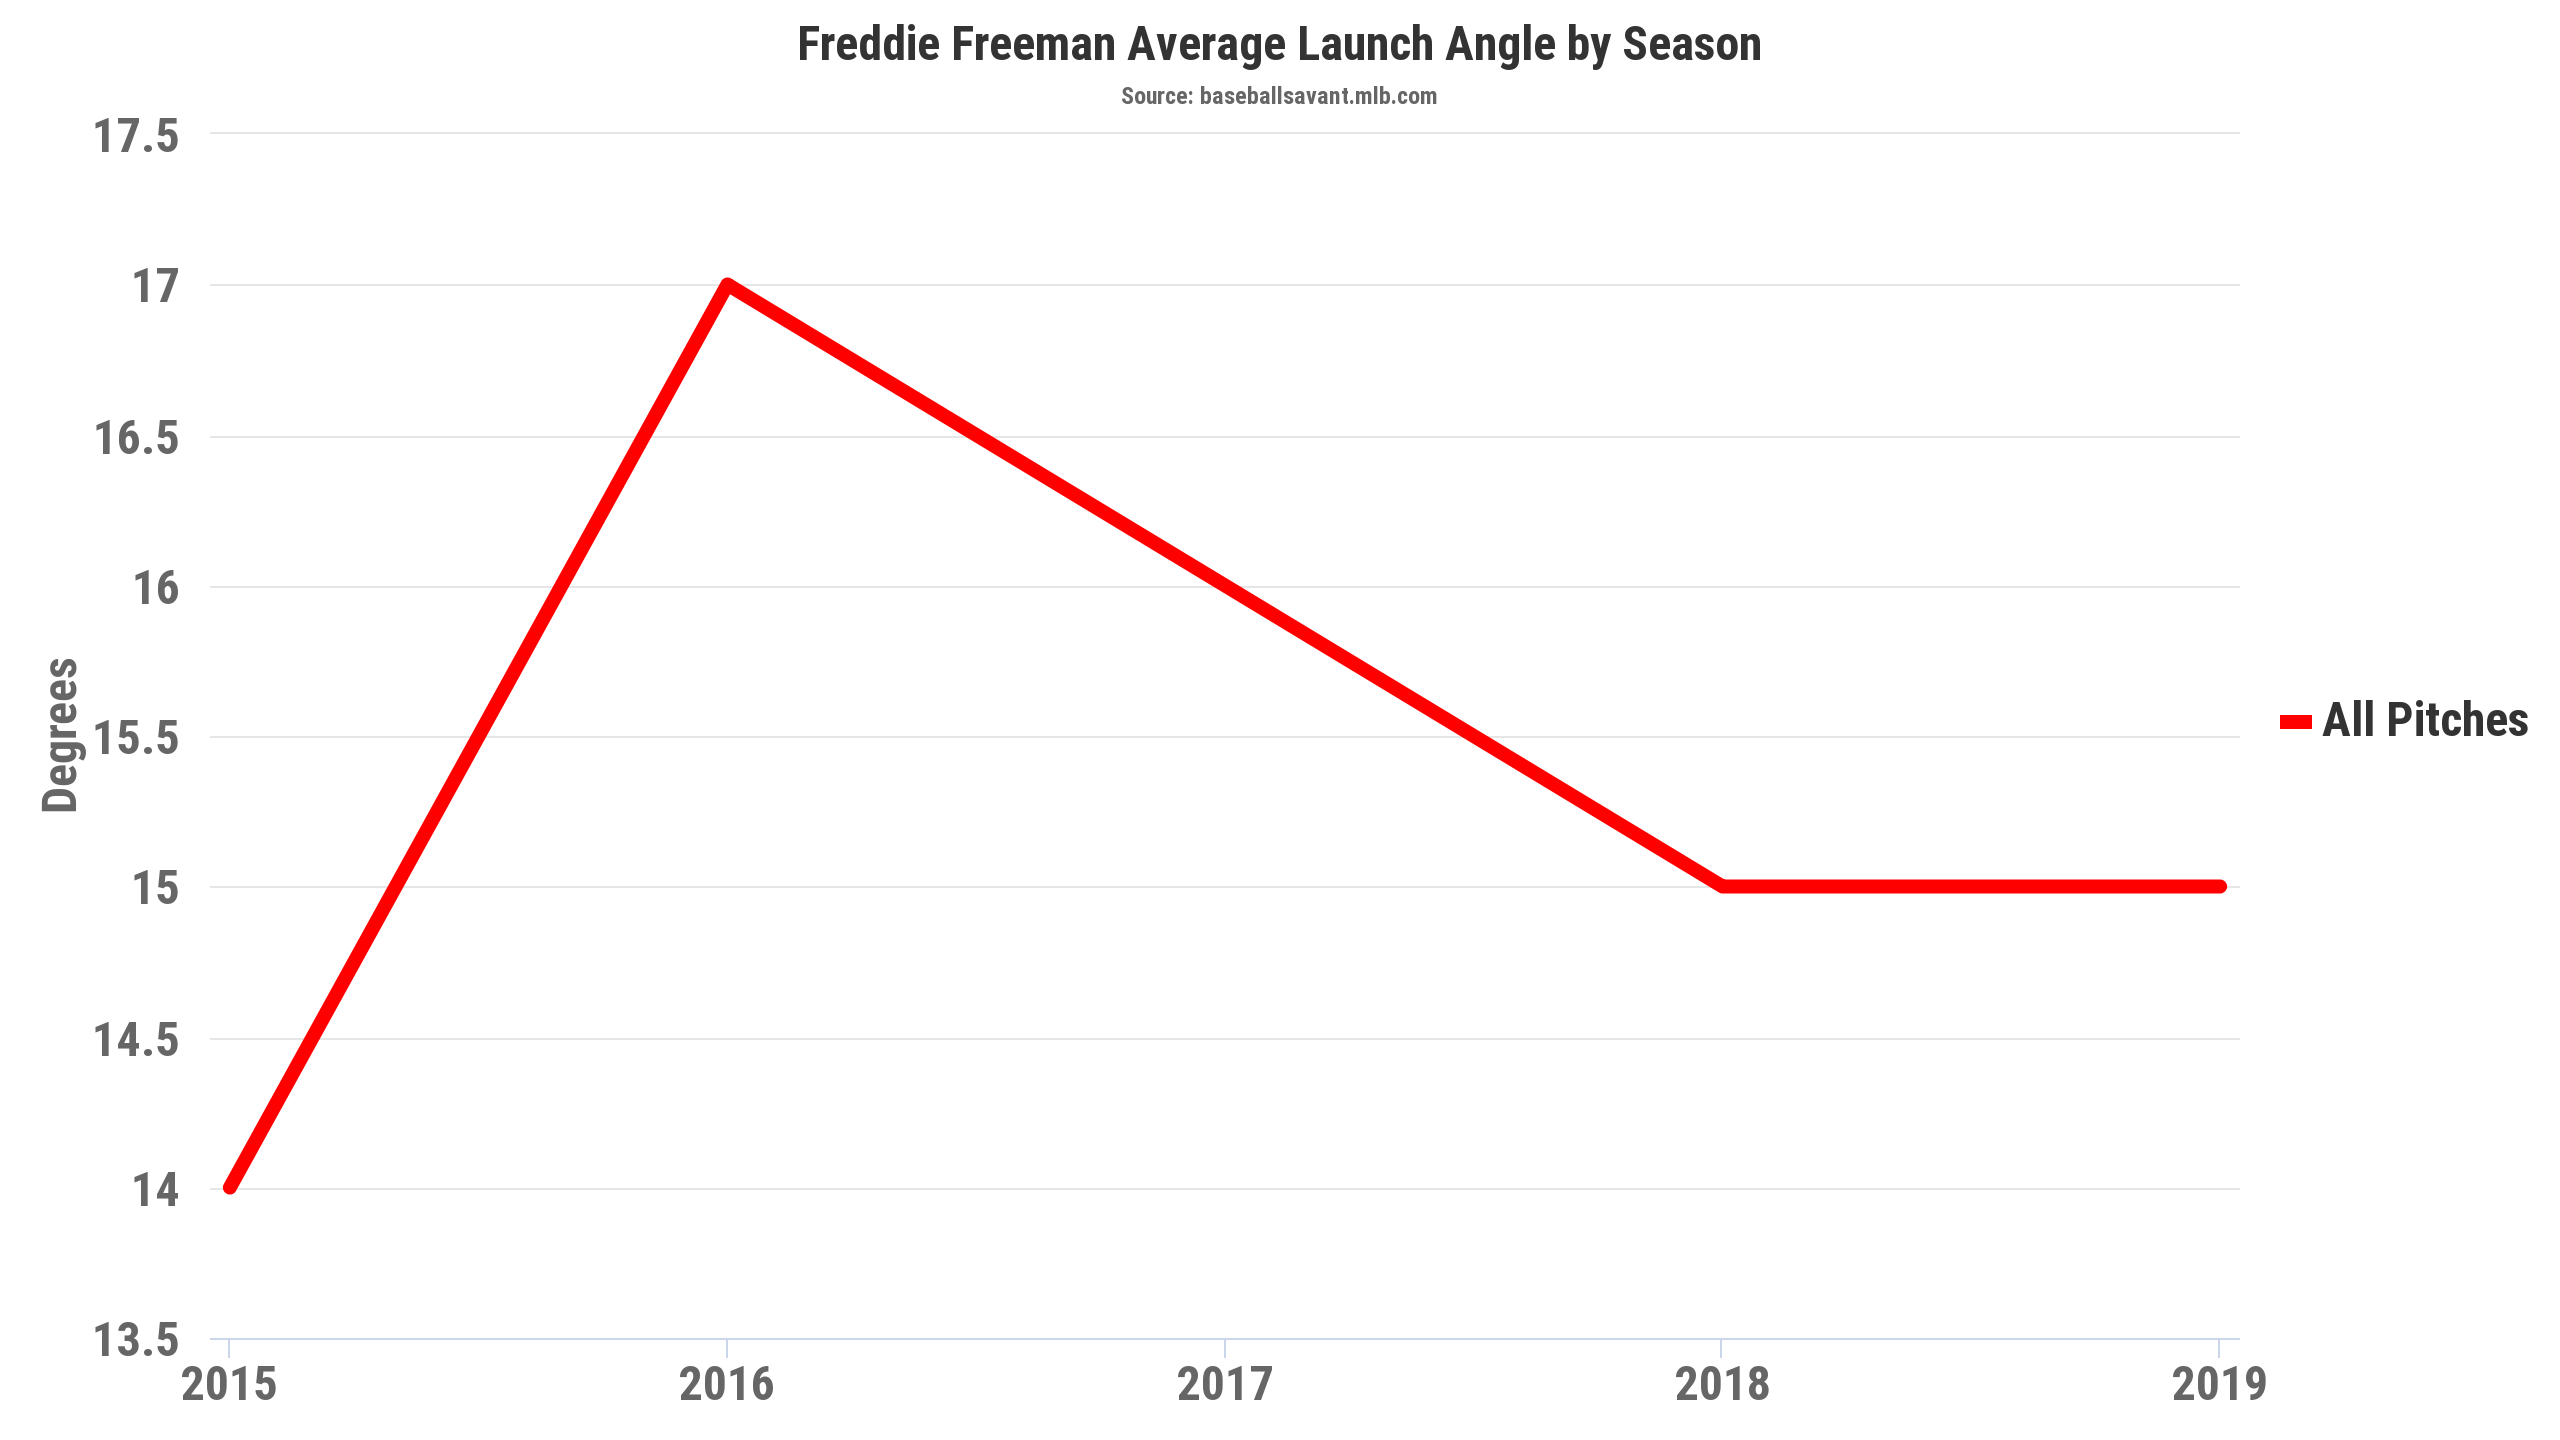
Nope! It’s never that simple. You can easily tell Freeman’s elevating less than in 2016 and 2017, but somehow he’s back to hitting bombs at a torrid pace. Let’s dive deeper into Freeman’s batted ball profile, courtesy of Baseball Savant’s batted ball classifications. As a brief aside, prospectively, I’ll be making the jump because Baseball Savant’s batted ball classifications are better than Fangraphs’. For instance, if we want to know whether a hitter is elevating for power, it’s best to look at Baseball Savant’s fly ball rate, which separates pop-ups into their own category unlike Fangraphs’ FB% (which includes infield fly balls).
| Season | GB% | FB% | LD% | Pull% | Pulled FB+LD% |
| 2016 | 31.9 | 27.9 | 35.2 | 35.0 | 12.3 |
| 2017 | 36.3 | 33.1 | 27.7 | 34.0 | 9.7 |
| 2018 | 37.0 | 24.0 | 35.4 | 39.0 | 13.3 |
| 2019 | 35.7 | 26.9 | 33.5 | 39.6 | 13.4 |
Back to Freddie Freeman:
- In Act I, we see Freeman hitting a combined 63.1% fly balls and line drives in 2016 and 60.8% in 2017. He sprays to all fields.
- In Act II, Freeman dips under 60% combined in 2018, with a heavier emphasis on line drives than fly balls and an increased pull rate.
- This year in Act III, Freeman has traded a few line drives and ground balls for fly balls, but is otherwise pretty similar to 2018. He continues to pull the ball often.
Freeman’s pulling fly balls and line drives at basically the same rate as last season. Based on batted ball profile alone, he should be in the midst of the same power drought that plagued him in 2018. Nonetheless, I’ve entitled this “Act III” with good reason. Read on good people of Pitcher List.
Pulling Back the Curtain
As of now, we’re left with a cliffhanger. How is Freeman generating more power despite maintaining the same launch angle and pulled FB+LD%? Maybe Freeman’s doing something different other than joining the fly ball revolution.
I found some great camera angles that make it easy to spot the changes Freeman has made to his approach.
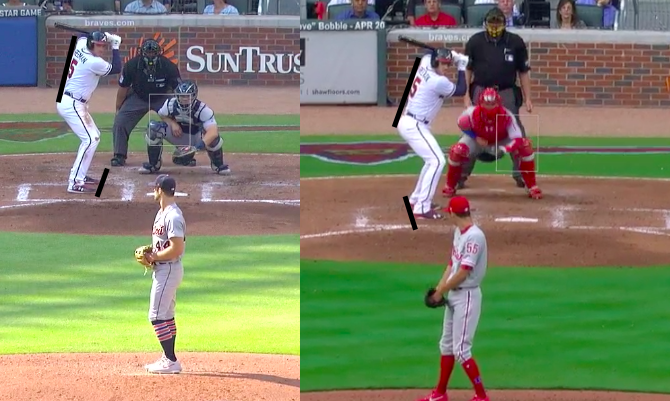
The first image is from early June 2019, and the second is from March 2018. I see two changes. First, Freeman’s front foot has moved back to be square with his body.
Opening up one’s batting stance is associated with higher pull rates. You’re sitting back, so you can get earlier to the ball, which is conducive to pulling the ball. Whereas in a closed stance, you’re generally going to be later to the ball (because you’re turned away) and, as a result, reaching the ball deeper in the zone. That’s why hitters with closed stances go the opposite way with ease.
Still, as noted above, despite opening up his stance Freeman isn’t pulling the ball more than last season.
Freeman is leaning into his swing slightly less and standing a little taller in the box. This change is harder to spot. I’ve drawn lines for you, but if you don’t want to cheat, look at his front thigh in the second image. Its bend is more pronounced because he’s squatting slightly lower. It’s possible this is the result of closing his stance. Or perhaps standing taller is deliberate in it of itself.
Whatever the cause, as I noted in an article last summer with respect to Eugenio Suarez’s change in stance:
“This year, Suarez is standing taller in the batter’s box, which is significant to his newfound power. When you’re leaning over, you fall into your swing, forcing your body to slow itself down in order to regain balance, and diminishing your bat speed.”
The change in batting stance was more pronounced in Suarez’s case, but the logic still applies here. To the extent Freeman is doing a better job of staying upright, he may have improved his bat speed.
Bat speed is one of those metrics that teams keep close to the vest. However, there are some proxies. First, we can see how Freeman’s faring against heaters.
| Season | xBA | xSLG | xwOBA |
| 2016 | .328 | .684 | .460 |
| 2017 | .302 | .614 | .419 |
| 2018 | .318 | .599 | .417 |
| 2019 | .336 | .733 | .481 |
Suddenly, in Freeman’s age 29 season, he’s doing an incredible job catching up to fastballs (.733 xSLG!). Whether that’s the result of standing taller in the box or something else, it’s certainly evidence of quicker bat speed. He’s an even better fastball hitter than in his magical age 26 season in which he hit 34 home runs. Indeed, those are career-highs in each of xBA, xSLG and xwOBA on fastballs.
Moreover, Freeman’s power metrics have blown away his historic peripherals:
| Season | Exit Velocity on FB/LD | Hard Hit% | Brls/BBE% |
| 2016 | 95.6 mph | 44.7 | 13.7 |
| 2017 | 93.8 mph | 42.1 | 13.3 |
| 2018 | 93.7 mph | 39.8 | 9.3 |
| 2019 | 95.9 mph | 48.7 | 15.9 |
This season, Freeman’s destroying baseballs. Bear in mind that a barrel is a batted ball between 26 and 30 degrees smacked at 98 mph or greater. The launch angle band expands, however, as the hitter increases his exit velocity. Thus, even though Freeman isn’t elevating as well as 2016 and 2017 in which he maintained around 13.5 Brls/BBE%, he has nevertheless increased his barrel rate to an otherworldly 15.9% on the back of an elite 95.9 mph exit velocity on FB/LD and 48.7 hard hit rate. That’s because he’s hitting the ball harder, so even though he has fewer balls struck between 26 and 30 degrees, he’s hitting more balls above 98 mph to compensate for the difference.
And there’s another point for improved bat speed: Freeman is hitting the ball extremely hard this season, harder than in his prime age 26-28 seasons. His barrel rate has improved more than 50% over last year.
I’ll end by noting that, in my last article, I refined a new metric I called Predicted Home Runs (pHR). The goal was to determine what a player’s home run total should be at any point in the season given his output in certain metrics that best correlate with power. Suffice it to say, pHR buys Freeman’s power outburst, giving him 19.8 pHR on the season (slightly more than his current total of 19).
Conclusion
Maybe there’s an Act IV to this story, and Freeman keeps evolving as he has season-by-season. But for now, Freeman has found another way to hit for power beyond joining the fly ball revolution, which gives him multiple paths to success. If he loses some raw power, he can go back to 2016-17 and elevate more. If not, he can keep just doing what he’s doing. I’m hopeful that this version of Freeman lasts because it comes with less batting average risk, but versatility is perhaps Freeman’s greatest gift of all.
Photo by David J. Griffin/Icon Sportswire.
