


(Photo by Gerry Angus/Icon Sportswire)
Part I: Where There’s Smoak There’s Fire
Fantasy baseball is a game of finding value. You can draft Paul Goldschmidt in the first round and you can get locked in .300/.400/.550 with 30 HRs 15-20 SBs and 200 R+RBI. Goldschmidt is about as consistent as they come (although notable regression is to be expected with the humidor coming in and he may not even reach the line I mentioned above.). However, for someone trying to play the value game, I have a diamond here for you in the form of Justin Smoak. NFBC has his ADP currently around 150 when he really should be going about 100 picks higher.
Smoak burst on the scene last season with the Blue Jays, but he’s not getting any love in pre-season rankings and I cannot figure out why for the life of me. Yahoo has him at an average rank of 15.7 among first basemen, NFBC has him at #18 off the board, and our own Kyle Bishop has him as the #12 first baseman. I couldn’t disagree more.
First, I want to point out the legit steps forward Smoak took in 2017. Smoak’s biggest change in 2017 was being more patient at the plate. He claims he wanted to let the game start coming to him and slow down overall, not trying to do too much at the plate. He claimed he’d been swinging too hard and would tire out over the course of the season, so 2017 was about conditioning and pacing himself. And boy, did it work. Rarely do the graphs line up so nicely.
| O-Swing% | Swing% | O-Contact% | Z-Contact% | SwStr% | K% | |
| Smoak (‘16) | 29.6% | 45.3% | 54.9% | 82.2% | 12.7% | 32.8% |
| Smoak (‘17) | 25.8% | 43.0% | 62.9% | 87.9% | 8.9% | 20.1% |
Well then. That, my friends, is a notable step forward in plate discipline. Not only was he swinging less, but when he did swing, he made more contact (both inside and outside the zone), whiffed significantly less often, and reduced his strikeouts by 39%! Not only did his overall discipline improve, but he drastically improved his numbers with two strikes.
| AVG | OBP | SLG | HR | RBI | |
| Smoak (’16) | .145 | .214 | .273 | 5 | 12 |
| Smoak (’17) | .192 | .273 | .370 | 13 | 32 |
Still hitting under the Mendoza Line may not seem like much of an improvement, but an improvement of 40/50/90 points in his line is incredible. Also, that HR and RBI line is beautiful. 13 home runs with 2 strikes; that number was tied for 13th in baseball. He also ranked 40th in SLG% and 55th in wOBA. And this was only his first season with this new mindset at the plate. This could get even better in 2018.
The biggest payoff from this change in approach was Smoak’s production with runners in scoring position.
| H | HR | RBI | AVG | OBP | SLG | |
| Smoak (’16) | 21 | 4 | 21 | .167 | .278 | .310 |
| Smoak (’17) | 32 | 5 | 43 | .278 | .406 | .478 |
It’s also important to remember that the 2017 Blue Jays were… bad. In fact, only one other hitter (Donaldson) hit above .260 with 350 ABs or more. The Jays added Randall Grichuk (replacing Jose Bautista’s god awful .203/.308/.366 line) in RF, Curtis Granderson to hit leadoff, and Yangervis Solarte and Aledmys Diaz in the middle of the field replacing the frightening Darwin Barney and Ryan Goins, neither of whom hit above .240/.290/.360. The newcomers, plus hopefully more of Troy Tulowitzki will make the Blue Jays a much stronger lineup in 2018. Smoak is likely to hit in the 3 spot between Josh Donaldson and Kendrys Morales, which will lead to a lot more opportunities than he had in 2017. The counting stats should follow his production in a big way.
To show why you should wait on a 1st basemen for Smoak, I will compare him to 3 first basemen who are being drafted well above Smoak this season: Cody Bellinger, Wil Myers, and Anthony Rizzo.
Justin Smoak vs Cody Bellinger
The main reason I’ve heard for why Smoak is going so low is that he’s only done this once. But, then again, so has Bellinger, who is #23 overall in NFBC and #6 in our 1B rankings. I know some people are already arguing with me in their heads. I’ll address that, but first, entertain me, and let’s look at their stats side by side.
| AVG | OBP | SLG | HR | R | RBI | |
| Smoak (’17) | .270 | .355 | .529 | 38 | 85 | 90 |
| Bellinger (’17) | .267 | .352 | .581 | 39 | 87 | 97 |
On a quick look, their stats look incredibly similar except Bellinger had a 50-point advantage in slugging percentage and 7 extra RBI. However, the SLG% difference is mitigated when we look at xStats estimations of their numbers side by side.
| xAVG | xOBP | xSLG | xHR | VH% | PH% | OUTs | |
| Smoak (’17) | .268 | .354 | .543 | 39.4 | 10.5 | 24.7 | -.066 |
| Bellinger (’17) | .267 | .352 | .555 | 35.6 | 9.5 | 17.5 | -.077 |
Really quick, I want to explain these xStats. The first 4 are the expected totals or averages based on that player’s batted ball data. VH% or value hit% represents the percent of plate appearances that result in a “near automatic extra base hit”. PH% or poor hit% measures the percent of plate appearances that end in near automatic outs. OUTs=Weakly Hit Balls + Strikeouts – Well Hit Balls – Walks – Hit By Pitch. Basically, the formula summarizes their bad at bats. The smaller the number, the better.
According to the statcast data, they were virtually the same hitter last year, although Smoak had roughly 7% more poor hits. So why is one taken in the second round, and one the 13th? The standard answer is: Bellinger is a top prospect! This isn’t his ceiling! It’s worth mentioning that Smoak was also a top prospect- he was a first round pick by Texas in 2008 and the centerpiece of the trade to pry Cliff Lee from Seattle. Smoak struggled to reach his ceiling, but it appears that he’s finally reached it. It certainly wouldn’t be the first time we saw a top prospect struggle for years and then find success later on.
Bellinger may not have reached his ceiling yet, and his ceiling could be even higher than his rookie season, which explains why he’s so highly sought after. Bellinger also has a better lineup around him than Smoak. But, that does not justify an ADP gap of 127 picks. Bellinger goes THAT much higher because he’s the flashy name with the Rookie of the Year award on his resume. Smoak is not a flashy name by comparison, but he has a chance to put up virtually the same line as Bellinger over the course of the season. If it were me, I’ll spend my 2nd round pick elsewhere and grab Smoak 10 rounds later.
Look, I get the track record argument. Other players have performed at a high level for multiple years prior to 2018. But the point of this article is to show you why you can expect Smoak’s breakout to continue. Wil Myers is currently going 80 spots above Smoak, currently 70th on average according to NFBC. Let’s take a look at why.
| AVG | OBP | SLG | HR | R | RBI | SB | |
| Smoak (’17) | .270 | .355 | .529 | 38 | 85 | 90 | 0 |
| Myers (’17) | .243 | .328 | .464 | 30 | 80 | 74 | 20 |
The only real appeal I see from Myers is the SB category. There’s definitely value there, but is that enough to justify the serious deficiency in every other category? Maybe that’s enough for you, but it’s not for me. The Padres just added Eric Hosmer and Chase Headley, but they still do not have a good lineup overall, particularly compared to the Blue Jays. Therefore, I expect Smoak to continue to put up higher counting stats across the board.
| xAVG | xOBP | xSLG | xHR | VH% | PH% | OUTs | |
| Smoak (’17) | .268 | .354 | .543 | 39.4 | 10.5 | 24.7 | -.066 |
| Myers (’17) | .248 | .333 | .477 | 30.7 | 7.9 | 20.3 | .024 |
More than anything, I can’t swallow the 20-point differential in AVG. Myles Nelson wrote about that in his Altuve vs. Trout article (albeit a bit more of a pronounced gap between the two); if you play in an AVG league, I don’t know how you justify a .250/.330/.460 first basemen in the first 7 rounds when a .270/.350/.540 one sits in the wings rounds later. Stolen bases just aren’t enough. If you play in a points league, where steals are less important, this is as open and shut of a case as it gets for me. Ditch Myers and go for broke with Smoak.
| AVG | OBP | SLG | HR | R | RBI | SB | |
| Smoak (’17) | .270 | .355 | .529 | 38 | 85 | 90 | 0 |
| Rizzo (’17) | .273 | .392 | .507 | 32 | 99 | 109 | 10 |
| xAVG | xOBP | xSLG | xHR | VH% | PH% | OUTs | |
| Smoak (’17) | .268 | .354 | .543 | 39.4 | 10.5 | 24.7 | -.066 |
| Rizzo (’17) | .283 | .402 | .530 | 32.7 | 8.4 | 25.8 | -.085 |
The biggest difference here is the OBP gap. I don’t try to deny that Rizzo gets on base at a much higher clip than Smoak, but if your league uses AVG or OPS, or points scoring, Smoak and Rizzo are actually pretty similar. Rizzo’s big advantage is in counting stats; the Cubs’ lineup is simply better than the Blue Jays’. However, keep in mind what I stated earlier that the Jays lineup should be notably better in 2018, which will help with the counting stats. Smoak’s statcast data suggested the homer gap was legitimate, and Smoak’s VH and PH numbers vs Rizzo suggest he actually made better contact than Rizzo throughout 2017. The gap in OUTs can be explained by Rizzo’s low strikeout rate compared to Smoak.
Just like Myers, Rizzo gets stolen bases, which helps his value marginally. But he’s currently 24th off the board according to NFBC. Taking a look at these stats, I don’t understand the justification for a 126 pick gap between the two.
I won’t fault anyone for drafting one of the top 1B. Rizzo and Bellinger are elite hitters and will be very helpful to your fantasy lineup. However, after looking at these 3 comparisons, I will be waiting on a 1st basemen and grabbing Smoak much later. If he repeats his 2017 production, which the numbers suggest he will, he can provide 3rd to 5th round value at a steeply discounted price tag on draft day.
Part II: Putting the Top Down on the Conforto-ble
Fantasy owners are deathly afraid of injuries. The fear that a player will not be ready for opening day drives down ADP- I feast on that and you should too. Last year, J.D. Martinez was expected to miss April and his ADP plummeted because of it- all the way down to 85.8 as the #21 OF.
I’d like to discuss this argument in the context of Michael Conforto. Before we start, this argument doesn’t necessarily apply to Roto leagues, but rather H2H leagues. This is because, in H2H, we’re more concerned with the player’s value in the games they play, but the missed time becomes more important in roto, which takes into account stats from the whole season.
Right now, NFBC has Conforto as the #47 OF and #182 overall, which is just crazy to me. Conforto is recovering from offseason shoulder surgery. The team has only said that Conforto will not be ready for opening day but once he is cleared to swing, he’ll be able to start a rehab assignment roughly two weeks afterward and could return about a week after that. The club is targeting May 1 as his current return date.
While I understand, it is difficult to digest the thought of not having one of your lower draft picks for the first month of the season, Conforto is worth it. Travis Sawchik wrote a great article on Fangraphs back in August 2017 about it. The heat maps and graphs in that article do a lot to tell the story, but I think we can go even further. First, here are some of the conventional stats for you.
| PAs | AVG | OBP | SLG | HR | BB% | |
| Conforto (’16) | 348 | .220 | .310 | .414 | 12 | 10.3 |
| Conforto (’17) | 440 | .279 | .384 | .555 | 27 | 13.0 |
Conforto clearly took a huge leap forward in 2017, but let’s see if its real by looking at the xStats.
| xAVG | xOBP | xSLG | xHR | VH% | PH% | OUTs | |
| 2016 | .240 | .328 | .456 | 16.6 | 7.8 | 21.6 | .029 |
| 2017 | .275 | .381 | .557 | 26.8 | 9.8 | 19.8 | -.104 |
Not only was Conforto’s .557 xSLG a fantastic number, it was 15th best in all of baseball in 2017 (min 100 PAs). His VH% was good for 17th in baseball in 2017 as well.
So, what happened? What caused this massive change in Conforto’s hitting ability? In addition to the zone changes that Sawchik pointed out in the article, Conforto spread the ball around the field, as demonstrated by the graphs below.
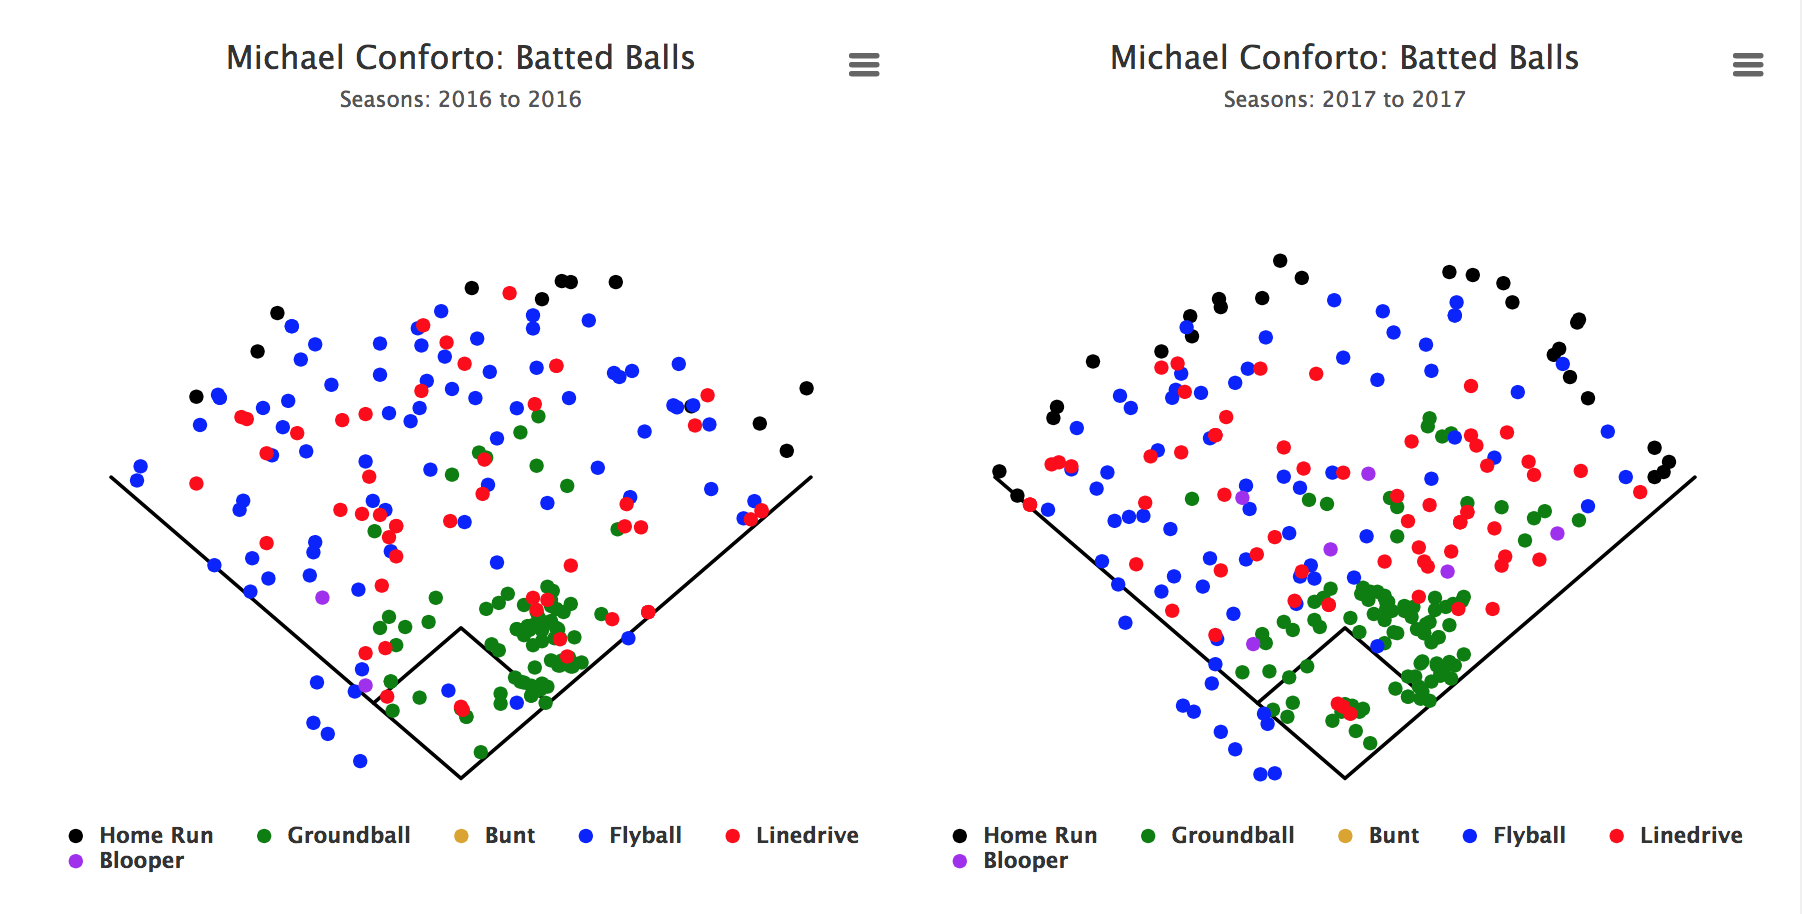
As you can see, Conforto spread the ball out much more successfully in 2017, showing a much more advanced approach at the plate. As you can also see, he had a number of short home runs. That makes even more sense when you see his 27.2% HR/FB rate. Therefore, you might be inclined to say his power will regress. However, the xHR suggests his 27 homers was actually spot on.
The best thing about this breakout is it is all approach based. As long as he comes back healthy from his shoulder surgery, he should go right back to raking. I see no reason he can’t put together a very similar stat line to 2017.
Now, let’s look at this production through the lens of his injury. We can’t expect more than 120-130ish games due to the time he’ll miss at the start of the year. Given that he’s going as the #47 OF already makes him your likely #4 OF, you don’t really have to worry about replacing his production for the first month. If you’re worried about that, you can easily draft Aaron Hicks, Bradley Zimmer, Aaron Altherr, Jose Martinez, or someone else to fill that spot for the first month.
When I’m evaluating a player who is expected to miss a short period of time at the beginning of the season, I evaluate them compared to similar players over the games that they will actually play. Therefore, I’m going to use Conforto’s stats from 2017 scaled out to 120 games compared to other players who are being drafted well above Conforto and their 2018 Fangraphs projections scaled to the same 120 games. Obviously, those players will be more valuable in that you know their health to start the year and can guarantee more games played. However, my goal is to show that the vast disparity between their draft slots is not justified.
| PAs | AVG | OBP | SLG | HR | RBI | R | SB | |
| Conforto (’18) | 533 | .275 | .381 | .557 | 29.7 | 74.8 | 79.2 | 2.2 |
| Fangraphs M.C. | 528 | .283 | .381 | .511 | 25 | 83 | 100 | 5 |
| N. Castellanos | 510 | .273 | .326 | .482 | 19.8 | 70.5 | 63.6 | 3.4 |
| A. McCutchen | 531 | .273 | .369 | .476 | 20.8 | 66.6 | 74.0 | 7.5 |
| A. Benintendi | 532 | .293 | .373 | .487 | 17.7 | 73.2 | 74.7 | 16.9 |
For reference, Castellanos is the #26 OF by NFBC ADP, McCutchen is #22, and Benintendi is #10.
I could go in depth breaking each of these players down vs Conforto but I think this graph says enough. Conforto isn’t going to steal bases. However, he’s going to hit for a serviceable average, walk at a high clip, and hit the ball hard. The Mets lineup isn’t fantastic, but they’ve got enough talent there for him to put up the counting stats.
Some may say this is cherry picking stats and that I’m ignoring the injury risk. I can assure you, I’m not. It’s very possible he doesn’t come back healthy. A prime example of what could go wrong with a serious shoulder injury is Michael Brantley, who has had issues staying on the field since his initial surgery. Then again, Adrian Gonzalez came back from his shoulder surgery to post arguably the best season of his career. I can’t guarantee Conforto’s health, nobody can, I’m just trying to show that a healthy Conforto is likely to put up better numbers over his 120 games than many other higher ranked OFs scaled to 120 games if he comes back healthy and at the same level as 2017.
I’m not saying that you need to be drafting Michael Conforto ahead of Andrew Benintendi– or even ahead of Andrew McCutchen. There’s no guarantee that Conforto will be fully healthy come May. What I’m saying is that I’d reach a couple rounds and take a chance on the lottery ticket that is Michael Conforto. He’s got a chance to finish the season as a top 15 OF if he returns fully healthy. There is risk baked into Conforto, but it’s a risk worth taking for me. And if he doesn’t come back healthy or isn’t the same player, you can easily cut bait. All I’m saying is he’s worth a ticket for the ride higher than his ADP.
