


Last month, I wrote about Ideal Plate Appearances, a metric on our player pages here at Pitcher List. That metric has been built from the great work of Pitcher List writers Alexander Chase, Jonathan Metzelaar, and Christian Mack over a couple of years. The metric (IPA%) is reflected as (Barrels + Solid Contact + Flares & Burners) / plate appearances.
My post last month explored a few potential adjustments to that formula. The first was adding walks, hit-by-pitches, and sacrifice flies and bunts to the numerator. That thinking was drawn from the long-standing amateur baseball practice of charting “quality at-bats.”
The second was to see if the metrics could be simplified. The formulas for barrels and flares/burners are dynamic and somewhat complex, which makes them less intuitive than other available stats and slow to stabilize.
If “simplicity is the ultimate sophistication,” as Leonardo da Vinci is believed to have said, then I wondered if something as simple as a player’s share of plate appearances that end in hard-hit balls (exit velocity of 95-mph or greater) and walks would be similarly predictive as other versions of IPA% and stabilize faster.
Summary of Results
In the end, I analyzed different stats using seasonal, qualified player data from each season 2015-2022 (except 2020) and correlating them with weighted on-base average (wOBA). Those stats were:
- Current PL IPA% = (Barrels+Solid+Flares&Burners)/PA
- IPA% 1 = (Barrels+Solid+Flares&Burners+BB+HBP+SF+SH)/PA
- IPA% 2 = (Hard Hit Balls + BB + HBP + SF + SH) / Plate Appearances
- IPA% 3 = (Hard Hit Balls + BB) / Plate Appearances
- Hard Hit%: (Both per batted ball event and per PA versions)
- Expected weighted on-base percentage (xwOBA)
Here are the results in a handy table:
Expected wOBA (xwOBA) was clearly the most “predictive” of actual wOBA, as you can see from its 0.71 r^2 above. My proposed update, IPA% 1, which added walks, HBPs, and sacrifices to our current IPA% metric provided the next best r^2, at 0.54.
While I was hoping that something simple might contain a relationship in the same neighborhood as a complicated stat like xwOBA, it’s worth noting that this version offers a significant improvement over our current IPA% metric, which had an r^2 of just 0.20, and over either version of hard-hit rate.
Such is the power of including walks in evaluating a hitter’s performance.
Unfortunately, my attempts at simplifying the metric even further were not quite as productive. IPA% 2 and IPA%3, based on hard-hit batted balls and walks, came back with r^2 in the low 0.40s. That’s still a 2x improvement on Pitcher List’s current IPA% metric, though, and an improvement over the hard-hit rate stats.
There’s always something to be said for simplicity in baseball metrics.
Update on Reliability
With expert assistance from Pitcher List’s Jeff Nicholas, these metrics were evaluated for their reliability, using Cronbach’s Alpha.
This is also known as tau-equivalent reliability and is an approach that is widely used to determine when a baseball statistic is more signal than noise. The closer the alpha is to one, the more reliable the observed stat becomes, and that happens as the sample size grows.
Essentially, this analysis tells us at what point stats can be reasonably trusted for prediction. If Cronbach’s Alpha is above 0.70, it’s generally considered to be good reliability. That’s the arbitrary, but rational, line in the sand where we think we are accounting for the majority of the variance in a sample.
In my prior Ideal Plate Appearances article, we had an incomplete look at reliability. This time, we’ve updated the plots below to include all the proposed metrics. It’s here that my simpler proposed options begin to shine compared to the others.
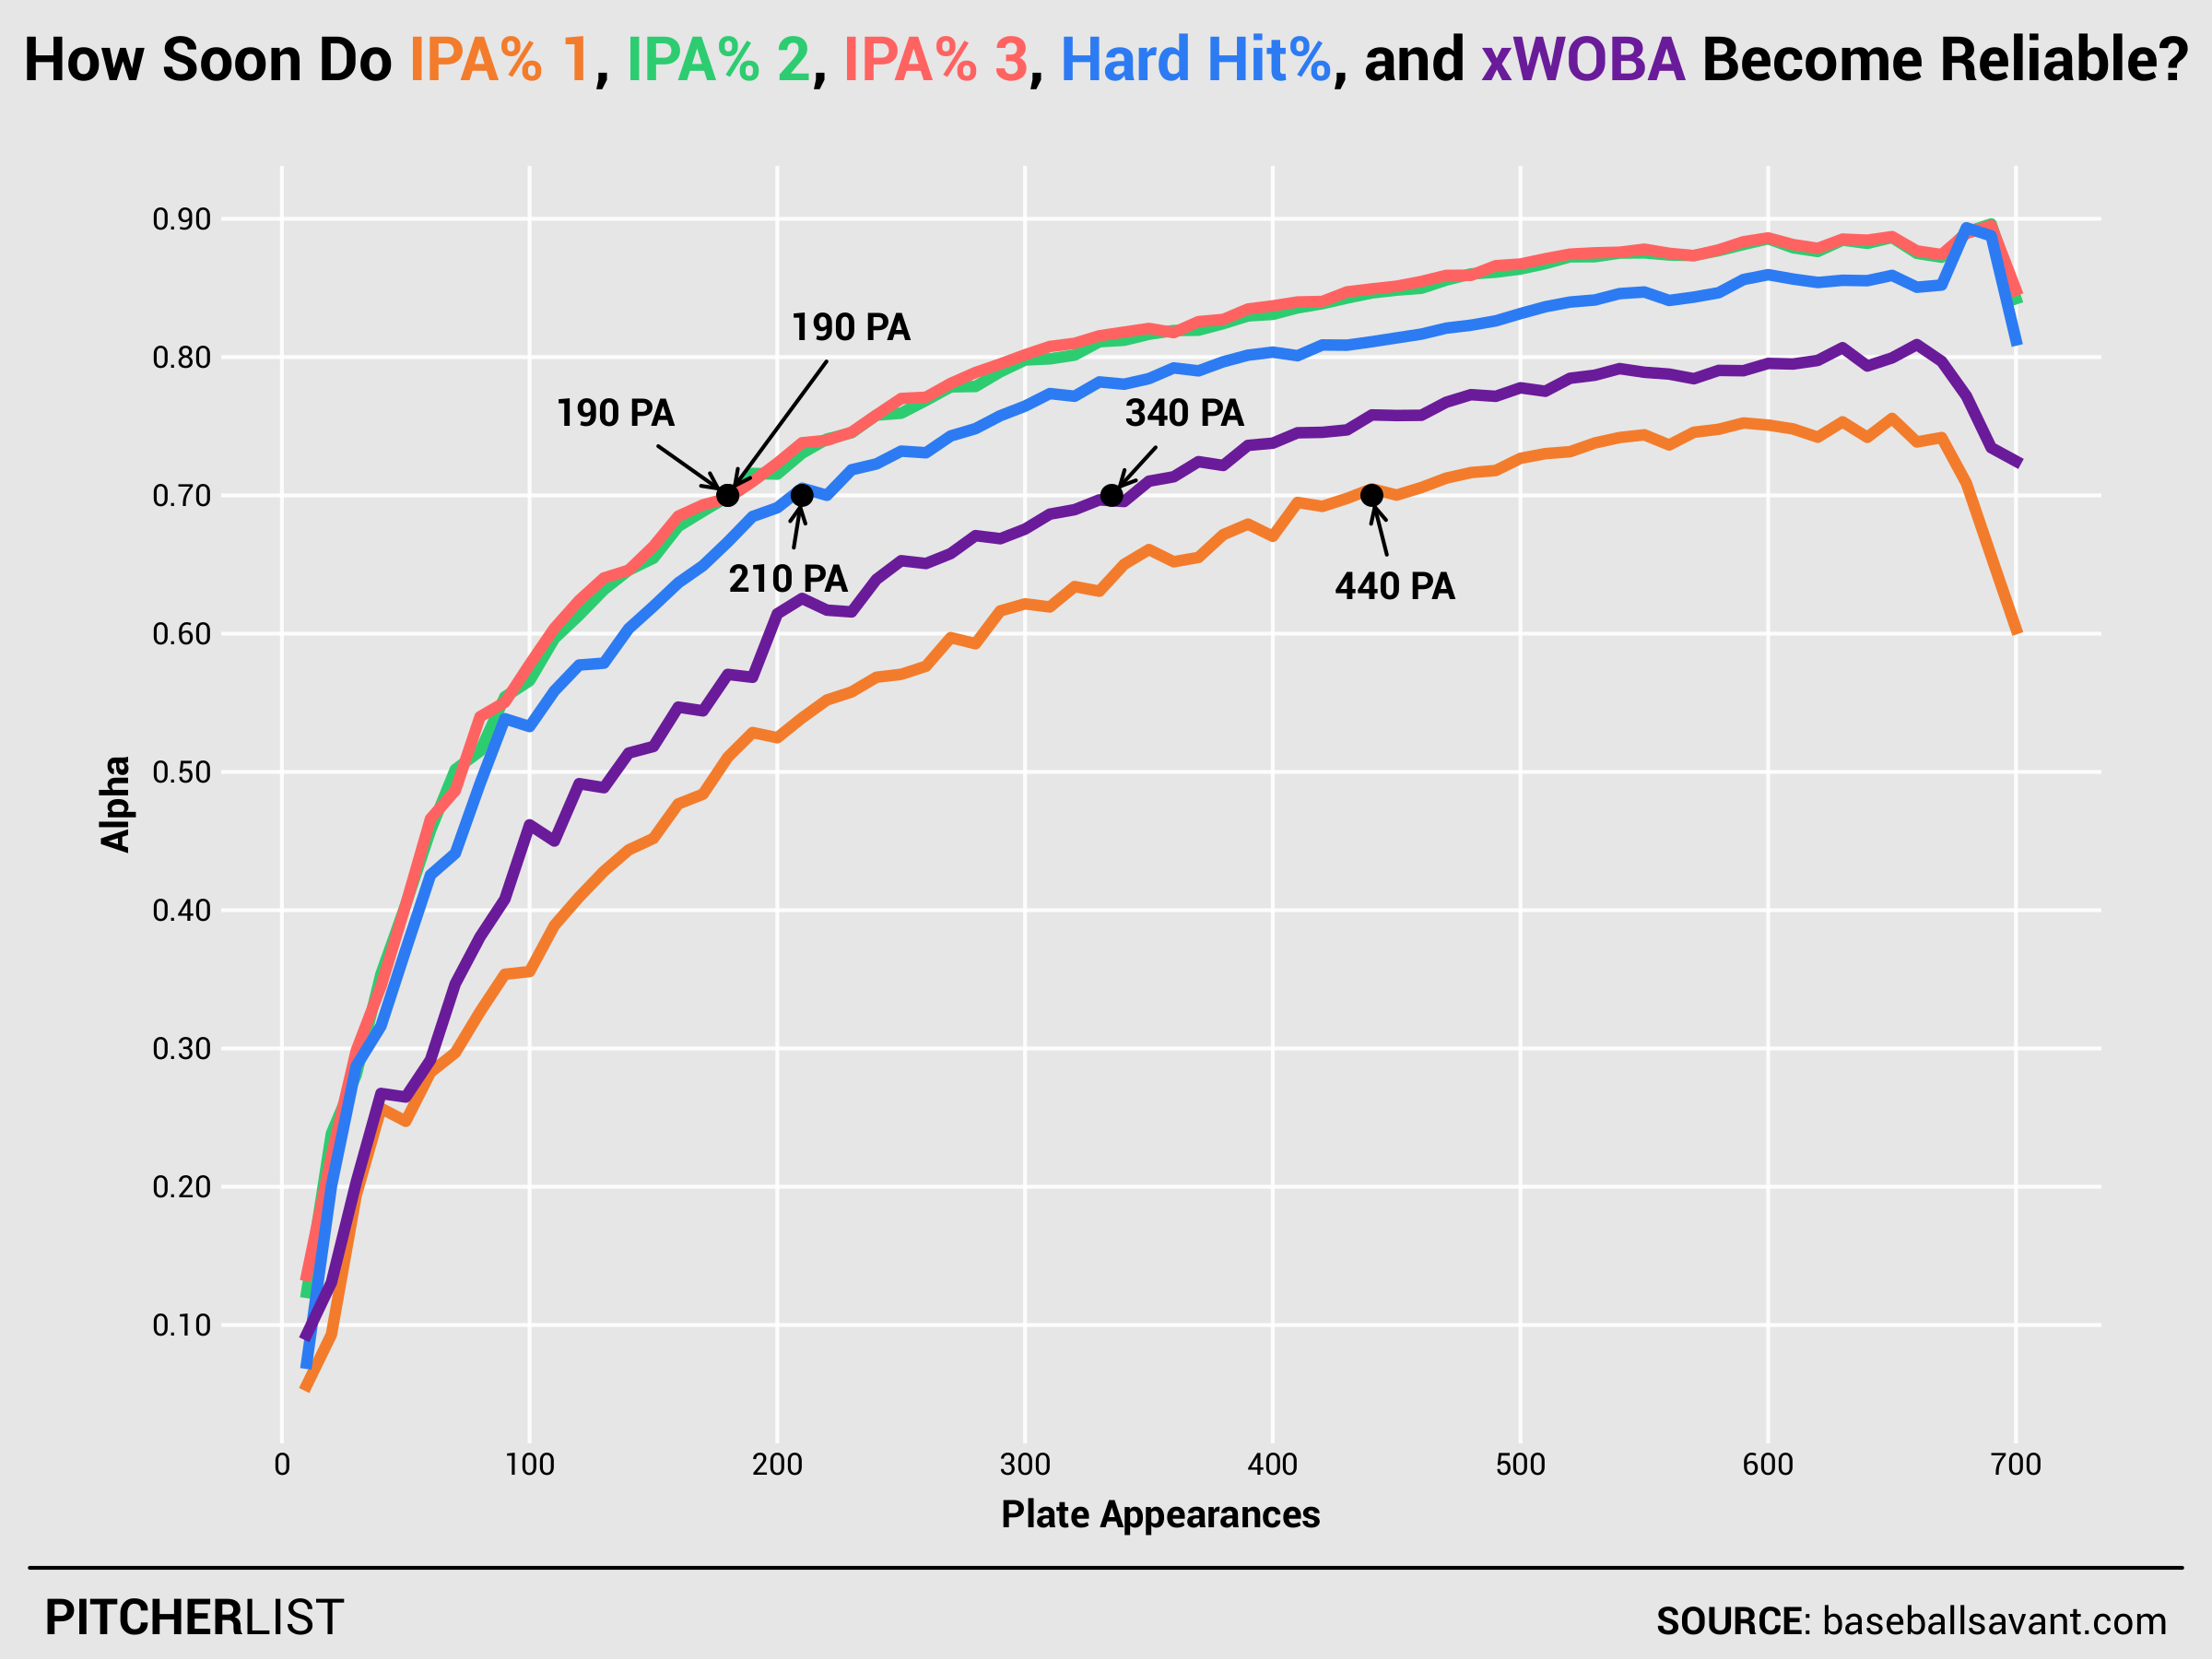
The stats that are based on more complex categorizations of batted balls (IPA% 1 and xwOBA), take significantly more plate appearances to “stabilize,” whereas the simpler versions that I proposed based on hard-hit batted balls (IPA% 2, IPA% 3) get there in only about 190 PAs.
Year-to-Year Stickiness
Also left undone in my prior article was an analysis of year-to-year stickiness. That is, how well does a player’s IPA% in one year correlate with their IPA% in the next? Is IPA% a repeatable skill? And which of these metrics best reflects that?
Again with Jeff’s help, we evaluated the year-over-year correlation of each player’s different IPA% metrics. The stronger the relationship, the more “sticky” the stat and the more likely that there is an underlying skill reflected in the metric. Here are the results:
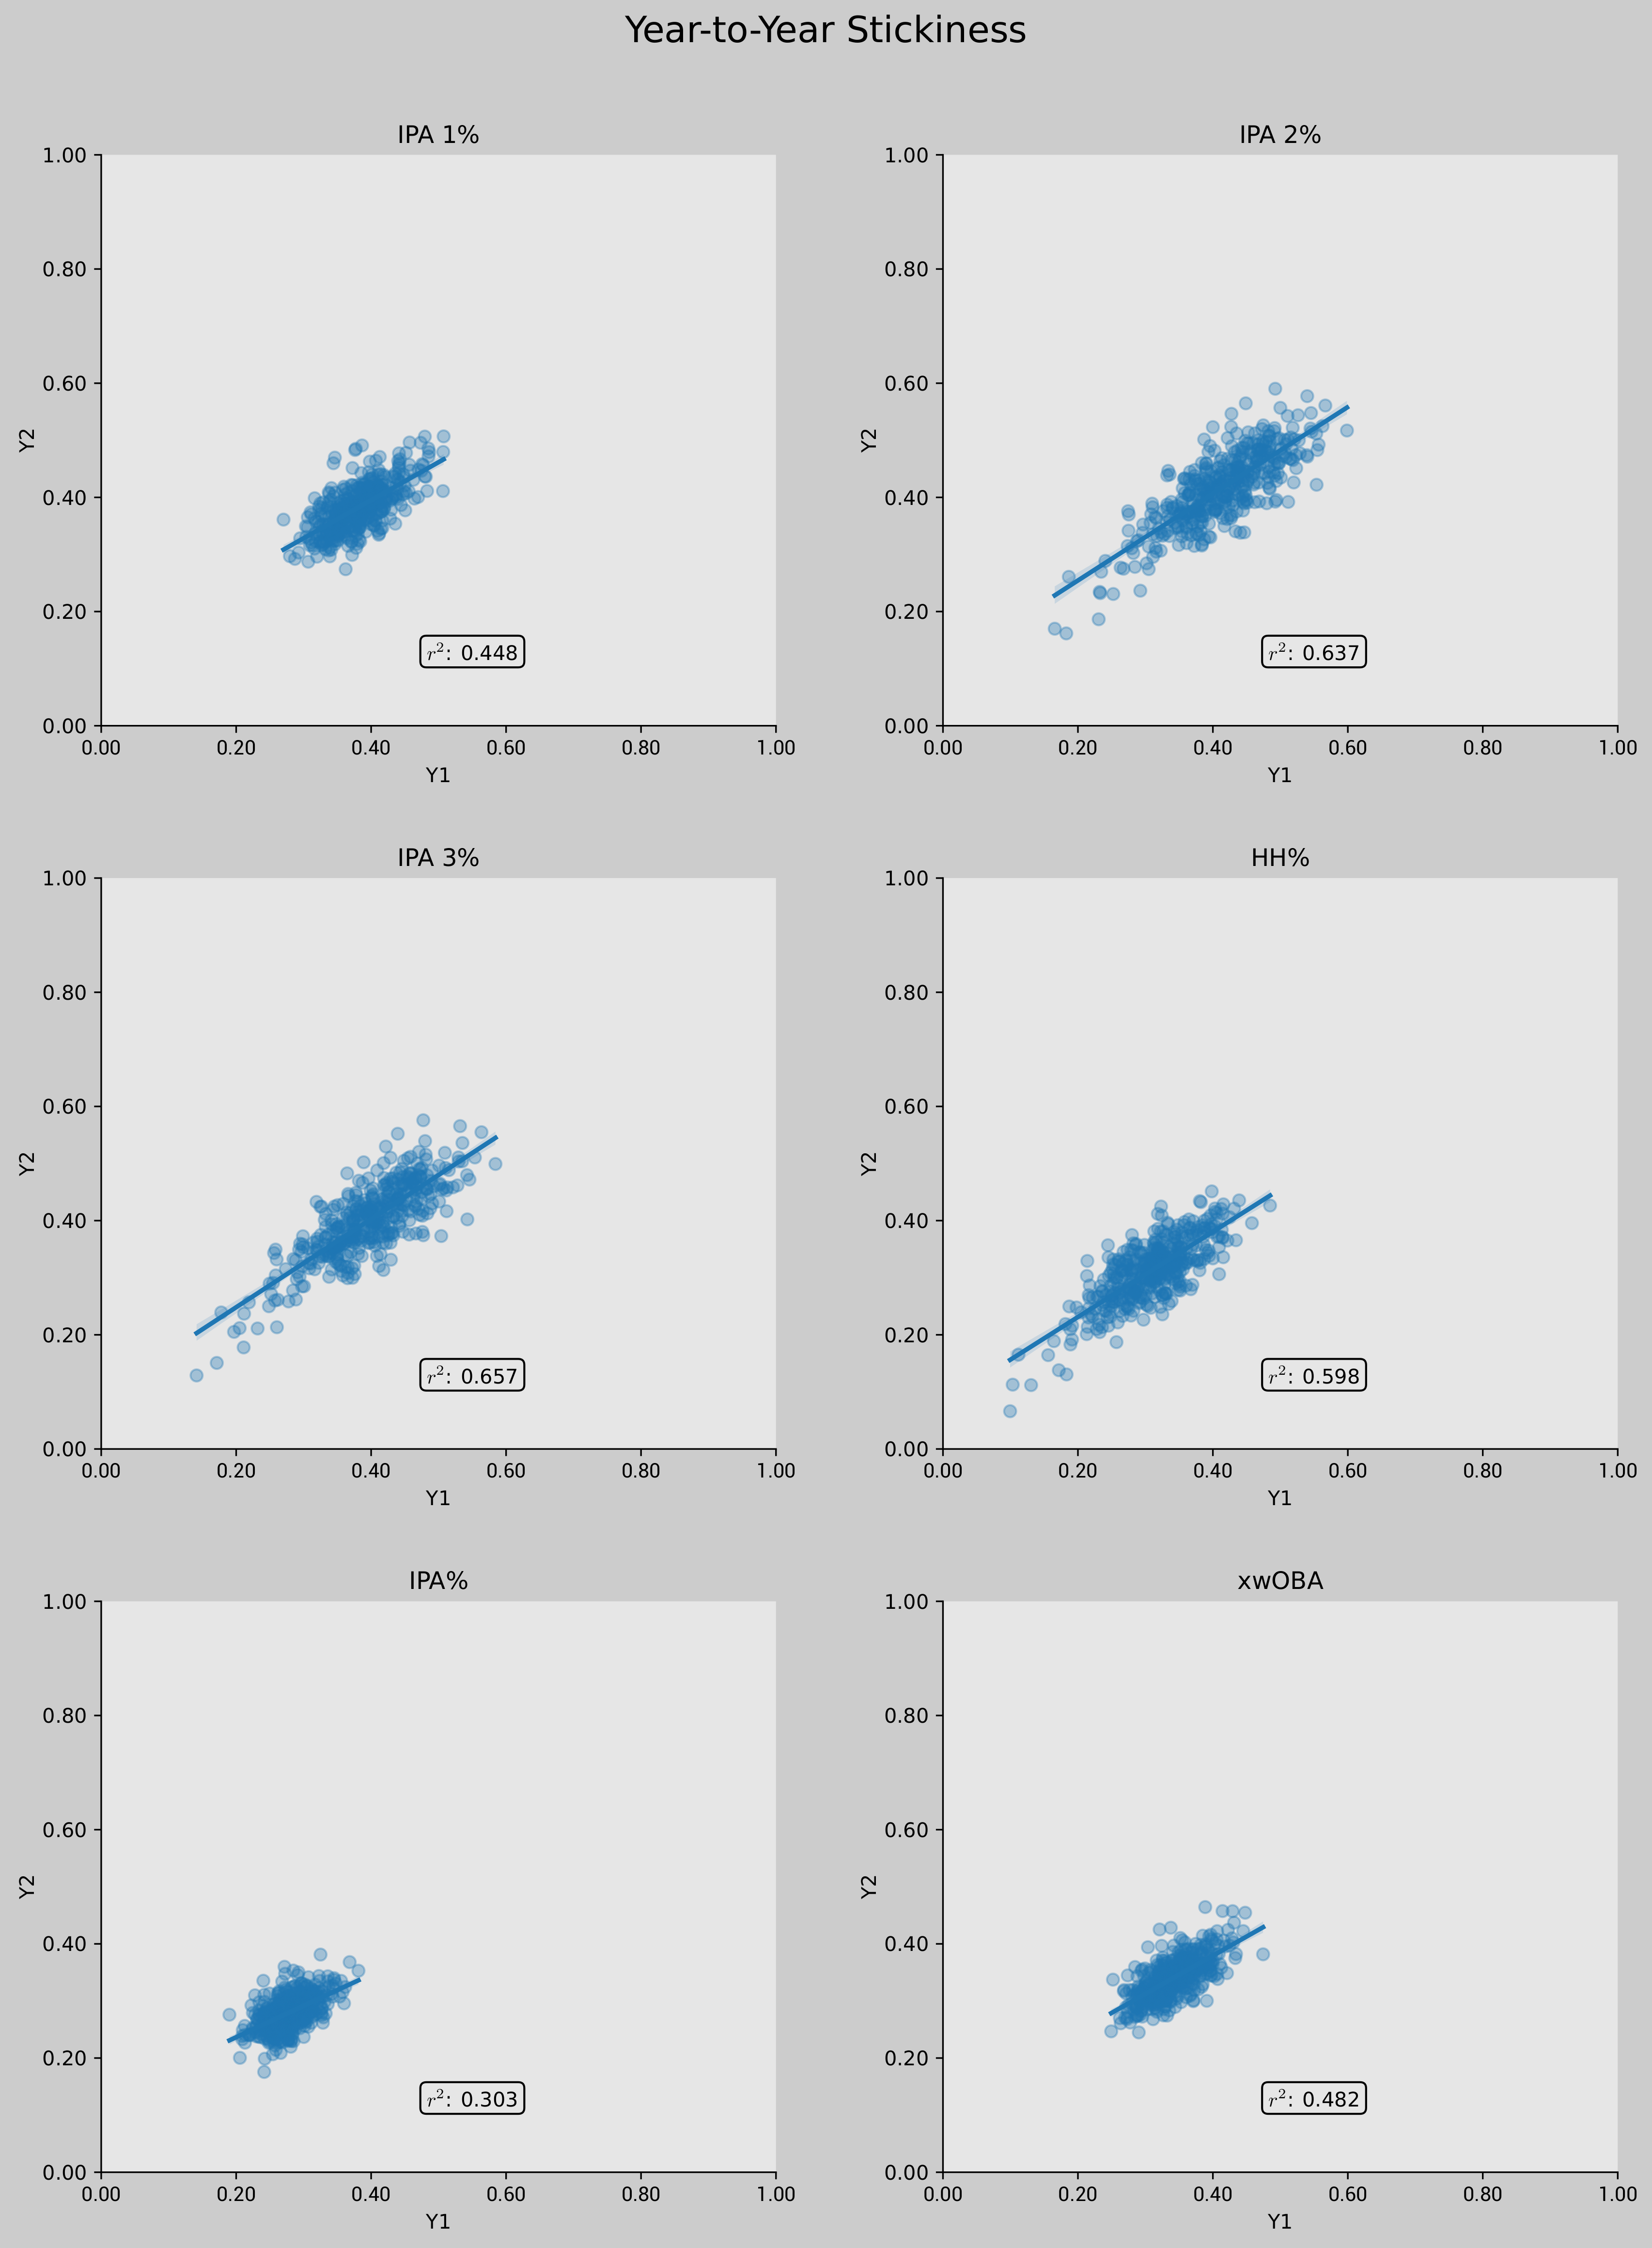
Here again, we see points in favor of the simpler options. IPA% 3, which is just hard-hit batted balls and walks, showed the strongest year-to-year r^2, with .657. IPA% 2 was not far behind at .637. This shows that players who have tended to rate well (or poorly) in these metrics in one season have tended to continue grading similarly in the next.
Even more encouraging is that these are both significantly more sticky than our current Pitcher List IPA%, xwOBA, and even hard-hit rate.
Summary of takeaways
- The current IPA% metric (Barrels+Solid+Flares&Burners)/PA is less predictive of production (as measured by wOBA), slower to stabilize, and less sticky than other options
- Adding walks to the formula increases the strength of the metrics’ relationships with wOBA significantly
- Expected weighted on-base average (xwOBA) has the strongest relationship with wOBA of the metrics evaluated
- xwOBA and the IPA% metric based on contact quality bins (IPA% 1) are slower to stabilize (via Cronbach’s alpha) than simpler options based on exit velocity and walks (IPA% 2, IPA% 3)
- The IPA% metrics based on exit velocity and walks (IPA% 2, IPA% 3) stabilize in less than 200 plate appearances
- The IPA% metrics based on exit velocity and walks (IPA% 2, IPA% 3) have the strongest year-over-year correlation and are significantly more “sticky” than xwOBA, hard-hit rate, and the IPA% metric based on contact quality bins (IPA% 1)
- If you’re after precision, use xwOBA or the IPA% metric based on contact quality bins (IPA% 1)
- If you’re after a meaningful signal that can be detected and trusted quickly, with a reasonable expectation to be sticky over time, use the IPA% metrics based on exit velocity and walks (IPA% 2, IPA% 3)
Thank you to Jeff Nicholas and Christian Mack for their critical assistance and review of this project.
Photo by Emanuel Ekström | Unsplash
Adapted by Kurt Wasemiller (@KUWasemiller on Twitter / @kurt_player02 on Instagram)
