


This is part one of a six-part series exploring spending optimization in Major League Baseball. Each article will dive deep into different ways that teams spend their dollars to produce the best value. Each part of the series will be added below as they are published.
Part II: Examining Non-Effective Cash Usage
Part III: Position Investment and Roster Usage
Ever since players began to be paid for playing baseball, teams have been seeking the most efficient way of spending their dollars to produce the best value. This isn’t even unique to baseball – people seek to risk a small amount while garnering the most significant returns in all aspects of their lives. From love to stock trading, from the Western Frontier to the Internet Revolution, making the most out of set resources has been a constant human approach – one that seeps into the sport that we all love. Baseball’s mimicry of markets everywhere makes the transference of certain outside concepts, or types of analysis, somewhat easy. In the case of looking at the different types of spending by Major League Baseball teams on their on-the-field product, the comparison could easily be made to that of a consultant reviewing marketing trends within a field to try to maximize a given company’s profit. Except the goal is not financial profit here (at least from the standpoint of a Baseball Operations Department), but wins.
To put it into a clearer perspective, think of a team like a portfolio of stocks. In this case, the stocks are individual players which they hope will generate a profit (wins). Like stock values, player performance varies by a wide margin, with highly valued players sometimes returning minimal value and low-value players returning great value. This variance in expected performance leading to unforeseen risks would be considered the volatility (also known as beta) of a team, which a Baseball Front Office would hope to minimize while maximizing the value of the dollars they spend. While teams can (and likely do) go through each individual player to mitigate their risk of a lackluster season, the focus of this article takes a wider look. Similar to how certain portfolios allocate given portions to certain sectors to mitigate risk, teams could potentially optimize their spending methodology by allocating more or fewer funds to certain parts of their payroll.
Identifying these potential optimizations requires intense research, separating the noise from the signal to hopefully provide meaningful insight. So for the sake of this piece, this is merely an introduction to the future in-depth looks that will be published. By providing the basis for the theory, it allows a solid foundation of reasoning to be built upon so that this research can be more accurate to its goal in nature. To truly establish the goal aforementioned, the actual impact of spending needs to be quantified as a whole.
Not Exactly David & Goliath
“High-payroll teams always seem to beat low-payroll teams – is there any use in trying to beat them?” When fans watch the movie Moneyball (2011), the iconic line, “It’s an unfair game,” said by Billy Beane, continues to linger in their view of baseball. Beane never said this (at least publicly) during that time, but the thought remains present. Angered and frustrated that mega-spenders such as the Dodgers and Yankees continue to have in-season success, fans continually point to the difference in payrolls as the main issue in Major League Baseball. They’re right; every team is allocated a fixed set of resources to make the most of. Some have a lot to work with, and others do not. But that isn’t just a baseball issue – every person in the world deals with this daily. They have a set amount of time and dollars to use, hoping to gain the highest quality of life through said resources. Some have lots more, and others have little. Everyone is dealt a different hand, but as Kenny Rogers said, “Every hand’s a winner, and every hand’s a loser.” It’s not always about the hand itself, but how one plays it.
Payroll discrepancies between the biggest and smallest-spending teams can be larger than a 5x multiplier in a given season. The difference between records is nowhere close to that. Some teams may spend lots of money, but that isn’t all there is to a record. In fact, payroll likely has a smaller effect on record than the common fan thinks. Using payrolls dating from 2010 (excluding 2020) to 2021 and adjusting for MLB spending inflation, payroll spending can be owed only 15.8% of the difference in win percentage. If the fan wants to utilize run differentials instead, only 11.3% of the difference in run differentials in a season could be owed to payroll.
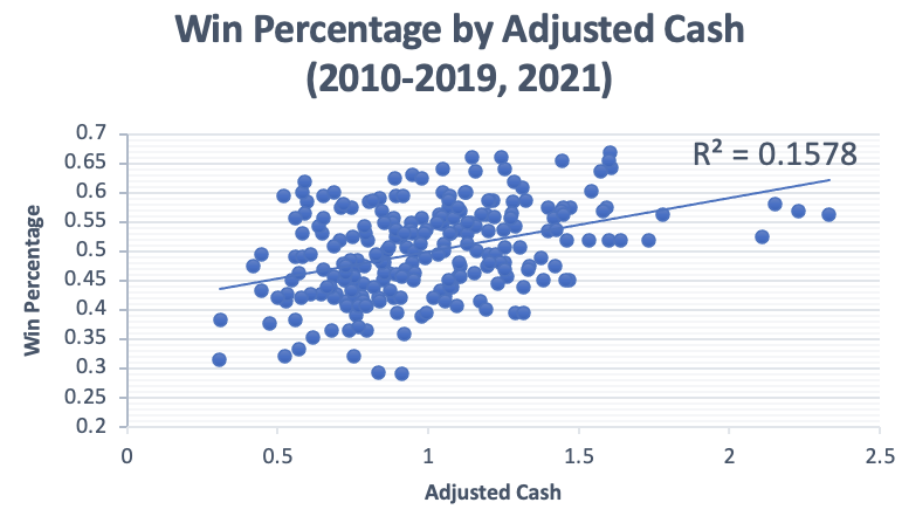
Regression of Win Percentage by Adjusted Cash Spent 2010-2019, 2021
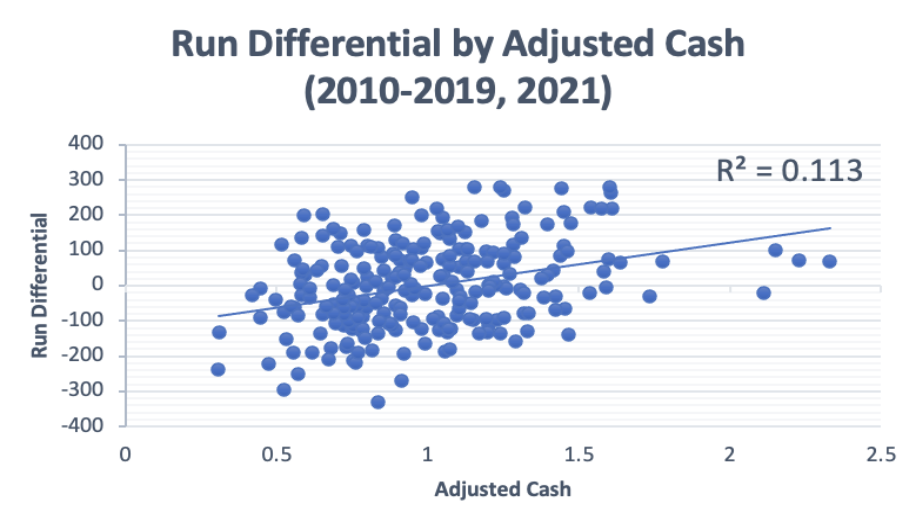
Regression of Run Differential by Adjusted Cash Spent 2010-2019, 2021
Payrolls may be unfair on the surface – after all, the figures among teams are not equal. But with only 15.8% of a given winning percentage and 11.3% of a given run differential being due to payroll differences, this is hardly a cause to deem the game itself completely unfair. It may be an evident disadvantage, but it is hardly insurmountable. Low-payroll teams can still beat high-payroll teams consistently – they just need the right combinations. Whether it means being frugal and thrifty with payroll dollars or reallocating funds with trades, the odds can be evened.
Finding the Edge
Refuting the notion that payrolls are everything is crucial in establishing a valid basis for spending optimization. If the outcome was dependent on dollars spent then there would be no need to write this very text. In that scenario, no amount of organizing and allocating could help overturn the odds. Goliath would almost always defeat David (variance would still exist to some degree). Thankfully, this is not the case. Being careful with which resources go to which departments can possibly yield a severe advantage. The optimized rate just needs to be found, finding the edge to beat the competition. In an overview of this concept, a brief explanation of possible edges to look into will be provided. In these edges, various hypotheses will be presented about the possibility of exploiting these advantages.
Non-Effective Spending
When classifying non-effective spending, this means explicitly money spent on players that are providing no value to a team. In wanting exact figures, utilizing injured list, retained, and buried spending should provide an accurate picture of the amount of somewhat wasted dollars. Injured list spending includes any dollars allocated for players on the designated list. Retained spending includes any money allocated for any released, bought-out, or traded players. Buried spending includes dollars spent on players earning a Major League salary while being on a minor league roster. All of these obligations serve to a team’s detriment. But in trying to gain an edge, how can teams navigate around these expenses to ultimately be better?
If the impact of this type of spending (and the parts within) can be calculated, then teams can figure out how much to invest to decrease their odds of incurring such expenses. A team that is less susceptible to the negative effects of this spending could be assembled, creating an opportunity to optimize a roster by aligning probability and costs (sort of like an insurance company). With an optimal investment amount, they can spend accordingly to be as successful as possible.
Effects of Investing in Certain Positions and Roster Usage
Every team has a different number of players at each position throughout the year, and every team prioritizes its spending on certain positions. Is there any advantage to these strategies? In looking at positional use, considering the number of players that were cycled through the roster could reveal a possible advantage. Teams have been known to send a variety of Triple-A players up and down to try to gain a fresh edge – the actual effect this has (if any) is unknown.
Teams also have to obviously have all nine positions filled on the field at a given time in a game, but which ones (if any) justify increased spending over the others? Through this segment, the correlations between the amount of overall spending on a given position and it’s given impact on winning measures are examined to attempt to identify potential price trends, as well as ways to use those trends to a given team’s advantage. Direct linear relationships between the two parts can ultimately mean many things, including the fact that certain positions may be more correctly priced than others.
By exploring those relationships and strategies, teams could potentially optimize their way of spending in conjunction with their development to specifically dedicate more spending to certain positions versus others. If a team chooses to spend lots of money on one type of position over the other, they’re making a strategic play that they believe will provide more value in the long run. Finding what positions have possibly yielded the best returns in terms of their payment and the causation element to winning statistics can reveal the best-optimized portfolio guidelines for team spending, which can ultimately lead to the desired success that every organization cares about.
Competitive Balance Tax Implications
The Competitive Balance Tax, often known as the Luxury tax or baseball’s softer version of a salary cap, is the fee that the MLB charges a ball club on all dollars spent over a given number in payroll. Dollars above the threshold are much less effective than dollars below, as the money above incurs fees that negate the value aspect of a signing. It may seem like common knowledge that teams should try to stay under this, but scenarios possibly exist where a team could benefit by going over the luxury tax. These scenarios need to be considered when teams are deciding to spend given amounts of money at different times.
The usage of deciding when to exceed the luxury tax threshold contributes to the varied investment size strategy in portfolio theory, which suggests that allocations of investment should be different in different market scenarios (in this case, team scenarios mostly). This may not affect a majority of teams, but it can prove useful when teams plan on employing a vast payroll. Inspecting the strategy behind these optimal scenarios is important in ensuring that clubs can produce the most in all conditions, regardless of the spending budget.
Scaling Investments for Given Times
The flawed investor is the one that does not vary their investment size based on the times. Similarly, the flawed team is the one that does not vary their spending based on their personal and competitive outlook. Teams that have learned to adapt their habits to what best suits their needs in a given time regarding spending exhibit flexibility, which is a key to long-term success.
Spending optimization comes into play when said team needs to decide when they should escalate or de-escalate their investment, choosing the best and worst periods to spend so that the team can achieve the most success possible. This will primarily be investigated through case studies, which provide a great outlook on how prior teams have successfully gone through such changes in spending.
The Things Incalculable – The Future of Spending Optimization
This is an attempt at answering the unanswerable (in the current data climate). There are so many different facets of a team that management could decide to invest in, some of which do not include the players directly. This can include nutrition, facilities, management compensation, and a broad array of other factors that further investment into would likely lead to some currently incalculable effects. In theory, it would be possible to estimate the effects of such things. But with teams not releasing their financials publicly, the data is not there to make hard conclusions.
That does not exclude its importance in investments in said categories, and the degree that this theory plays a role in such a strategy. Providing the different avenues that teams could take, this part serves as an inconclusive outlook on what could be considered in such management, as well as the potential for future research in baseball in a more data-friendly environment than the present.
Closing Thoughts
Teams, like people, do not start in equal circumstances. That, however, is the great thing about mobility – it allows entities to climb above those that started ahead of them, surpassing even the highest expectations. Spending optimization in Major League Baseball could be the key to this mobility. This piece is full of hypotheses, although it is just one large question: Does spending optimization actually have any possible use in Major League Baseball? The proposed optimization may not be possible, or the possible gain may be negligible. The extent of any impact is unknown thus far, hence the need to research each possible facet of this proposal thoroughly and estimate the validity. Before going any further in this multi-headed series, it is worth noting that the extent of these pieces are to look at baseline relationships in hopes of creating a foundation for spending optimization. Further analysis, such as machine-learning analysis and linear optimization, is better suited with a solid foundation – the likes of which will be gained through these readings. Hence, the conclusions that follow will serve as a starting point in what hopefully can serve as another in-depth way to improve a Major League club through strategy.
