


This is part three of a six-part series exploring spending optimization in Major League Baseball. Each article will dive deep into different ways that teams spend their dollars to produce the best value. You can find part one (and the rest of the series) here.
Rosters, while seemingly limited, come in all sorts of shapes and sizes. Different combinations allow teams to try to leverage all of their available talents to hopefully produce an improved result, which may or may not actually produce something. But do these different combinations of positional use and spending provide an impact on a team? If an impact does exist, then spending optimization can be applied to find the optimized level for a given team.
The Sample
The sample is similar to that of past articles used for this multi-part post. Using Spotrac data, 240 teams’ seasons and spending habits dating from 2013-2021 (excluding 2020) were used to conclude the matter of Roster Combination. The sample includes active roster spending from both the 25-man and 26-man periods. These numbers are again adjusted using cash scores (mentioned in the prior part), where each amount of spending is relative to the season that it happened.
Effects of Using More Batters or Pitchers
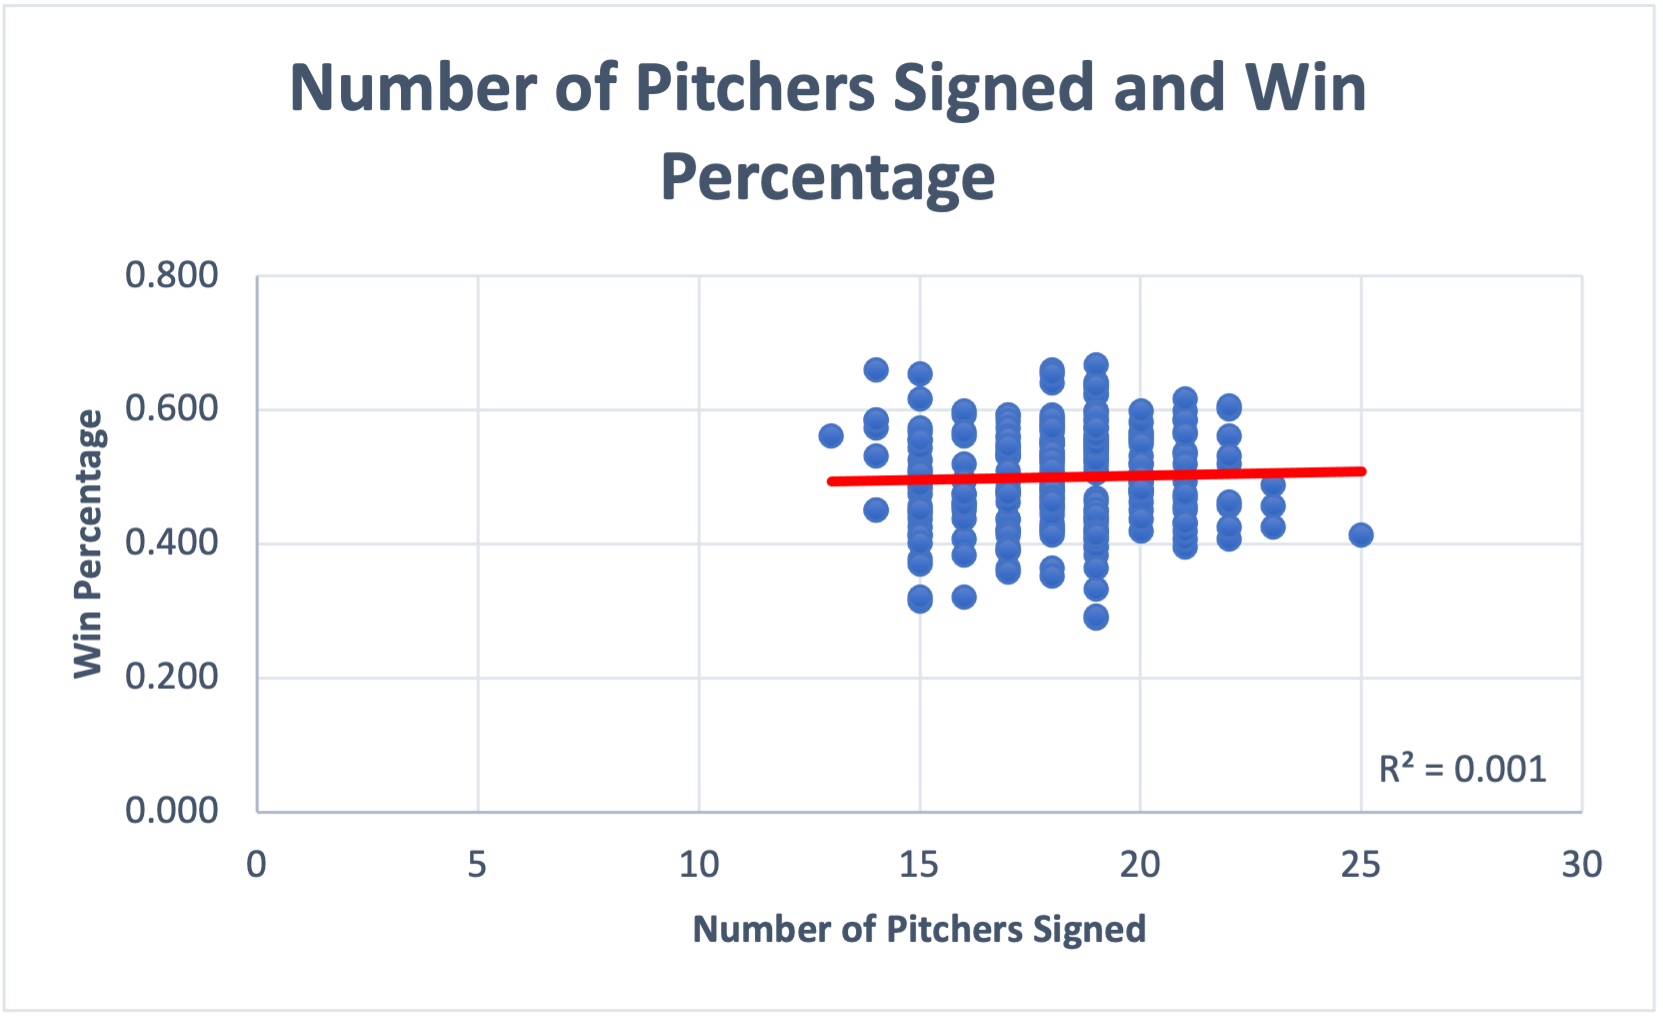
Probably the most basic look at positional rostering use, comparing the number of hitters and pitchers that utilized roster spots can answer which side (if any) deserves to be rostered more. While each team is limited to a 25-man (before 2021) and 26-man roster (2021), the total amount of players from each side that played on the big league roster will be counted. If a given team happens to be cycling through more pitchers than hitters, their outcomes could be an indicator of a possible effect.
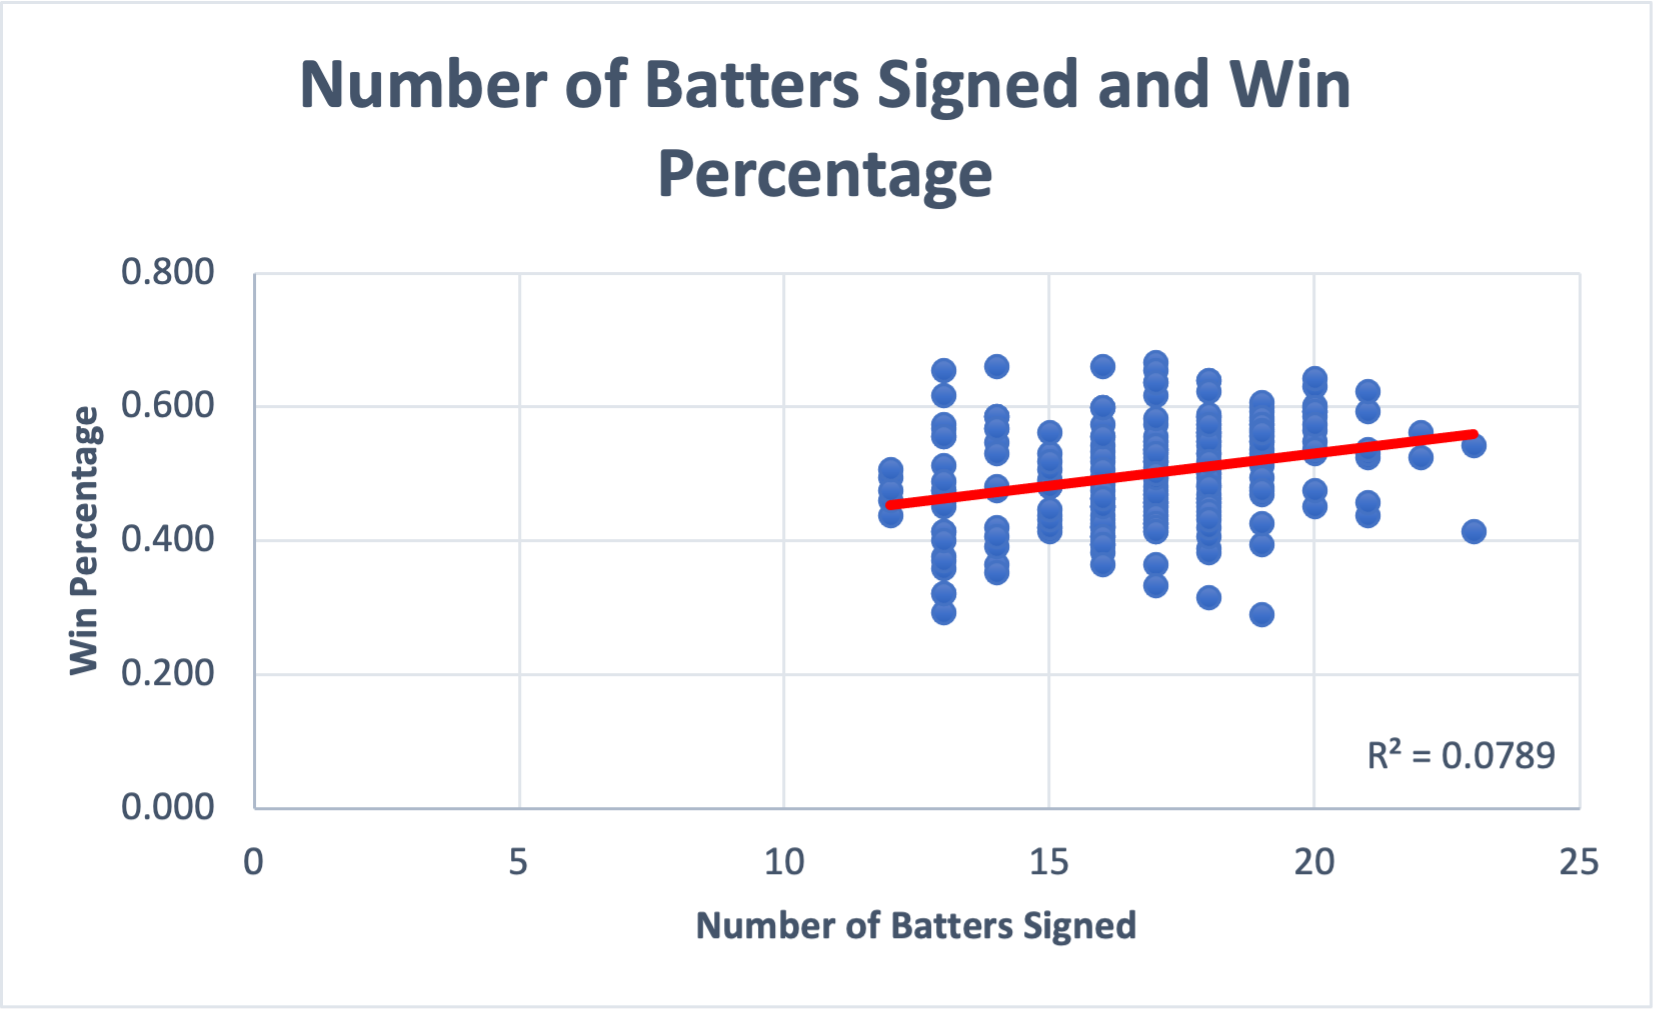
The number of hitters and pitchers rostered during the season experienced a normal distribution curve, making the utilization of the averages for both appropriate. The average amount of hitters utilized was 16.87, while the average amount of pitchers was 18.18. This should not be of surprise to the reader – pitchers are known to get injured more often than hitters. They also tend to be tunneled between the Major and Minor levels more than hitters, which can explain the difference in average. Considering deviations from these averages may be unnecessary.
The changes in pitchers used had no almost no causal impacts whatsoever. 0.1% and 0.02% (of winning percentage and run differential respectively) could be owed to pitcher utilization numbers changing based on the the r-squared score, which measures the amount of causation for a given factor.
The number of hitters used in a given team’s season can possibly account for 7.9% of the fluctuation in winning percentage and 7.2% of the fluctuation in run differentials. These are not very high scores whatsoever, and the amount of variation possible makes this factor likely negligible, especially considering the other half (context is key). However, the amount of hitters used does affect the number of pitchers used, making a minute second-order effect possible.
When trickled down farther into individual position types, the effect remains negligible in all aspects. No assortment of signing more players for a given category has shown to be advantageous in producing more wins or better run differentials. Teams would likely be better off not devoting any time or resources into making sure they sign more of a given player type to their roster throughout the year.
Effects of Spending on Batters Versus Pitchers
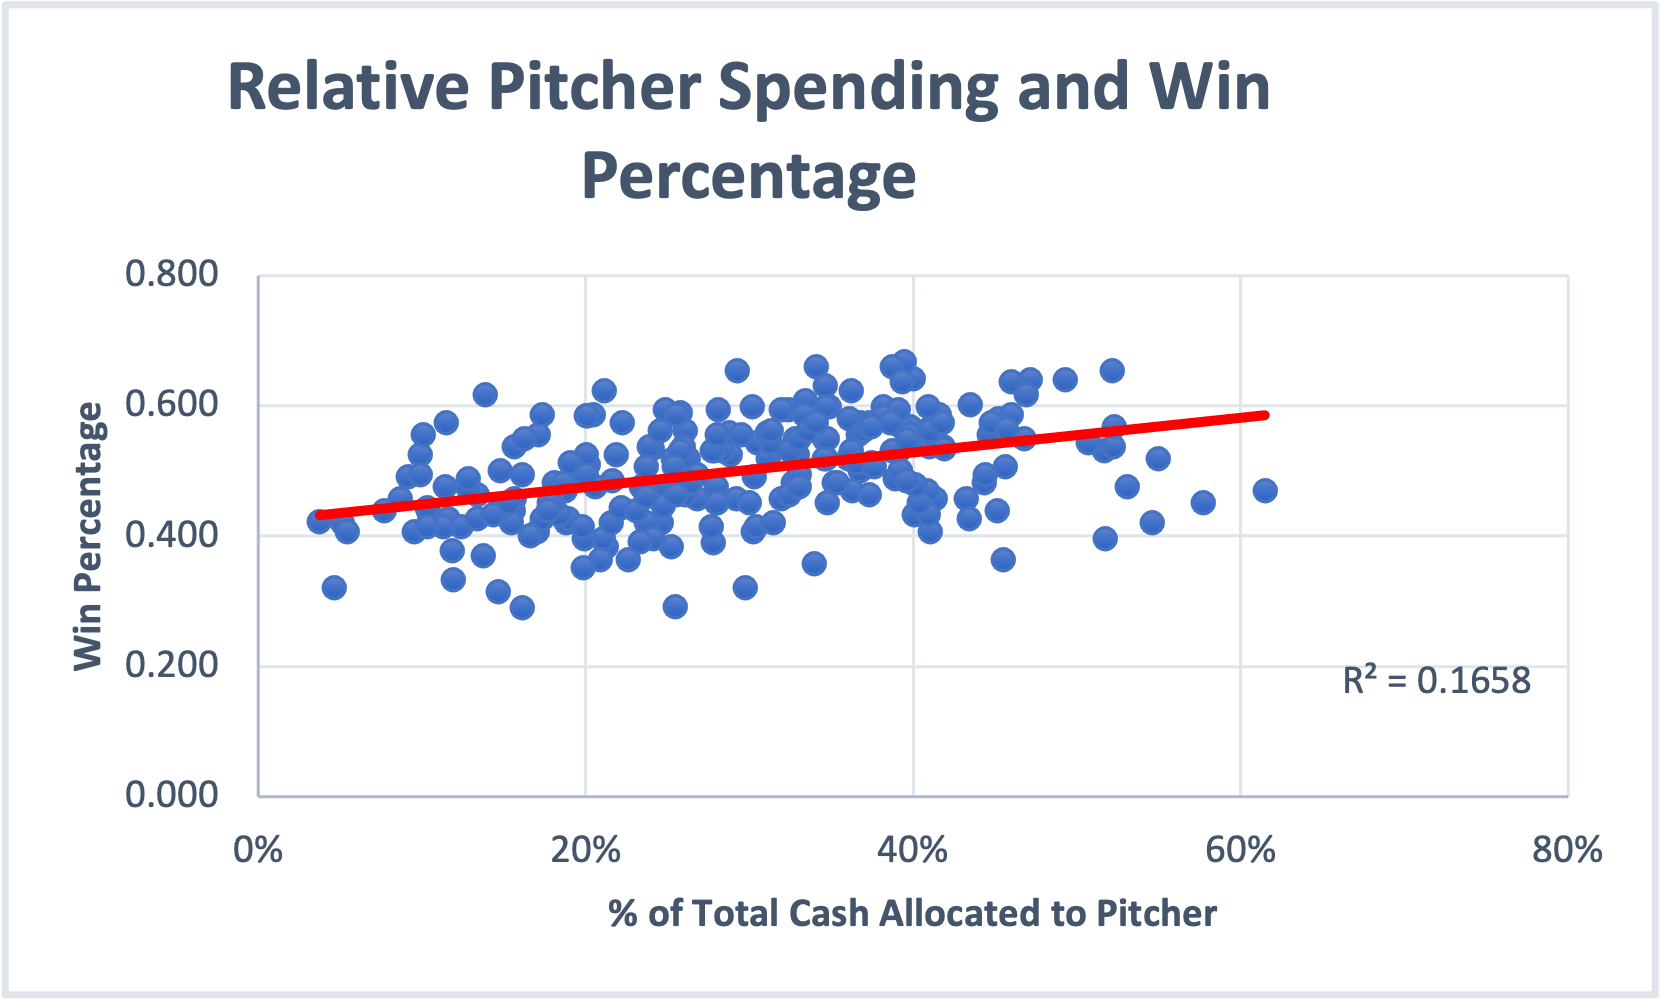
Spending on baseball players is entirely relative to the amount of given cash a team is spending, as baseball operations professionals can often not control the spending aspect. They can only control how they allocate the funds they are given, which is what is taken into account when comparing the effects of spending on either batters or pitchers. However, non-relative cash spending’s impact will also be considered with the intention of understanding any possible changes. In an attempt to account for performance that only directly impacts a given record, the relative and non-relative cash spent only on the 25-man (and 26-man) rosters will be considered. With both pitchers’ and hitters’ percentage allocations showing a normal curve, their averages are 29.24% and 37.76% respectively. A single standard deviation hovers around 11% for both, which shows that the variance among the sample was somewhat high. These differences did illustrate a degree of a relationship.
The amount of relative spending on pitchers in the sample revealed that 16.58% of increased winning percentages and 18.69% of increased run differentials could be owed to a higher level of pitcher spending.

This degree of causation is nothing to scoff at, as even a large degree of variance still leaves clear evidence of a relationship between the two factors. Hitters experienced a similar, but slightly less significant, result. 14.98% of increased relative spending could be owed to increased win percentage, while 12.69% could be owed to increased run differentials.
As these scores are so similar, it is not obvious whether increased hitter or pitcher relative spending is more important. Increased allocation in both does lead to better results. But, there is a catch. This is likely because these cash percentages come from the total cash spent. Teams still have to allocate cash outside of their main rosters – a team that is utilizing a higher proportion of their cash on the active roster will be more successful (as mentioned in the part regarding active spending). Either way, a team would likely not experience a great benefit from increasing spending for one particular type of player.
While relatively is extremely important, the adjusted nominal number correlations are worth including. In a prior part, it was established that teams with more money will generally be more successful. This part reveals a similar finding. A teams’ hitter category had r-squared scores of 0.24 for increased win percentage and 0.19 for increased run differentials when adjusted spending went up. The pitcher category had 0.24 for win percentage and 0.23 for run differentials. Increased spending exhibited a decently higher relationship with better team performance than the relative rate – the amount of money a team spends again does matter how well they end up doing. But, a team will likely not gain from choosing to increase adjusted nominal spending for one category over another (a hitter or a pitcher).
Effects of Investing in Certain Positions
Imagine this hypothetical scenario. A team is given x amount of dollars to spend on a given position type. For simplicity, these types are catchers, infielders, outfielders, starting pitchers, and relief pitchers. The team is fairly well-rounded, and all of the players are considered to be average at their position. In the last section of this, the difference between pitchers and hitters was not something to care about. But what about those different more individualized position types? What types should the teams be investing in?
To answer this question, we need to consider two aspects: the effect of allocating a percentage of extra funds, and the effect of allocating additional adjusted (based on average cash spending in a given year) dollars. As we’ve already established that increased spending leads to increased performance, allocating additional adjusted funds versus just considering the percentage of extra will likely yield a higher correlation. After all, two percentages of spending can be equal and be two totally different cash amounts, which is known to have an impact.
We will again use linear regression. Looking at every positional type (that was deemed to have a substantial difference), the amount of direct impact of an additional dollar or percentage for a given position can be estimated. If a given one of these is known to increase performance more certainly in some areas than others then a team would be wise to invest in the areas (before the market catches up).
Catchers
The only position that directly fits into its own group, conventional knowledge has emphasized the importance of a catcher’s ability to lead games and provide support for their team. Newly discovered framing metrics and possible sequencing effects have also added direct statistical value. The average team in this sample used 3.98% of their total cash on catchers on the 25/26-Man. And for being one single position, these findings suggest that investing in catchers has an impact.
When using the teams’ relative spending numbers, the r-squared is fairly low – 0.05 for win percentage and 0.026 for run differentials.

This is negligible and shows that just investing a bigger portion of a team’s cash will not make much of an impact. When one considers the actual spending numbers, which are all adjusted for the total cash spent within a given season, catchers appear to make a much bigger difference. 9.1% of positive win percentage fluctuation and 5.1% of positive run differential fluctuations could be explained by catcher spending. Without context, these numbers may appear to be small. But for one position to possibly make that big of a difference is perhaps meaningful. Investing more nominal funds into catchers will likely provide a solid positive team impact.
Infielders
To clarify, the infielder group includes the 1st Baseman, 2nd Baseman, 3rd Baseman, and Shortstop. These positions are known to be crucial to the game of baseball, but does the extra percentage allocation or spending make the needed difference? The average team allocated 17.05% of their spending to infielders, which split up evenly is a bit more than the catcher segment. Teams may be allocating more of their funds to infielders, but the effect just isn’t there.
Only 0.2% of the fluctuation of win percentage and 0.05% of run differentials (which can both be rounded down to 0%) can be owed to a team’s relative spending, meaning that a given team allocates an extra percentage of their assets to infielders will likely not benefit.
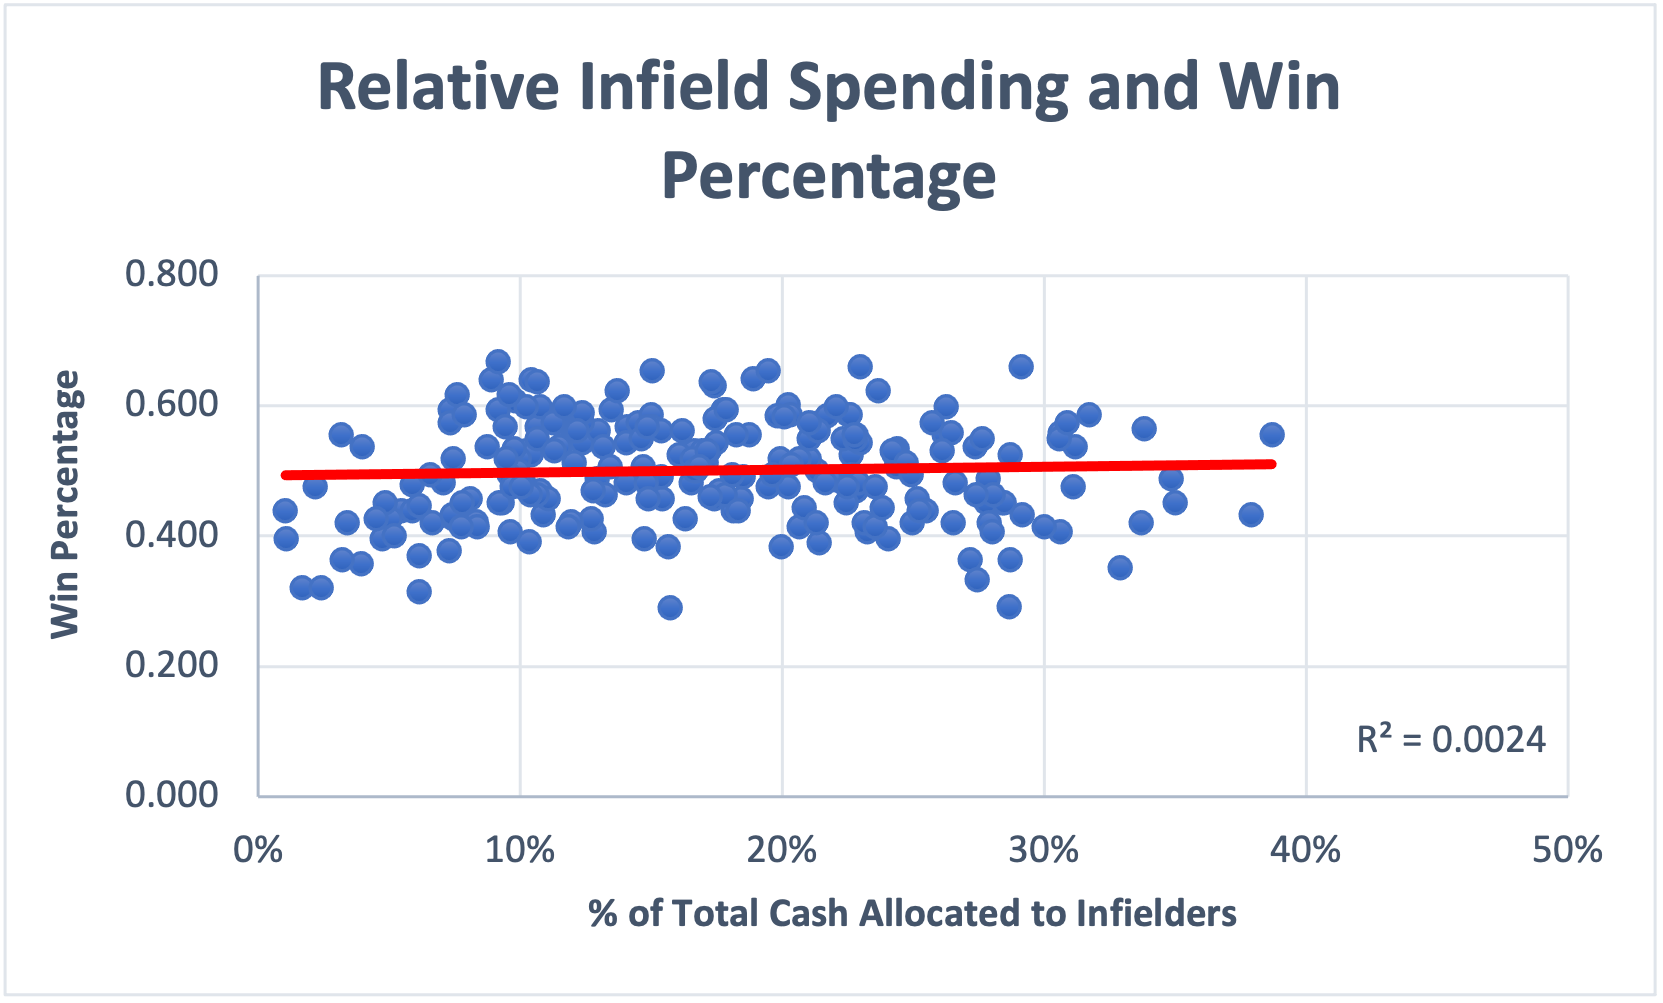
Additional nominal spending is a bit better (6% for Win Percentage and 3.1% for Run Differential for Roster Cash), but still not much. This can likely be owed to the fact that lots of teams have valued infielders properly, making any type of extra allocation much less effective.
Outfielders
The Outfielder group mainly consists of a Left Fielder, Center Fielder, and Right Fielder when they are playing the position, making up the 25/26-man Cash spent. Outfielders are also viewed as crucial players in the game offensively and defensively, although many teams prioritize a great hitting outfielder over a great fielding one. The difference in spending, which has an average allocation rate of 13.2%, has also been shown to make a crucial impact on team outcomes.
Teams that allocate additional percentage points from their total cash to the outfielder 25/26-man outfielder cash can expect to see a 5% causation effect on win percentage and 5.5% on run differentials.
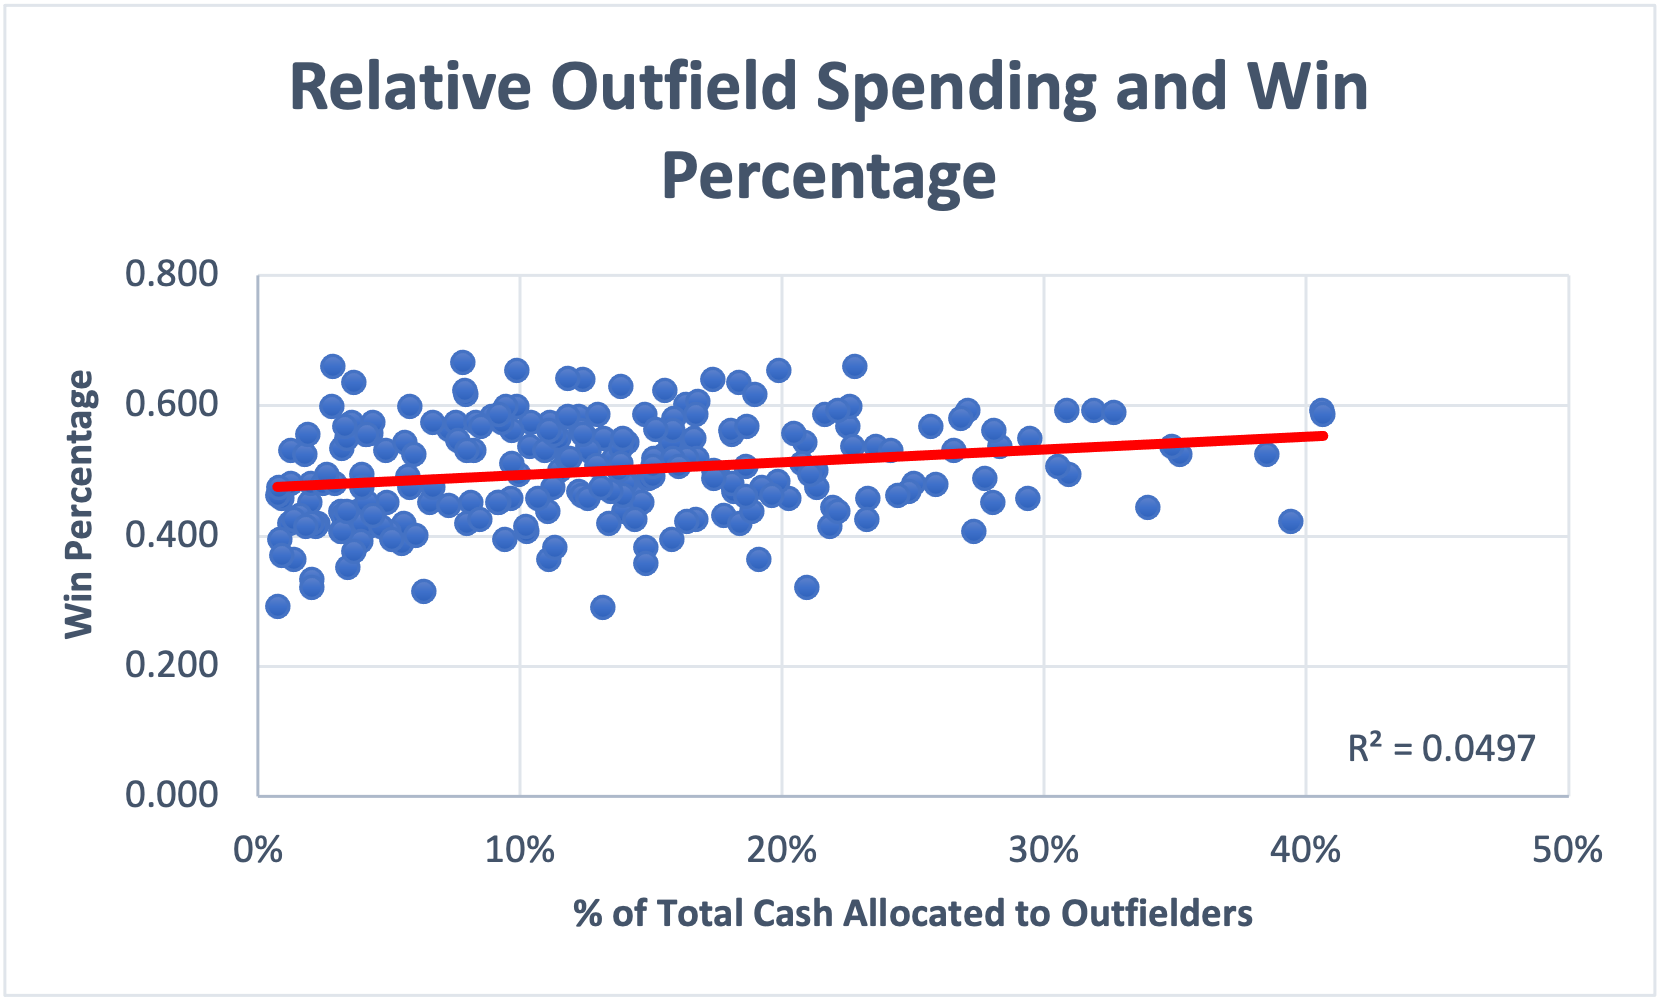
This is again small, but actually above the other relative number margins by a decent amount. Likely though, as stated earlier, just allocating extra percentage points is not enough. The teams that physically can spend more money on these players are way better off, with increased adjusted spending of this variety accounting for a 10.9% positive fluctuation in Win Percentage and 10.4% in run differentials. The run differentials were also much closer to the win percentage in this segment, which suggests that outfielder spending is not only more efficient but sustainably better.
Starting Pitchers
The number of pitchers a team had is relatively unimportant, but the percent designated and the nominal amount spent did matter. These players are known to control a huge aspect of their games, and the numbers showcased this.
Having the biggest overall impact compared to any category (including the next-up relief pitchers), 14.3% and 14% of win percentage and run differentials (respectively) could be owed to allocating additional percentage points of a team’s cash to starting pitching.
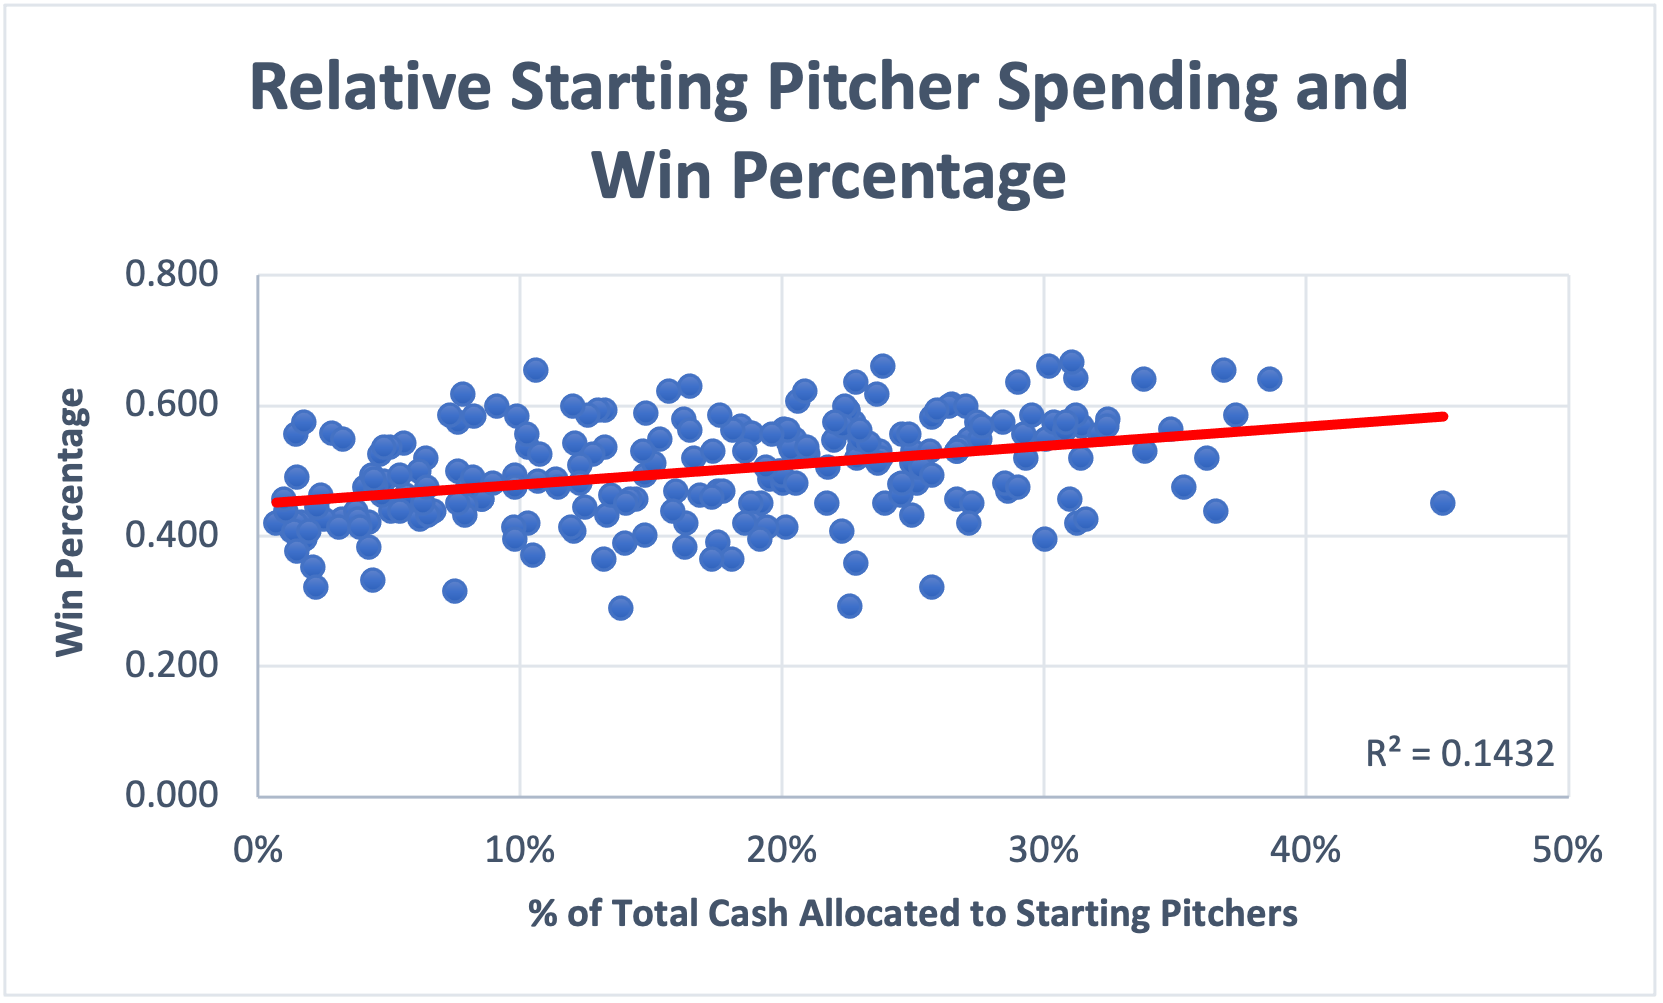
The nominal amount, unsurprisingly, yielded better results. 19.2% of increased win percentages and 16.6% of increased run differentials can be owed to just spending more adjusted dollars on starting pitchers. With how big of an impact the differentials between spending on starting pitchers cause, teams should look to allocate additional percentage points as well as dollars to this area.
Relief Pitchers
A reliever’s ability to produce value in short stints is crucial to overall team success, as starters cannot simply cover the innings they used to do. Throwing harder and putting more stress on their arms, relief specialists who cover lots of high-leverage innings can make or break a season. This is evident through the statistical findings between team win metrics and pitcher spending.
Like most of the results, simply allocating a couple of extra percentage points of cash for a given team doesn’t pair that well with success – 4.4% of run differentials and 2.5% of winning percentages vary due to this extra allocation for relievers.

However, paying possible premiums for relief pitchers could be beneficial – 9.8% of the fluctuating winning percentage and 10.9% of the fluctuating run differentials are estimated to come from increased adjusted reliever spending according to the regression results. They may not be the most important category to focus on, but throwing some extra cash at them may be worth it.
Advice to Follow for Spending Optimization
Keeping some of the findings above and the shortcomings that followed in mind, these guidelines are meant to provide a basic look at how portfolio theory can be applied to the results.
Using More of a Given Position Player Does Not Matter
Almost no correlation was evident when cycling through more batters or pitchers led to better team success. It had a minute effect that can be explained away by variance, which also shows that the tunneling moves these teams are doing don’t add much value in the aggregate. One could argue that before the rule that limited constantly sending players up and down, teams were primarily using the same guys. Although, these teams would still be signing more players throughout the year compared to their opponents that did not, as the very nature of the constant tunneling of major league-minor league action warrants an excess of players used on a major league roster. There was a similar finding among all position types, as no excess of one position provided a clear advantage over the other – at that level, the possible extra replacement-level player isn’t going to make a big impact.
With those conclusions, it is safe to say that teams should not worry about adding more positions than others to increase their performance. Obviously, they should still fill holes in their roster as needed. If they believe they might have to use 5 pitchers in a given night, they should stock up. If a star shortstop just got injured, they should call up another one. But employing more players in a given position (above the normal expectation) will not provide any type of advantage to winning extra ball games. Consider it a non-factor in crafting teams.
Hitting or Pitching – What Spending Needs to Be Focused On
It has been a very long dilemma on whether teams should focus more of their money on hitters or pitchers. Both aspects are needed, but could possibly spending on one side over the other provide an advantage? Not really. When comparing the spending habits of pitchers and hitters, the rates at which their additional spending increased overall team performance were pretty much even. The r-squared scores for win percentages and run differentials for both types of players hovered around ~0.20, making a clear difference not evident.
With no clear difference, there is no reason that teams should be breaking from the regular averages of spending on pitchers (29.24%) and hitters (37.76%). A team that deviates too far from these averages can be misbalanced, putting them in a position to fail against their competition that did adjust their spending properly. Remember, both factors equally had decently high r-squared scores with team success. Teams should again spend as they feel necessary, but focusing on one versus the other won’t likely lead to an advantage, making sticking with the average spending rates a safer hand to play.
Choosing to Spend on Certain Position Types Over Others
Spending on more than the average for either pitchers or hitters hasn’t made much of a difference in team success, but spending on certain position types is a bit different. When comparing every group against one another, both the relative and adjusted cash numbers for starting pitchers had very high r-squared scores when compared to overall team success. Paying a premium for starters has seemingly yielded positive results, and may be worth investing into.
The other groups did not stand out as much, except for catchers. As mentioned earlier, the average number of catchers on a given active roster took up about 3.96% of cash spent, but their effect based solely on adjusted cash delivered a higher percentage. Increased catcher spending led to a 9.1% in win percentage and 5.1% in run differential fluctuation, suggesting that catchers are undervalued as a whole and/or provide some multiplier effect on a given team. If that vast multiplier effect exists and these both stand to prove causation above regular variance, heavy investment into the catcher position would be recommended.
Concluding Thoughts
The findings within these pages showed some exciting results that were not expected whatsoever. Perhaps, this is not a good thing. In summarizing my thoughts, I want to emphasize the importance of not taking these numbers as absolute. They should not be over or under-emphasized, but rather just taken as these numbers appear. None of these findings warrant incredibly strong action. But, that doesn’t mean they can’t be clarified.
As a whole, the amount of pitchers or hitters used during the season generally does not matter. These players often do not provide enough value to make a serious impact; quality is still more important than quantity. In regards to spending on pitchers versus hitters, pitchers carried a slightly higher correlation, but not enough to promote any type of team reallocation on one side or the other. Breaking the positions into groups, increased starting pitcher spending seemed to yield the best overall outcomes, making investing in them a somewhat safer bet. Catchers also proved to have a high ceiling of affecting outcomes, which should warrant future research and possible early reallocation into the position.
Every team is stuck with limited resources and the never-ending want of championships. Positional rostering may not have a useable effect, but readjusting spending towards some of the positions could provide the slightest edge. The degree of impact on actual implementation cannot be known until it is tested over a large sample size, but an edge likely does exist (with starting pitchers and catchers, if anything, in regards to their correlation numbers). Oftentimes, teams only need that slight edge to gain that single additional win that grants them a postseason birth. With the right money in the right places (the successful use of the portfolio theory aspect) along with further and deeper research into the subject with more tests than provided, readjusting spending could be a new way to add some extra small success.
