





Welcome to Week 21 of our Patience or Panic series! Here, we look at three players with disappointing seasons thus far, analyze what’s gone wrong, and consider whether things might soon change. Should you, well, be patient or panic?
Ben Rice, 1B/DH, New York Yankees
Every superhero needs a sidekick. Batman has Robin. The Flash has the lazily named Kid Flash. Captain America had Bucky, who became the Winter Soldier, who became Captain America, and… It’s complicated. Comics are. The point is, baseball, like all sports and funny books, is no different. Every star has his second fiddle. Just ask Ben Rice, the understudy to Yankees superstar Aaron Judge.
Except early this season, Rice was no understudy. He was entirely Judge’s equal. From the season’s start to May 31, Rice was hitting. 306/.397 /.658 with 17 homers, 44 RBIs, a 1.056 OPS, and a 190 wRC+. The latter led the Majors. Statistically, there was no one better than Rice. Close to him, of course, with Yordan Alvarez nipping at pixie boots, but none better. Not even Judge. Rice stepped out of The Captain’s caped shadow to be his own man — very Dick Grayson of him.
Then came a death in the family. Okay. Maybe not a death. Judge went down. Batman’s back wasn’t broken, but he did suffer a stress fracture in his right rib. The injury’s kept Judge sidelined since and left Rice, his Robin, alone. At first, he couldn’t shoulder the load. In June, Rice posted an 82 wRC+. July was much improved, with a 162 wRC+. August, though, has been a crowbar to the body. Through 13 games, Rice is hitting .102/.228/.245 with a .473 OPS and 38 wRC+.
Rice’s August wRC+ is 169th of 189 players; His OPS is 173rd; His batting average is 188th, second to last. Carter Jensen is the only one with a worse average this month than Rice. He went from being one of the best hitters in baseball for two months to one of the worst this month.
This isn’t an August-only problem. Over the last 30 days, Rice is hitting .147/243/.304 with a .547 OPS and 56 wRC+. He hasn’t sat comfortably on Gotham’s gargoyles for some time now. And it invites a question that plagues every sidekick: Can you be your own hero? For Rice, the answer seems to be a somewhat no. But what’s actually changed? What’s happening? What’s reduced Rice to Jason Todd’s bleeding and bruised image in Batman #428?
Part of Rice’s problem is himself. Before July 19, the start of Rice’s prolonged slump, he had a 23.1 K%. He was disciplined, keeping himself in check, and walking 11.9% of the time. He wasn’t overextending himself. Since July 19, Rice has. Over his last 27 games, Rice has a 32.2 K%, a 9.1% increase. Rice has four three-strikeout games and six two-strikeout games in that span. In other words, he’s striking out at least twice in 37% of his last 27 games. Futility has come in bunches.
Sliders seem to be Rice’s equivalent of the Crown Prince of Crime these last two months. Previously in control against them, striking out just 27.3% of the time, he’s turned loose as of late. In July, he sported a 41.7% K rate on all sliders, and in August, it rose to 66.7%. Holy increasing K rate, Batman! Interestingly, Rice’s chase rate on sliders is much higher in July than in August, with a 44% chase rate in the former versus 28.6% in the latter. He may be aware of the issue. Curbing it, however, is a different story.
Rice has seen similar troubling trends against four-seamers and sinkers to some degree. He had a 36.8% K rate on four-seamers in July, up from 25% in June, and has a 33.3% K rate in August. Speaking to these issues, Rice has more strikeouts against four-seamers this season, 29, than he did all of last season, 26. He’s also seen his Whiff% on four-seamers balloon from 11.5% to 21.2%. Yet it’s not a matter of volume or sample size. Rice is actually seeing fewer four-seamers in 2026, down from 27.5% in 2025 to today’s 22.1%. As for sinkers, Rice’s K rate rose from 20% in June to 30% in July. That number’s come down drastically to 16.7% in August, a step in the right direction.
To some extent, this is leading to something of a power dampening for Rice. He’s hit just four home runs since July 19, equaling a 3.5 HR%. Before then, he hit 29 over 92 games, good enough for a 7.4 HR%. The Boy Wonder hasn’t played at all like a Bronx Bomber.
Yet with all these knocks come a few caveats. Most importantly, Rice is getting unlucky. Somewhat. His xBA since July 19 is .219, a far cry from his actual .147 batting average. Likewise, his xSLG is .426 compared to his true .304 mark, and his xWOBA is .323 compared to his wOBA of .248. This all corresponds with another piece of data. According to Statcast, Rice has a HardHit% of 53.8% since July 19, 12th-best in the Majors during that span. Bear in mind, before July 19, Rice had a HardHit of 48.1%. There’s juice aplenty in this bat.
The Verdict: Keep believing in Rice. Even if he’s not the heir to the cowl, he still sports an .821 OPS over 306 career games. Don’t vote him dead.
Ernie Clement, UTIL, Toronto Blue Jays
Toronto’s Ernie Clement has had a pretty crazy last 12 months. This time last year, Clement cemented himself as an everyday starter, hitting .281 with a .722 OPS over his first 123 games of 2025. A month and change later, Clement was nominated for two Gold Gloves, one for his play at third base, another as a utility player. A month after that, in October, he broke the record for most hits in a single MLB postseason. He left the nest of obscurity and flew into the record books. His 22 singles would also set a new postseason record. Though the Jays didn’t win it all, Clement could console himself. He hit .411 in the playoffs with a .977 OPS.
2026 has only continued the craze. Clement became an All-Star. Not a he’s-only-here-because-someone-else-got-hurt All-Star. He was the Phase 1 Leader of All-Star voting. Clement got more votes than anyone in the American League. Granted, that ballot was based on fan votes, and Clement had all of Canada behind him, but he wasn’t unworthy of their love. In the first half of the season, the utilityman hit .296/.318/.433 with a 109 wRC+. Within the AL, his first-half average was fifth-best. On top of that, he’d hit eight home runs, 32 RBIs, and played in 93 of Toronto’s 96 games. He was a workhorse, always there, always playing well.
Clement’s availability hasn’t changed. His quality of at-bats? Well… Since the All-Star break, Clement is hitting .234/.269/.306 with a .575 OPS and a 60 wRC+. His bat-to-ball abilities have diminished; His wings have been clipped. Time continues to challenge our perceptions.
What’s challenged Clement most lately is regression. Like our next player, Clement’s makeup doesn’t reflect his previous feathers. Take a look at his Baseball Savant Page. A sea of blue awaits you there. That’s not a joke. Of the 13 percentile rankings Savant presents up front, Clement has eight rankings colored like the deep blue sea. First percentile in xWOBA, ninth in xSLG, third in Average Exit Velocity, sixth in Barrel%, first in HardHit%, fourth in Bat Speed, first in Chase %, first in BB%. Each of these is below the tenth percentile. Most aren’t even close.
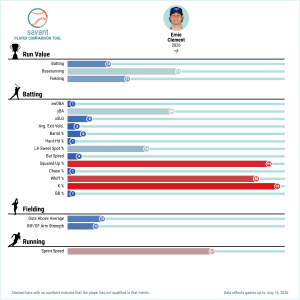
The only places Clement is exempt from this ocean are his Squared-Up%, Whiff%, and K%. He is elite at the first and last. And it’s from this that Clement derives value. He will chase, but he won’t strike out. He won’t hit the ball hard or barrel it, but he’ll square a ball up as good as anybody. It’s Kwan-like. Clement’s success, like Cleveland’s Steven Kwan’s, flies in the face of what we perceive to be true. One can be a good, All-Star-caliber bat without what are deemed the most important stats: Barrel%, HardHit%, and Bat Speed.
Unlike Kwan, and this is where the two change flocks, Clement is lucky. He always has been. When Kwan struggled this season, hitting just .214 over the first three months, he still had an xBA of .248. So when Kwan hits .377 since July 1, it’s not entirely a shock. He’s done this before. His bat was merely dormant and damned. Clement, on the other hand, had a .257 xBA over the first-half of the season. The difference between his xBA and BA was the 13th-highest in all of baseball.
That’s doubly true with his slugging. Clement had a .345 xSLG compared to his actual .433 slugging percentage, the 10th-highest discrepancy between the two pre-All-Star. Things would turn around the other way. They had to, barring some ancient Canadian blessing.
Luck hasn’t since gone the other way. That, on top of everything else, is maybe the greatest cause for long-term concern. Clement’s xBA over the second half of the season is .225. His xSLG is .288. By all rights, he should be playing worse than he has been. He’s a nosediving pilot who can’t pull up.
Contributing to that, the infielder’s gone from a 22.4 HardHit% to a 14.9 HardHit%. Likewise, he’s gone from a 2.5 Barrel% to 2.0 Barrel%. When someone gets worse at what they’re usually already bad at, it’s not a good sign.
The Verdict: Sit this one out. Clement isn’t right. He hasn’t been in a month. Until he takes flight again, pursue offensive help from an Oriole, Cardinal, let’s say.
Tristan Peters, CF, Chicago White Sox
Tristan Peters, like Bob Dylan, came out of nowhere. The 26-year-old bounced around before finding his own Greenwich Village with the Chicago White Sox. Drafted by the Brewers, traded to the Giants, traded to the Rays, and then traded again to the White Sox. This last one was perhaps the most humbling. Peters arrived on the South Side for cash and a player who hadn’t even been named yet. He wasn’t a piece. He wasn’t even a prospect by that point. He was a warm body. And like Dylan, when he arrived in New York, he didn’t have a shirt on his back or a penny to his name. But Peters didn’t think twice.
By July, Peters was a piece. Moreover, he was an All-Star, a well-deserved one at that. In the first half of 2026, Peters hit .301/.345/.478 with an .832 OPS and a 133 wRC+. He led the White Sox in average and was third in OPS and wRC+. This once-hollow honor meant something, considering Chicago arrived at the All-Star break with the third-best record in the American League. If that doesn’t mean something, maybe this will: He was fourth in the AL in batting average, 16th in OPS, and 19th in wRC+. There was no idiot wind billowing his sails. Nothing undeserved. Peters earned it.
But now a hard rain’s fallen upon him. Since the All-Star break, Peters is hitting .182/.281/.273 with a .554 OPS and 60 wRC+. Among all 84 qualified players in the second half of the season, Peters’ .182 average ranks 79th. His 60 wRC+ is tied for 74th. Things have changed. He’s gone from one of the better bats in the American League to one of the worst in all of baseball. What happened? Has Peters turned back into a pumpkin? Another Guthrie-wannabe without a “Blowin’ in the Wind,” or is this just a simple twist of fate soon to be corrected?
That word, “correction,” might speak more to the answer than any other. Peters was not a highly regarded prospect. He had little pedigree. He also had little to show as a minor league player. Through five seasons, he posted a .777 OPS. In 2024, he posted a .746 OPS with a .238 batting average; His best batting average was .276, back when Peters was still in AA as a 23-year-old. For him to suddenly be a .300 hitter in MLB was preposterous. Sooner or later, someone must’ve known he’d regress in time.
Peters’ expected numbers confirm this. In April, Peters hit .273 despite a .242 xBA. In May, he hit .303 despite a .243 xBA. June is the only month where the eye test matched the results. Then, he hit .280 with a .284 xBA. He was actually unlucky for a change. No one saw it come this sharply or suddenly, but some return to the average was inevitable.
What isn’t, what’s firmly in Peter’s control is how he attacks the ball. Early in the season, when Peters was making his bones, he was swinging at a little more than half of all balls. Seriously. He posted a 56.3% swing rate in April, a 56.5% swing rate in May, and a 56.7% swing rate in June. Up, up, and up. Peters started reversing course in July. That month, he racked up a 52.9% swing rate. Thus far in August, he has a 44.9% Swing Rate. What are we seeing, my blue-eyed-son? A serious lack of aggression.
This also shows in other ways, most notably in his batted balls. At his best, Peters averaged 60 or so batted-ball events a month. Even in July, he registered 63. Thus far in August, Peters has 24 such events. Rational explanations might include a lack of playing time or the fact that we’re only halfway through the month. Both of these hold only marginal weight. Peters has played in 13 games this month, roughly half of his usual workload of 24-20 games a month. And even considering the calendar, it doesn’t explain why Peters’ numbers have been cut in third.
Occam’s Razor tells us to look for simplicity. Applying it to Peters’ problem takes us to one fact: His advanced stats aren’t those of a prolific hitter. He isn’t elite at anything. He’s in the 23rd percentile in Barrel%, the 13th in HardHit%, and the 17th in bat speed. He makes okay contact, strikes out a little less than the average hitter, and walks only a tidbit. Players with that profile don’t succeed. Not in the fashion Peters had.
The Verdict: If you’ve spent one too many mornings staring at a dud of a stat line, pull out. But do so with this warning. In August, he’s hitting .323 with a .949 OPS.
