


Here at Pitcher List, we have a suite of PLV metrics to study every event in a baseball game at the pitch level. Decision Value (DV) is our hitter swing decision metric. It takes inputs like pitch velocity, location, and movement, and tells us whether the hitter made a good decision to swing or take a particular pitch. This isn’t quite as simple as plate discipline; swinging at a Logan Webb sinker and pounding it into the ground is a bad outcome even if the pitch was a strike.
Instead, Decision Value rewards hitters for swinging at pitches they should be able to hit hard, and for taking pitches they’re unlikely to do much with. The flipside is that Decision Value punishes hitters if they don’t swing at pitches they should be doing damage on or do swing at pitches that are unlikely to generate quality contact. You can find a much more thorough introduction to PLV metrics and Decision Value here.
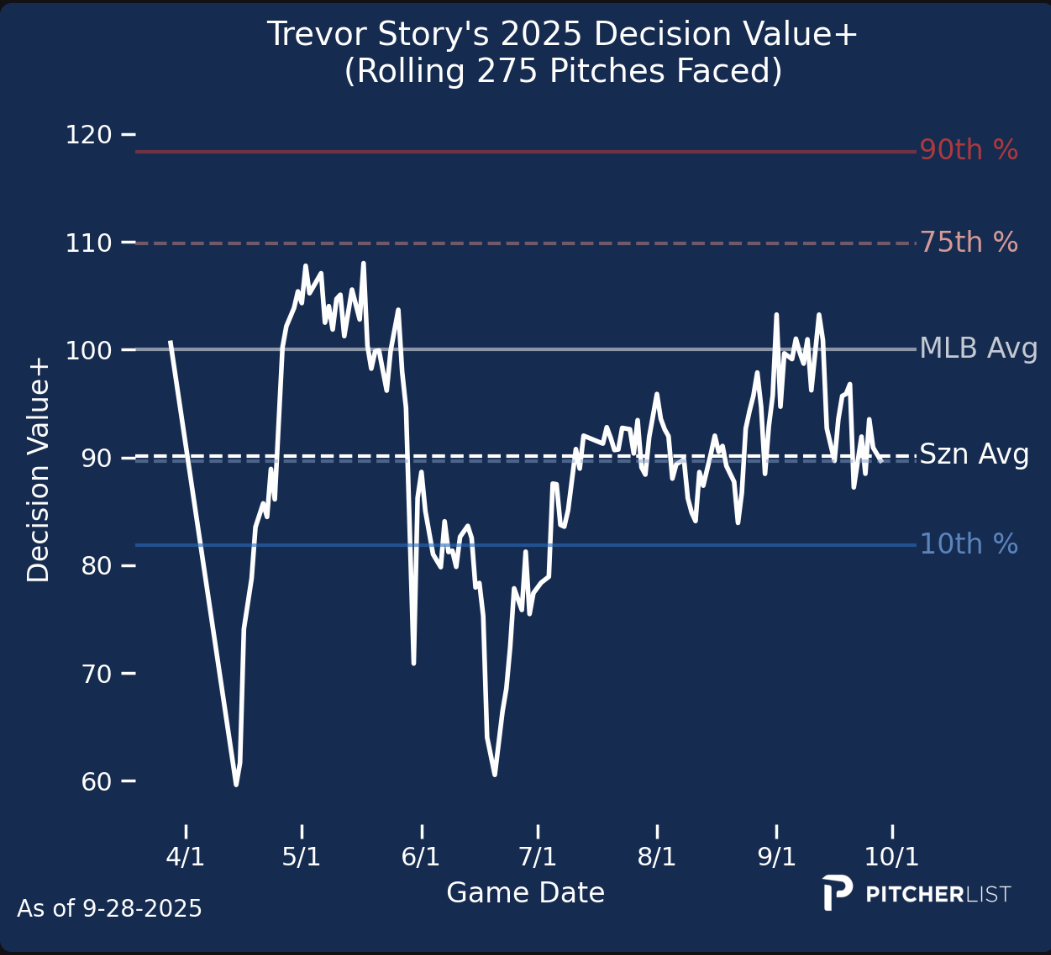
One of the advantages of pitch-level metrics like PLV is that hitters see many more pitches than they have at-bats or batted balls. This gives us a bigger sample to study earlier in the season and allows us to draw some meaningful inferences before other useful metrics come online. PLV starts to stabilize around 275 pitches into a season. Many hitters have seen 500 or more pitches at this point in the season, meaning we’ve now got enough data to suggest that hitters who have improved recently may have made meaningful changes to their approach.
I began looking at players by splitting the season thus far into two roughly equal-length periods. The first time period covered from Opening Day until April 14th, while the second time period comprised April 15th through May 11th. I then took every hitter who had at least 250 pitches seen in both segments, leaving me with 103 hitters to compare. Below is a list of the 10 hitters who improved their overall decision value the most between the two samples.
Trevor Story is the most improved player in terms of overall swing decisions over the last 3+ weeks. Story has never been famous for his plate discipline and command of the strike zone, but the start of this season was a particular struggle for the Red Sox shortstop. In his first 17 games of the season, Story struck out 24 times against a single walk, leading to a .192/.197/.274 line. Story was hardly alone in his struggles for the Red Sox at this point in the season, with 5 other regulars also contributing a wRC+ of 61 or lower. Still, Story was making uncharacteristically poor decisions at the plate. He chased nearly half of the pitches he saw outside the zone and attacked only 64.7% of the strikes he saw, which would be the lowest rate since his rookie season in 2016. While Story has historically had below-average DVs, he didn’t have this severe an issue throughout the 2025 season.
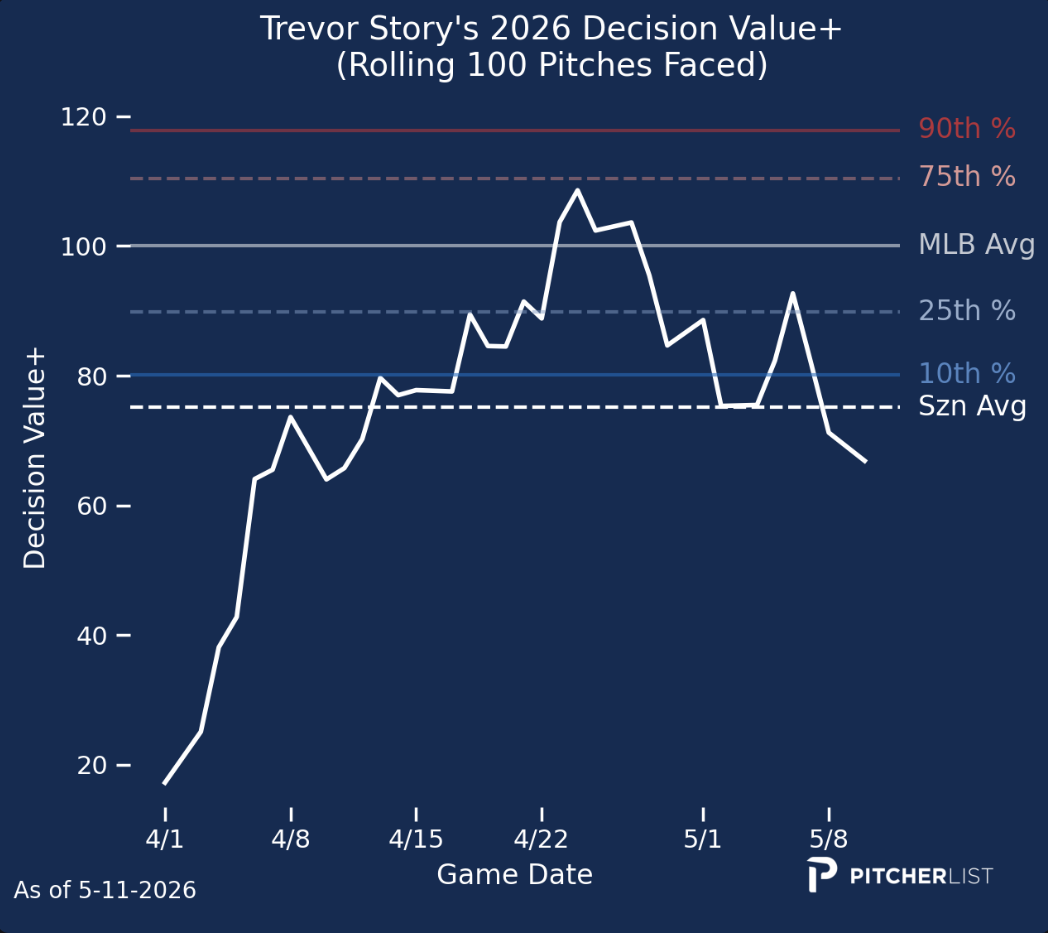
Recently, Story’s decision value has improved but remains a bit below his normal 25th percentile-ish range. While Story is still chasing a lot, he’s reduced his chase percentage by about 6 percentage points to 41.5% since April 15th. He’s also been more aggressive in the zone, increasing his zone swing percentage by a bit over 9 percentage points to 73.9%. His zone swing percentage is now similar to his career rates, which have always fluctuated around 70%. His chase rate remains an issue, though, and one that has grown since leaving Colorado. In his first five seasons with the Rockies, Story chased around 28% of the time with a slight increase to 30.5% in his final season at Coors Field. Since joining the Red Sox, he’s consistently chased more frequently, with only a small, 43-game sample in 2023 at 30.6%. In his limited 2024 appearances and full season 2025, Story chased around 35% of the time. Despite his improved decisions of late, Story’s chase rates suggest you should shade down your expectations for his batting average and OBP. A variety of projection systems have Story down for averages in the .233-.244 range and OBPs in the .290s, and I’d be inclined to agree. Rather than his .263 average of 2025 being an asset, you ought to now consider Story a batting average drain, even disregarding the tough beginning of the season.
A pair of Chicago White Sox, Miguel Vargas and Munetaka Murakami feature as the biggest improvers on in-zone swing decisions. Murakami has been every bit of what we expected, good and bad, in his first season in the US. Murakami is highly selective, bordering on passive at the plate, ranking 29th of 176 qualified hitters in swing rate. His improvement in zDV is driven by being more aggressive in the zone. In the first part of the season, Murakami swung at only 57% of strikes and chased on 20% of balls. More recently, he’s swung at two-thirds of pitches he’s seen in the zone while only increasing his chase rate by about 4 percentage points. Murakami’s well-known contact issues have put him in a bit of a Catch-22, however. As he’s increased his zone swing rate, his zone contact rate has fallen from 77.9% to 66%.
Vargas, instead, is a very different kind of hitter. Despite increasing his swing speed from a fairly pedestrian 70.6 MPH in 2025 to a solidly above-average 73.6 MPH this year, Vargas has maintained an excellent 86.6% zone contact rate while improving his out-of-zone contact rate to 83.3%. Vargas and Murakami do share an aversion to chasing, with Vargas chasing only 16.1% of balls this year. Vargas is also more aggressive than Murakami in the zone, swinging at 70.6% of strikes so far this year. This was not always the case this season, as Vargas started the year with a 17% chase rate and a 64.9% zone swing rate. Of late, he’s somehow slightly improved his already elite chase rate, swinging at only 15.4% of balls while increasing his zone swing percentage to 74.4%. The excellent swing decisions, combined with his very good ability to make contact and solid power, have led to an extremely strong .271/.400/.576 line in recent weeks after relying largely on walks for his .163/.313/.315 early-season line.
Bo Bichette is our biggest improver on out-of-zone swing decisions, with the aforementioned Story checking in third. Bichette has relied on his elite contact ability to offset fairly poor swing decisions throughout his career. Bichette’s recent-year contemporaries with an 88.8% zone contact percentage include players like Justin Turner, Brian McCann, and Howie Kendrick. Turner and McCann both have career chase rates below 30%. Kendrick’s 32.9% career chase rate is a bit closer to Bichette’s 36.9%, but still not quite there. Among these players, Turner and McCann consistently ran swinging strike rates below 10%, with Turner at just 6.8% for his career. Instead, Kendrick regularly ran swinging strike rates between 9 and 10%, and occasionally higher. Bichette is at 10.7% for his career, albeit lower in 2025 and 2026 than earlier years.
Bichette has improved from an early-season 44% chase rate to a more recent 36.3% chase rate that is more in line with his career numbers. It’s easy to imagine that Bichette could have been pressing at the plate due to the combined weight of his new contract and the Mets’ extreme early-season struggles. A Bichette who is only slightly below average in terms of swing decisions can still be a very strong offensive player, thanks to his still elite contact ability. It hasn’t quite shown up yet in his performance, as his BABIP has dropped from .291 to .234 despite his much better swing decisions. The unlucky batted ball outcomes have masked real improvements in what Bichette can control at the plate. His expected statistics yield a .286 xBA and .420 xSLG, good for a .331 xwOBA, all of which would be much closer to his career norms. Mets fans and fantasy managers should be patient, but this could also be a buy-low opportunity if a fantasy manager is frustrated with Bichette’s lack of early-season contributions to their roster.
Without getting into a full analysis, Taylor Ward’s extremely unusual season bears mentioning. Ward has improved his out-of-zone swing decisions from elite to otherworldly of late. He’s leading MLB with a 10.9% chase rate, nearly 4 full percentage points lower than Trent Grisham in second place. Ward and Grisham are also the two most swing-averse hitters overall, with Ward again swinging about 4 percentage points less than Grisham (28.9% to 33%). Ward has always had strong chase rates in the low-20 percent area, but has cut down on his zone swing rate from the mid-60% range from 2020-24 to 53.7% in 2025 and 48.2% this year. Ward and Grisham have both had strong zone contact rates for their career, but have improved to around 93% this year. Putting Ward’s season together, he’s produced an elite 139 wRC+ off a 21.5% walk rate and just a .115 ISO. I can’t imagine this continuing for an entire season – shouldn’t pitchers eventually just make Ward beat them? Thus far, though, Ward is among the most interesting hitters to track in MLB.
