After quietly posting a 3.4 fWAR in his 2018 rookie season (in which he also had a solid, but unspectacular .273/.357/.400 slash line with 11 home runs), Brian Anderson emerged as the first true “keeper” for the Miami Marlins in their latest rebuild. Anderson’s outstanding defense at both third base and in the outfield would likely keep him relevant in Miami for a while, but while his bat wasn’t bad by any means, there was definitely room for improvement. Although he wasn’t as good in the batting average and on-base percentage departments, Anderson did improve overall in 2019, with a .261/.342/.468 slash line with 20 home runs and a .342 wOBA in 2019, despite playing 30 fewer games than he did a season ago.
While improvements in the power department were the norm for a lot of hitters in 2019, this jump in the power department from Anderson has perhaps been a little overlooked. On the surface, nothing about his overall slash line will stand out. It’s not bad, but it’s not great either, and for fantasy baseball purposes, isn’t one that usually gets drafted all that highly—unless you’re getting some steals to go along with it. Let’s face it, a 20 homer, .260 average hitter from one of 2019’s weaker offenses is not going to generate much attention. It’s totally understandable, but at the same time, I keep coming back to Anderson and remain intrigued by him. Most of that intrigue comes from this:
| Split | AVG | OBP | SLG | wOBA | wRC+ |
|---|---|---|---|---|---|
| April-May | 0.232 | 0.313 | 0.350 | 0.288 | 79 |
| June-August | 0.285 | 0.366 | 0.563 | 0.385 | 142 |
That is a real night and day difference from the first portion of the season to the latter part. While a late-season injury cost him the month of September, this is quite the turnaround. When Anderson was written off in a lot of places after this slow start, he quietly was one of the league’s better hitters from June through the end of his season in August. Anderson was consistently towards the top of the biggest offensive improvers from the first half of the season to the second one. Granted, he had an easier way to get there considering his lackluster numbers in the first half, but this is still an improvement that I must take seriously, and one that is worthy of a closer look.
Considering his overall season performance, it appears on the surface that Anderson should be a fine player with a solid, reliable floor; considering where he is being drafted in most formats, that should provide a nice return. However, the jumps in performance Anderson had in the second half of 2019 make me believe that there is room for some more. I don’t think that a 30 home run season (in a full 162 games of course) is out of line. In the offensive environment of 2019, it doesn’t seem all that crazy considering he got closer than most would expect, hitting 20 in just 126 games despite early-season struggles.
Perhaps I’m getting too far ahead of myself. After all, a strong couple of months on its own shouldn’t be enough to make that judgment, so I guess I should explain myself. I’ll start by explaining what it is about Anderson’s profile makes him intriguing to me in the first place.
First and foremost, Anderson has been continuously trending up in some key offensive indicator metrics since making his debut in 2017, as shown below:
| Season | PA | AVG EV | AVG LA | Hard-Hit% | Barrel% | GB% | LD% | FB% |
|---|---|---|---|---|---|---|---|---|
| 2017 | 95 | 87.7 | 8.5 | 38.6 | 5.3 | 50.9 | 29.8 | 12.3 |
| 2018 | 670 | 90.2 | 8.7 | 42.4 | 5.8 | 52.3 | 23.3 | 18.8 |
| 2019 | 520 | 89.9 | 11.1 | 45.7 | 8.9 | 45.7 | 23.9 | 24.1 |
While his average exit velocity remained pretty much constant from 2018 to 2019, this is an overall offensive improvement from Anderson. Most notable here are the improvements in his batted-ball distribution. Anderson was still mostly a groundball hitter a season ago, but his groundball rate has trended down to a rate that is right in line with the league average, with more fly balls to go along with it. With a 24.1% flyball rate, Anderson all of a sudden ended up with a rate that is above the league average, which also explains the increase in average launch angle-a mark that improved as the season went along, which matches up well with his increases in the power department:
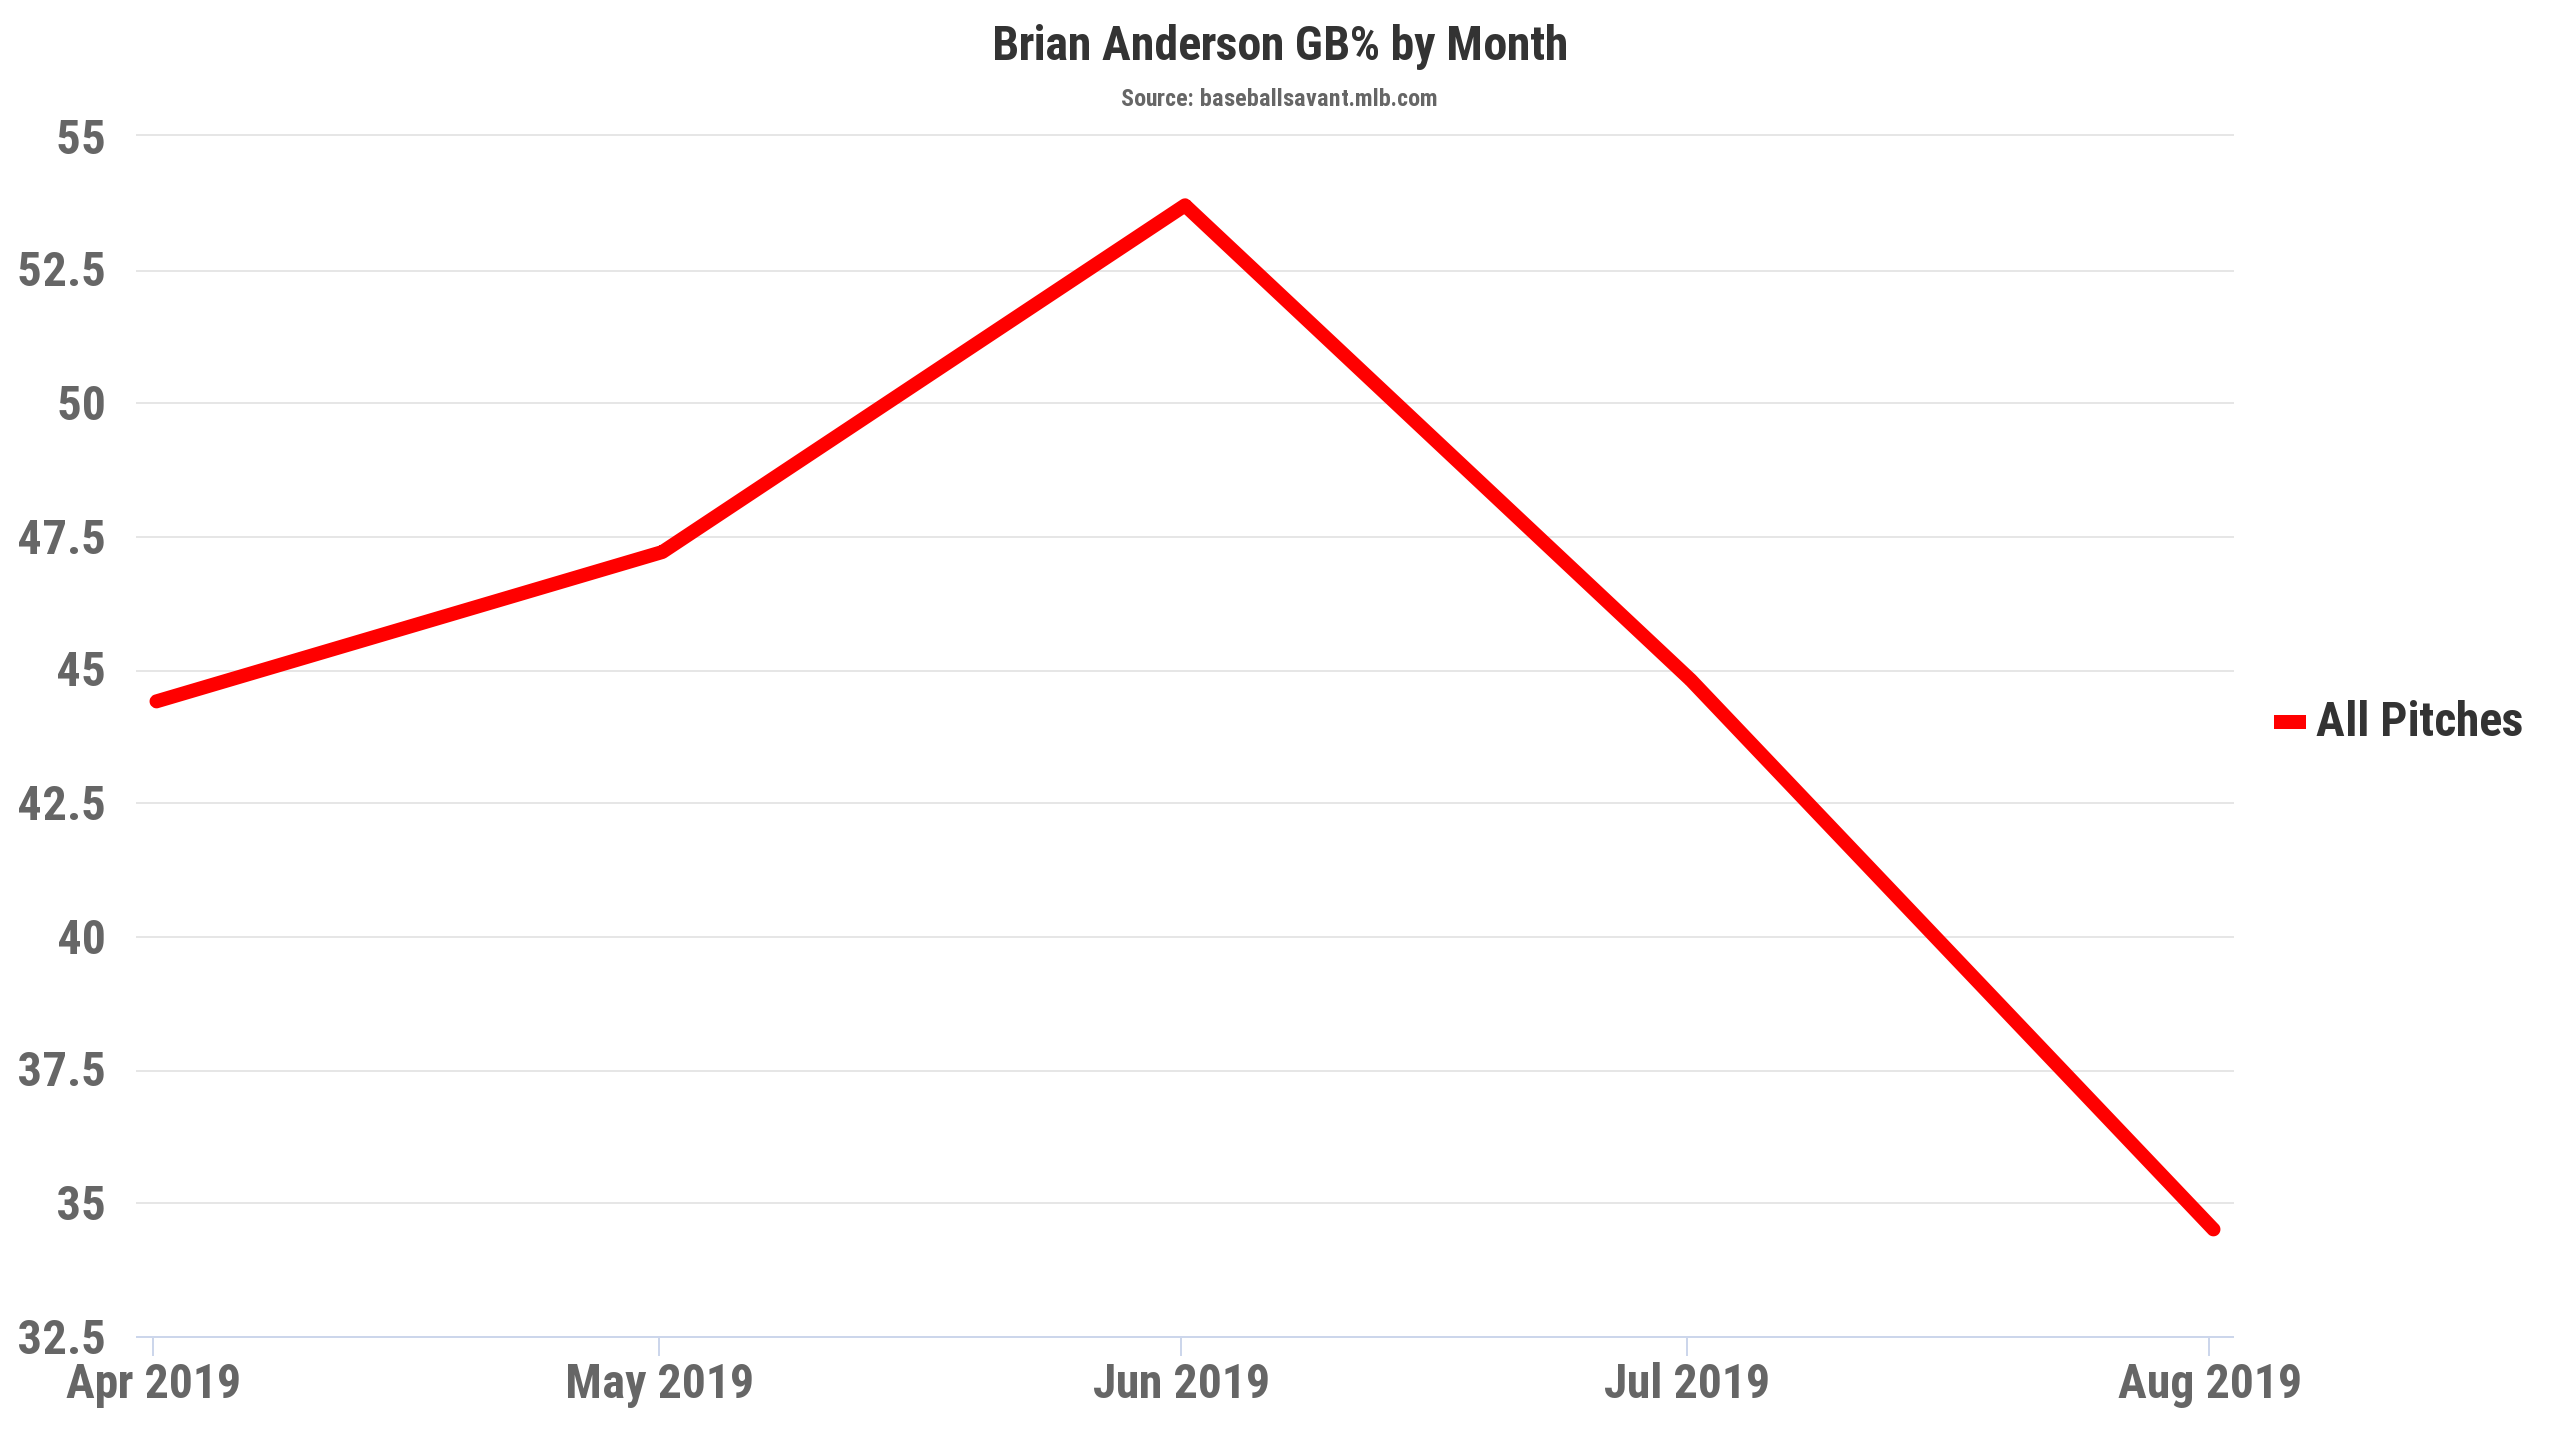
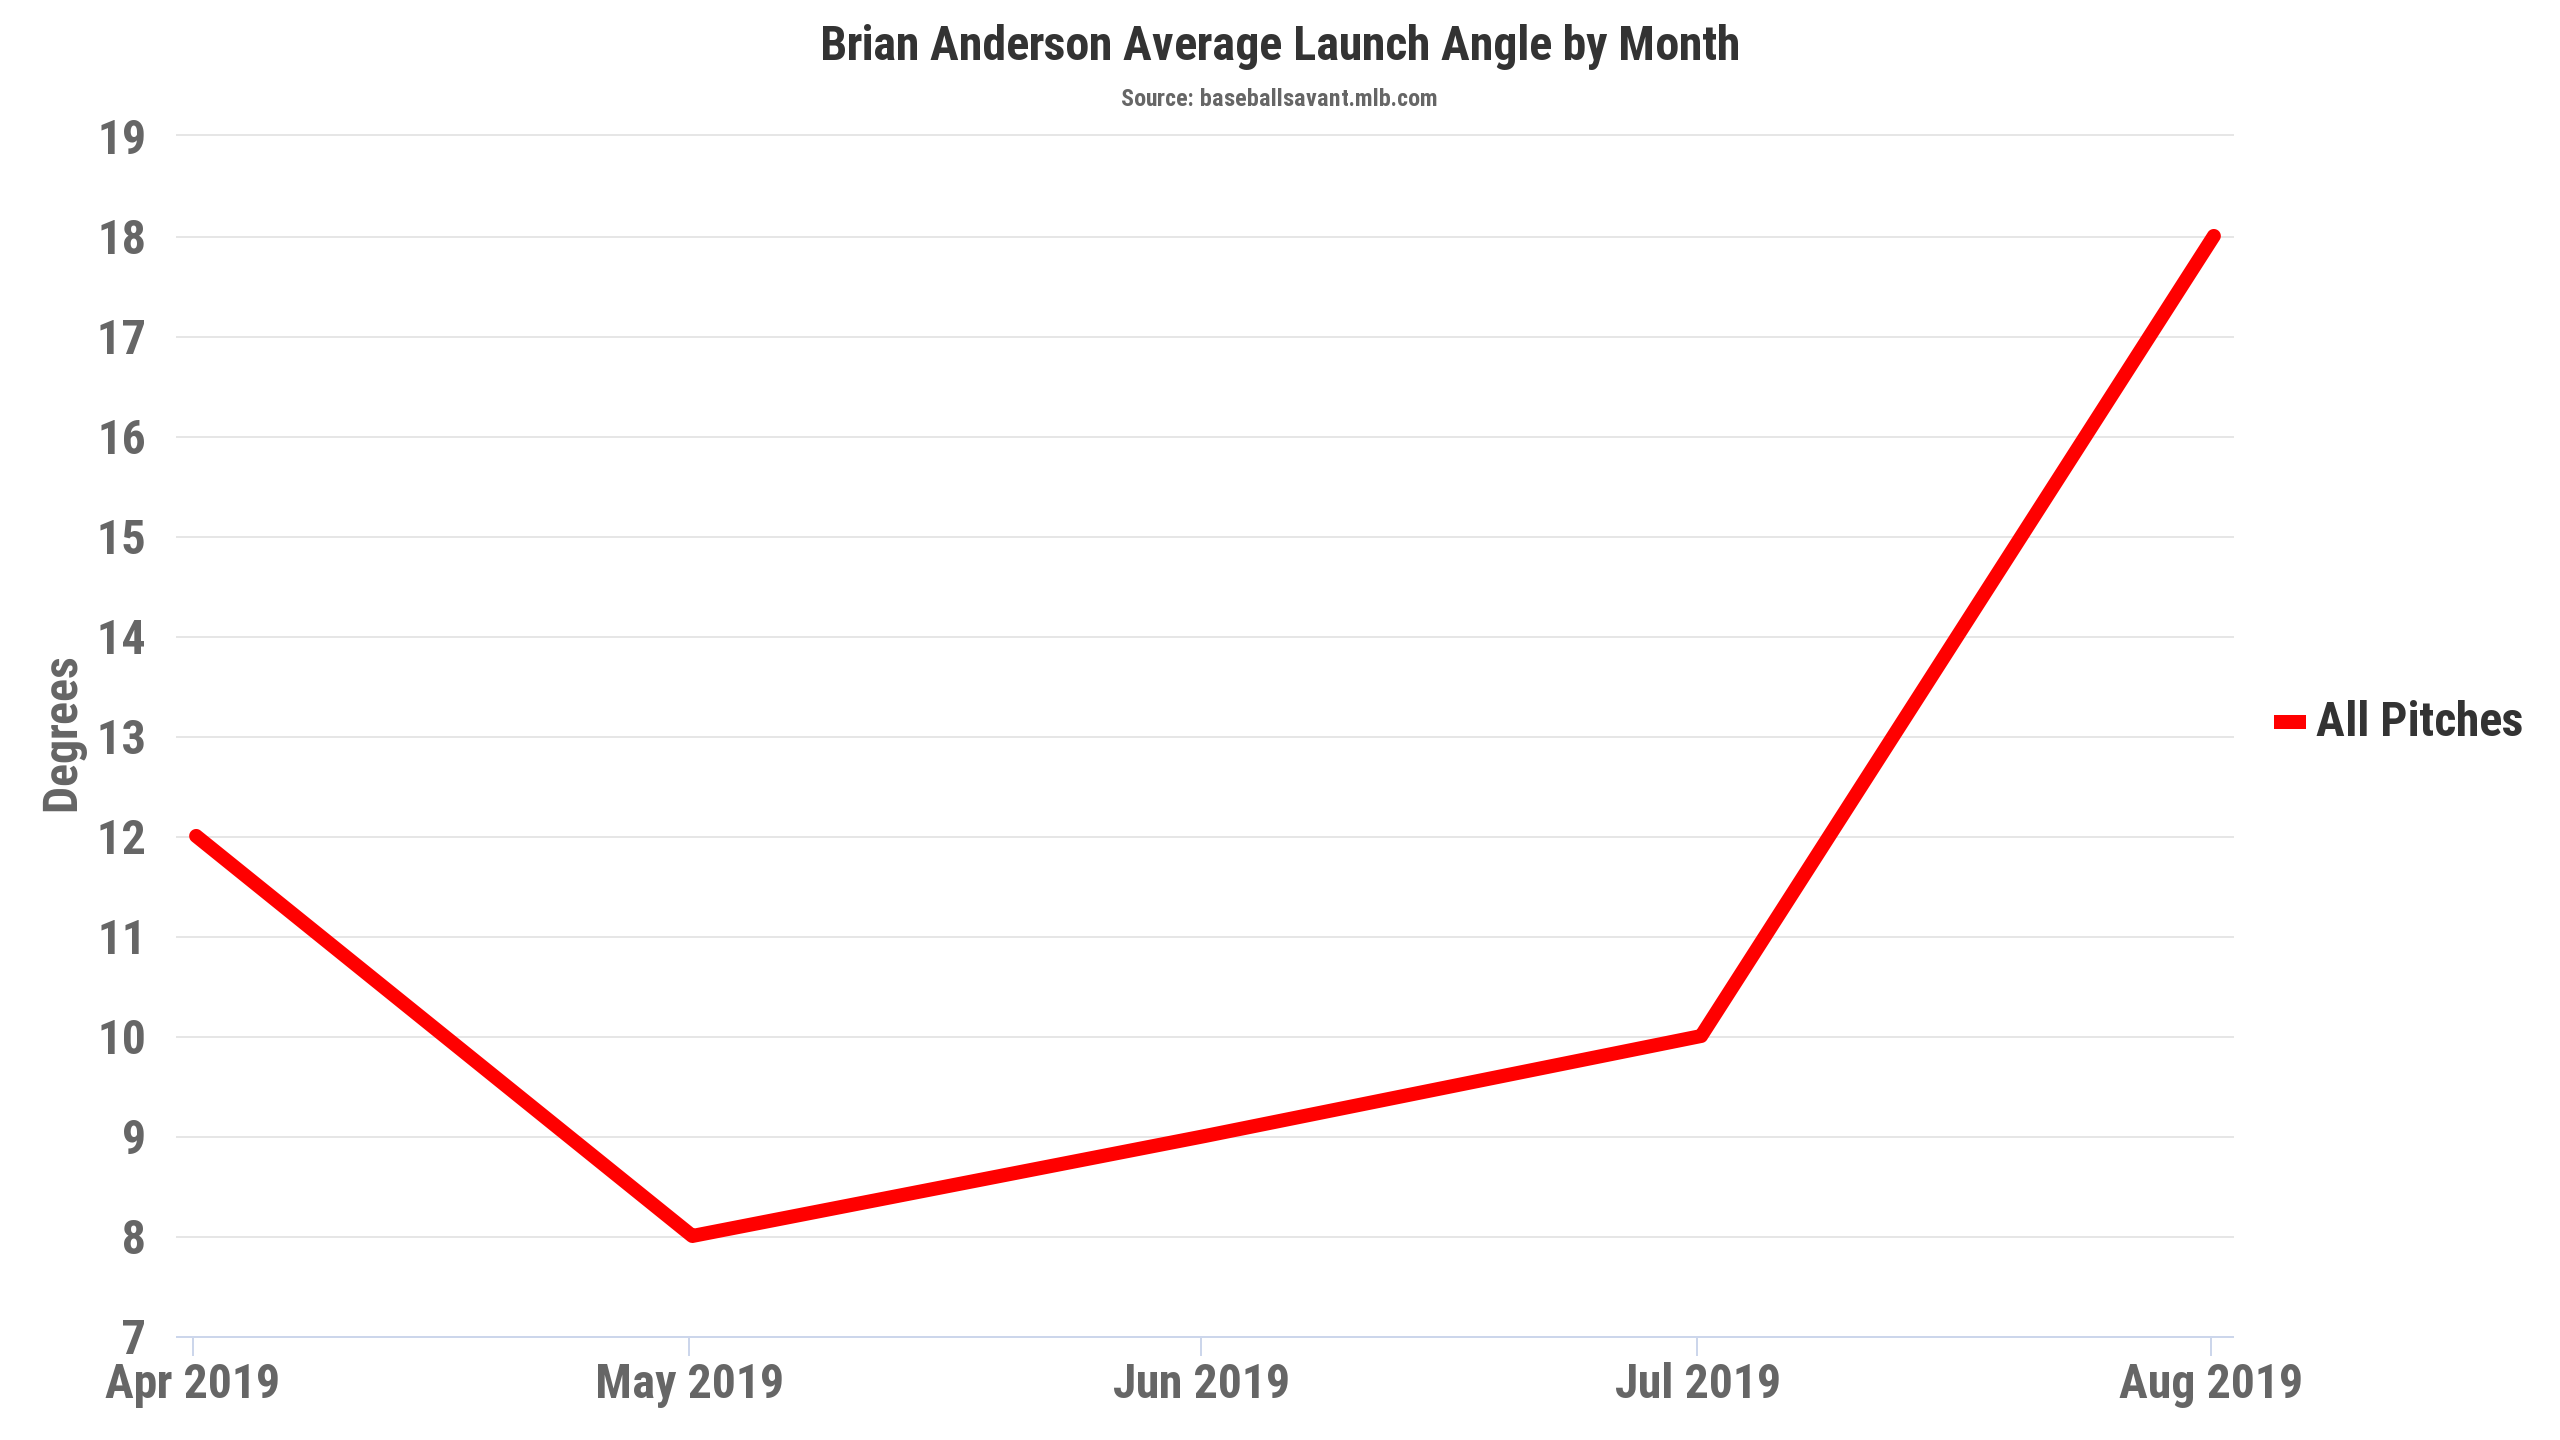
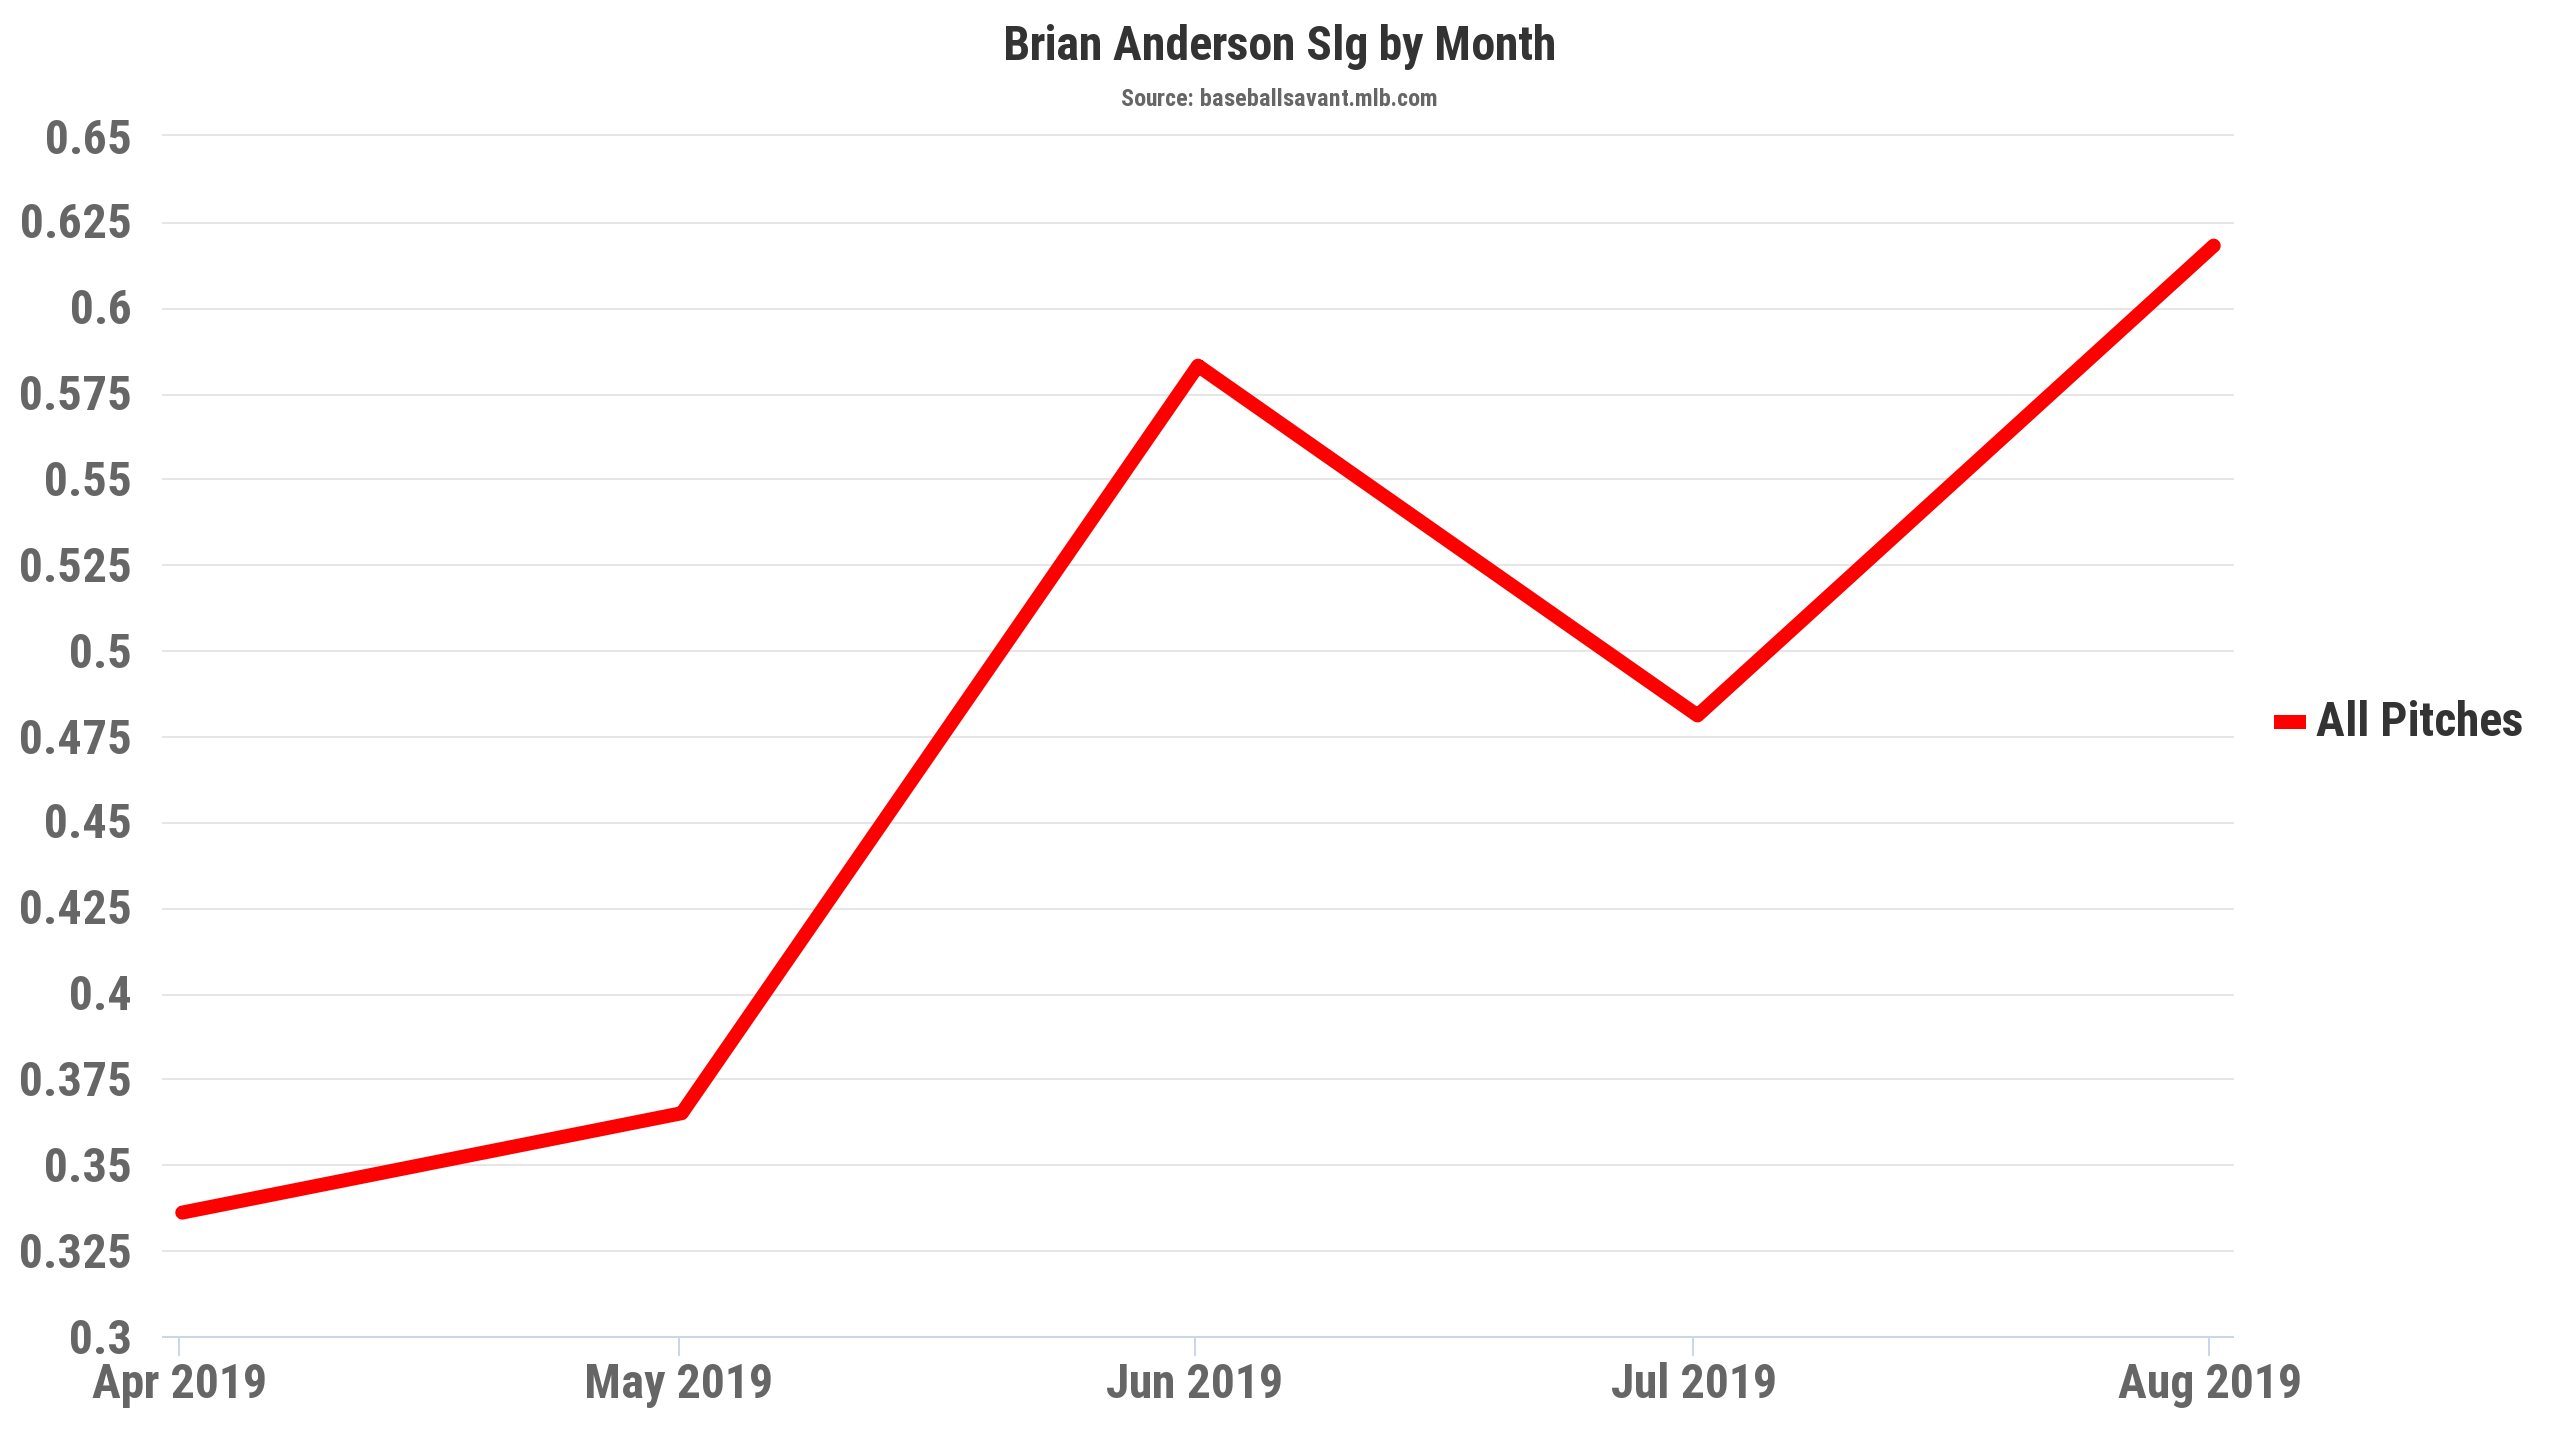
This certainly seems like a good recipe for a breakout in the power department and gives me confidence that this wasn’t a flukey performance for a couple of months, but rather a tangible improvement. It seems simple enough: Hit the ball hard and keep it off the ground and good results should come, and that’s pretty much what Anderson did en route to his strong second-half performance.
Let’s go a little deeper though and add some more context to these numbers. Let’s start with that hard-hit number. At 45.7%, Anderson’s mark is good enough to land him in the 86th-percentile, and 37th among all hitters with at least 300 plate appearances. This makes Anderson, perhaps, one of the league’s biggest surprises in this department, as most would not expect him to end up in that range. For additional context, that 45.7% mark is right in the same neighborhood as perennial sluggers Cody Bellinger and Bryce Harper, and even better than Mike Trout, along with last year’s home run leader, Pete Alonso, among other notable names. Hard-hit rate is not the whole story of course, but it is notable, and a big part of Anderson’s profile and what makes him stand out upon first glance.
What makes him stand out more is what happens when you break out his hard-hit rate by the three batted-ball types. Obviously, it’s better for a hitter to hit more flyballs and line drives hard than ground balls, so it’s important to look at a hitter’s hard-hit rate in this way to gain additional clarity on the overall hard-hit number. Doing this exercise for Anderson reveals some encouraging results:
| Hard-Hit% | Hard-Hit FB% | Hard-Hit LD% | Hard-Hit FB+LD% | |
|---|---|---|---|---|
| Brian Anderson | 45.7 | 56 | 67.5 | 61.7 |
| Rank (out of 273) | 37 | 43 | 12 | 19 |
| League-Average | 38.0 | 43.3 | 53.0 | 48.4 |
Keep in mind that those hard-hit fly ball and line drive numbers are taken as a percentage of total fly balls and line drives, so that’s why they’re much higher than overall hard-hit numbers. Looking at all hitters with at least 300 plate appearances in 2019, Anderson is not only towards the top in overall hard-hit rate, but when broken out by batted-ball type, Anderson remains towards the top. While he doesn’t appear as strong in the flyball department, and he isn’t, it’s important to know that the difference between Anderson in 43rd place and George Springer in 30th place is less than two percentage points, so it is not as if he’s lagging extremely behind. Overall though, this is encouraging to see from Anderson, as his generally strong hard-hit rate translates to the more desirable batted-ball types.
Next up, let’s look a bit closer at that average exit velocity mark. Remember that I mentioned that it pretty much remained constant from 2018 to 2019? Well, it’s also important to break this out by batted-ball type as well to get the most clarity possible. Let’s do this for both Anderson’s 2018 and 2019:
| Season | AVG EV | EV GB | EV LD | EV FB | EV FB+LD |
|---|---|---|---|---|---|
| 2018 | 90.2 | 89.6 | 94.4 | 91.2 | 93 |
| 2019 | 89.9 | 86.7 | 95.3 | 94 | 94.6 |
Despite it looking like Anderson didn’t improve in the exit velocity department in 2019, I certainly prefer Anderson’s 2019 exit velocity profile even though it’s slightly lower overall, because of the improvements made in the line drive and flyball sector. While Anderson’s average exit velocity doesn’t stand out much, he’s in a much better light when it gets broken out this way, and his 94.6 average exit velocity on flyballs and line drives is right in line with some notable hitters such as Austin Meadows, Max Muncy, and Manny Machado. Another factor that perhaps explains why Anderson’s average exit velocity didn’t improve is that he had a higher rate of pop-ups in 2019. His pop-up rate jumped to 6.3% in 2019. While not an alarming number, as is still is below the league average, it is perhaps a side-effect of an increasing flyball rate, and more pop-ups will certainly drag down a hitter’s average exit velocity mark.
All in all, Anderson already featured a nice, solid profile in 2019 and when it gets expanded to look deeper, there’s actually a lot more to like that should certainly put him on the radar. If he maintains that same profile in the future, he should end up as a strong, valuable hitter in both real life and for fantasy purposes. But, how can Anderson get even better?
One thing I have yet to mention about Anderson’s profile as a hitter is the direction in which he hits his batted-balls. Throughout his first two full seasons in the league, Anderson has had a natural tendency to spray the ball all over the field, and it happened more so in 2019:
| Season | Pull% | Center% | Oppo% |
|---|---|---|---|
| 2018 | 35.0 | 39.5 | 25.5 |
| 2019 | 31.6 | 39.1 | 29.3 |
Anderson traded a good helping of his pulled balls for opposite-field balls in 2019. All of that despite pulled balls being where he gets his best results by far:
| Direction | BA | xBA | SLG | xSLG | wOBA | xwOBA |
|---|---|---|---|---|---|---|
| Pull | 0.400 | 0.384 | 0.855 | 0.706 | 0.518 | 0.448 |
| Center | 0.348 | 0.363 | 0.481 | 0.591 | 0.351 | 0.399 |
| Oppo | 0.290 | 0.279 | 0.560 | 0.542 | 0.346 | 0.338 |
Like most hitters, Anderson gets his best results on pulled batted-balls, but I feel this is a pretty significant breakdown. How does this compare to other hitters? In general, Anderson’s .855 slugging percentage on flyballs ranked 51st out of 207 hitters with at least 400 plate appearances in 2019. This is not super significant on its own, but it is good to know. It certainly is a good thing to know not only did Anderson get his best results when pulling the ball, but also that relative to the entire league, Anderson was inside the top-25%.
What about if we yet again break this out to show the more desirable batted-ball types? Turns out, Anderson was actually one of the best hitters last season in terms of pulled fly balls, as evidenced by the table below:
| SLG | xSLG | wOBA | xwOBA | AVG EV | AVG Dist. | |
|---|---|---|---|---|---|---|
| 2.824 | 2.054 | 1.407 | 1.010 | 100.3 | 375 | |
| Rank | 17 | 25 | 17 | 24 | 22 | 24 |
In 2019 at least, Anderson really seemed to have everything clicking when he pulled his fly balls. It’s not exactly shocking to see a hitter get great results on pulled fly balls, but it perhaps is a little shocking to see a hitter that most wouldn’t expect to see there towards the top in Brian Anderson (he’s also right alongside a fellow Marlin that I love in Garrett Cooper on these leaderboards). Yes, there is a big discrepancy between his SLG and xSLG on these balls, but that’s generally normal for most hitters, just due to the nature of xSLG, as even the hitters at the top such as Aaron Judge and Nelson Cruz have big discrepancies between their actual and expected slugging on pulled fly balls. For the most part, this still looks like a strong profile, as his xSLG is still among the best after all, and batted-balls like this should usually play no matter what:
https://gfycat.com/ZealousLivelyHarborporpoise
https://gfycat.com/FloweryFaithfulAntelope
Now you can see partly why Anderson ranked where he did on his pulled fly balls in 2019. This perhaps does come with a caveat though. We know that Anderson already doesn’t pull the ball all that often, but what about his fly balls? Does he pull those often? Well, it doesn’t appear so:
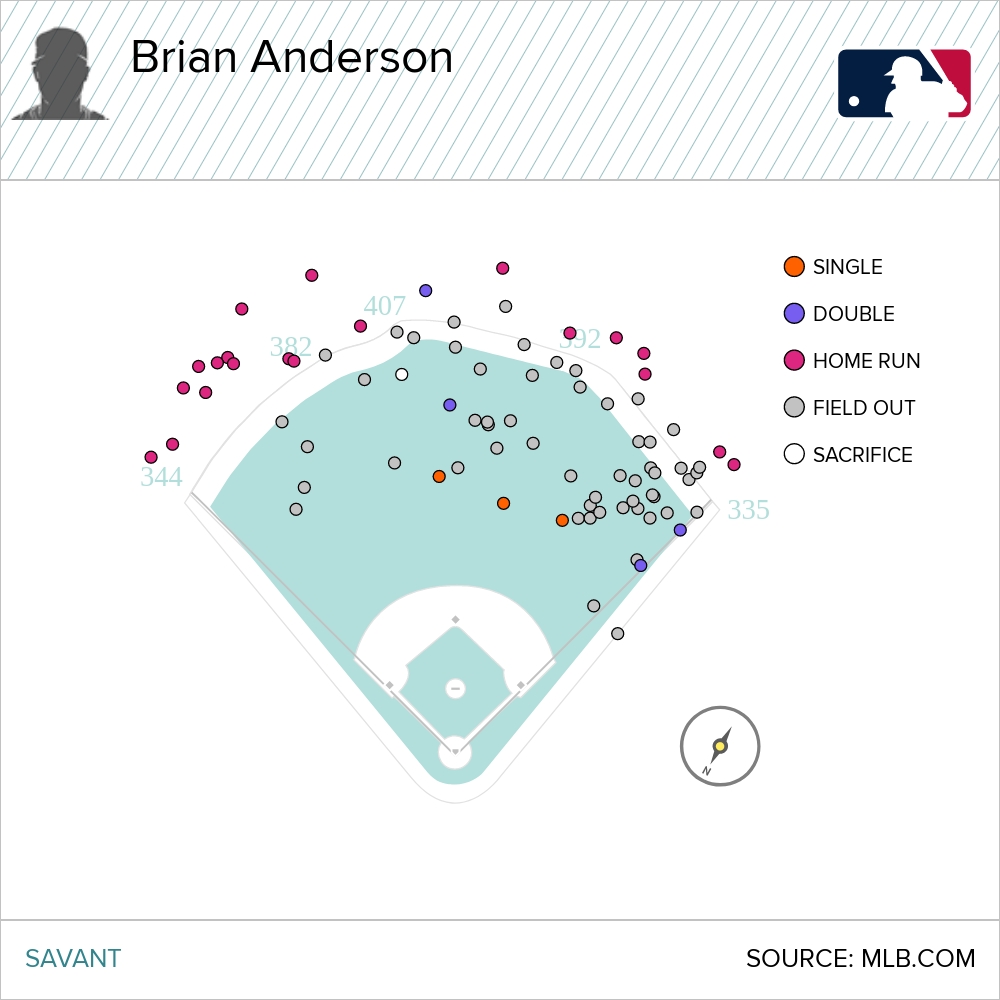
There is good news and bad news here. First off, what jumps out to me is that when Anderson pulled his fly balls, he hit a lot of home runs. It looks like he hit 17 fly balls that are considered “pull” by Baseball-Savant, and 12 of those turned into home runs, and they weren’t cheapies. Remember that his exit velocity on pulled fly balls was 100.3 miles-per-hour and his average distance on pulled fly balls was 375 feet, both marks placing him inside the top-25. It’s one thing to get a bunch of pulled home runs that barely scrape over the wall, but that clearly was not the case for Anderson. The bad news is that this could be chalked up to a small sample, and I’m hesitant to say this is repeatable because he hit so few pulled fly balls. Overall though, these results are still very encouraging and surely make Anderson a bit more intriguing.
When talking about how Anderson can get better, perhaps with a more pull-centric approach, he could reach another level. He doesn’t have to all of a sudden turn into Hunter Renfroe or Max Kepler and have a pull rate greater than 50%, but as it was in 2019, Anderson was towards the bottom of the league in terms of pull rate, and maybe wasn’t taking as much advantage of his approach as he could have. It’s not a bad thing by any means, and Anderson ultimately was successful at the plate in 2019 despite this, but I’d be very interested to see what Anderson might look like as a pull hitter. The results are different for every hitter, and I wouldn’t want him to do it just for the sake of doing it and risk something happening mechanically, but I do find it notable that Anderson’s pull rate generally increased as the season went on so it may be something that he’s already thought about, and something to monitor whenever baseball returns:
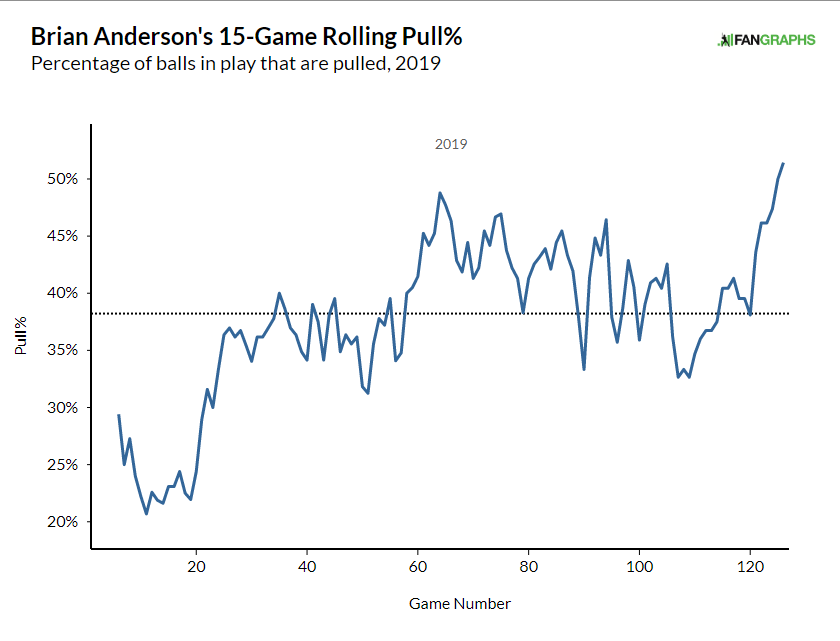
I am not a hitting coach, so I won’t outright say that Anderson should adopt a more pull-heavy approach, but even without a change to a more pull-centric approach, Anderson should still be a solid, reliable, and perhaps an underrated option. He got off to a slow start in 2019 that took him off of most radars, but he quietly enjoyed a nice turnaround that salvaged his season due in part to gradual improvements in several key offensive metrics including launch angle and hard-hit rate. His hard-hit rate was a sneakily strong one and also translated well to the better batted-ball types. Additionally, while his average exit velocity appeared to remain constant from 2018 to 2019, he actually improved in that department on the more desirable batted-ball types, which shows him in a much better light. Finally, there is room for improvement here as Anderson generated excellent results when he pulled the ball last season, and perhaps with more pulled balls, he may get more consistent results.
Overall though, Anderson is a hitter that should be solid and dependable, as he has a good baseline that should give him a safe floor as a hitter, with some upside that perhaps has yet to be fully tapped into. We saw him mash for a good part of the 2019 season and if he gets more consistent results over the course of a full season, he won’t be continuously underrated for long.
Photo by Gregory Fisher/Icon Sportswire | Adapted by Dorian Redden (@d26gfx on Instagram/@dredden26 on Twitter)


Also, fences coming in a little in Miami this year