


On a somewhat wet night in Philadelphia, Bryce Harper enters the left-handed batter’s box to take his seventh pitch of the at-bat against San Diego righty Robert Suarez.
It’s the NLCS, and Philly is down a run in the bottom of the eighth, making it appear as though their potential to clinch that night may not happen. The count is currently 2-2, with no outs and one man on. Harper carries the platoon advantage, but Suarez has the advantage as the dealer. He deals a 98.9 MPH Sinker (Suarez’s best and Harper’s worse pitch by run value in 2022) into the 4-Zone (Harper’s fifth-best zone by wOBA), which is then promptly driven 382 feet at 108.9 MPH over the left-center field wall. The Phillies take the lead, and the rest is history.
While a monumental moment of glee for the Phillies, the Padres have to wonder whether they could’ve done something differently. And especially for Suarez, who has to wonder what he could have changed to keep his team alive in the playoffs. While hindsight will always say that he shouldn’t have thrown that specific pitch in that specific zone, that couldn’t precisely be known beforehand. But, was there a right answer beforehand that could have been statistically more likely to succeed? Such an inquiry relates to the idea of pitch decision optimization, or the idea that there is a combination of pitch usage that would yield the best overall results. While this article intends to mostly go over the larger looks at the subject, such frameworks can hopefully provide a strong base in answering the soundness of such pitch decisions.
Background
While pitch decision optimization may sound like a unique problem for a unique sport, that could not be farther from the truth. Like most decisions in life, the pitcher weights different thought processes (pitches) and chooses the path that he believes will yield the best overall outcome (preventing the most runs). This branch of thought can be further elaborated upon through the lens of Game Theory.
For the uninitiated, Britannica defines Game Theory as a “branch of applied mathematics that provides tools for analyzing situations in which parties, called players, make interdependent decisions. This interdependence causes each player to consider the other player’s possible decisions, or strategies, in formulating strategy.” In other words, it tries to answer the question “if he knows, that I know, that he knows, I should do this action to win the game.” Within Game Theory, the pitcher’s dilemma would be classified as a two-player zero-sum game. In this model, the gain of one player is the loss of the other player. The same home run is just as helpful to the team on offense as it is hurtful to the team on defense.
A big difference in this model is that the same person (the pitcher) always has the first move, while the next person (the hitter) always has to react to the move of the first player. Naturally, the pitcher will almost always have an advantage in getting outs versus the hitter getting on-base (there are exceptions… notably Barry Bonds during the 2001-2004 seasons) due to this. With this advantage, pitchers have the natural ability to adopt a minimax strategy, or the ability to minimize the maximum payoff of the opponent. This strategy can be utilized by following the game theory strategy of backward induction, or the practice of looking at the expected results of a decision first before making said decision.
In baseball, there are plenty of ways to do this. Using available data, a pitcher can elect to throw a pitch that he is comfortable with and that the hitter does fairly poorly against. To that extent, a pitcher can also choose a part of the strike zone that they are comfortable with while also considering where a hitter routinely cannot hit well. The ideal fantasy for a pitcher would be to always target this spot, with a hitter having the worse possible outcome from this choice all of the time. Of course, this is not reality. The hitter gets a choice in this matter.
One portion of the reason that a given pitch can be so successful against a hitter is that they just don’t do very well against it – another portion has to do with the fact that the hitter didn’t know it was coming. Let’s go back to our ideal pitcher scenario, except with a twist of reality mixed in. Suppose that every pitcher knows Player X can’t hit fastballs in the 7-Zone, so that’s all he is thrown. Now expecting to get constantly thrown this pitch, Player X trains for 7-Zone fastballs. Up in his next plate appearance, all he has to do is wait for that pitch, as he knows it will come. Sure enough, it is seen, and he proceeds to blast it over the right-field wall. If the pitcher knew that he was expecting that pitch and had trained, it obviously wouldn’t have been thrown.
Hence, enter the game of “I suspect that he will throw this, but he may know that I suspect that, which means he may do this, but he may expect me to know that, etc.” It can quickly turn into an endless loop if the proper thought processes are not applied. Game theory cuts through this, providing the potentially best decision for one side and creating the best probability of success. With this mindset now in place, it should be much easier to understand how a solution can be found to the question of what to throw.
Introducing the Payoff Table
Another mainstay of Game Theory, a payoff table is a visual representation of the potential payoffs based on the player’s given choices. This makes it easy to see that if one player picks a certain column, and the other picks a certain row, the square intersection between those will reveal the amount the players will receive. To make things easier, here is a visual example of a two-option zero-sum payoff table:
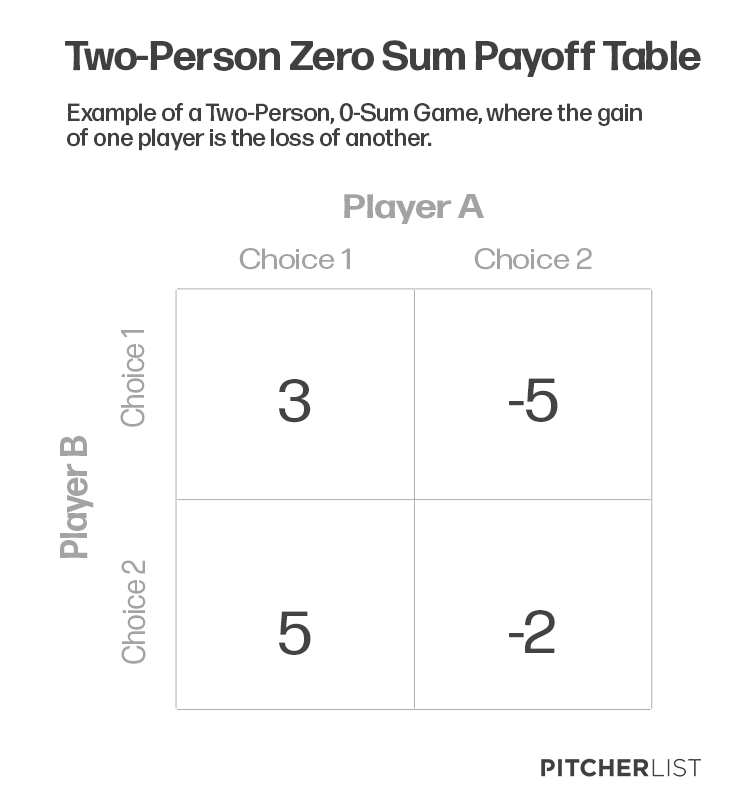
In the tables used in this article, it may look a bit different, especially regarding the payoff. In the regular payoff table, as shown above, there are two payoff options shown – one for each player. For the tables here, there will be a singular probability, showing the expected rate at which the hitter will produce given the choices. The hitter will hope for higher probability squares, while the pitcher will aim for lower probability squares in such examples. One should again keep in mind that this table is meant to represent a sequential decision, where Player A’s choice of the row dictates the potential outcome for Player B.
Being now familiar with payoff tables, let’s show a real-life example. Going back to the opening, the question of whether Robert Suarez should have thrown that pitch remains on trial for its processes. Hence, there is no better situation to use! Two tables will be constructed – one based on the pitch chosen, and one based on the location of the pitch. Since these factors are indeed dependent on one another for success, they will be treated as such. The Pitcher will first decide on the pitch that he wants from an original payoff table and then decide from another playoff table the location of the given pitch.
The payoff is comprised of the mean wOBA for both players (in 2022) for each given pitch, with a 25% bonus added to the hitter if the pitch is guessed correctly and an equal aggregate penalty across the other four pitches for incorrect guessing included. This 25% figure is completely arbitrary, as there has been no conclusive study completed as to the actual benefit a hitter yields when guessing the correct pitch versus not guessing correctly. Such a study would need a sound way to determine what pitch a hitter guessed, which could be done with auditory input from the player before the pitch is thrown to determine the added success.
For now, with the information available, it is somewhat safe to conclude from the conventional wisdom that a hitter will do better, on average, when the pitch that is coming is known. To that extent, the actual benefit received is truly just the best guestimate of the author, with an admittedly large room for error. With some type of bonus needing to be applied to the hitter, the 25% figure will stick for the sake of inquisition.
Keeping that in mind, these are the average expected payoffs for each pitch that Suarez could throw in this situation:
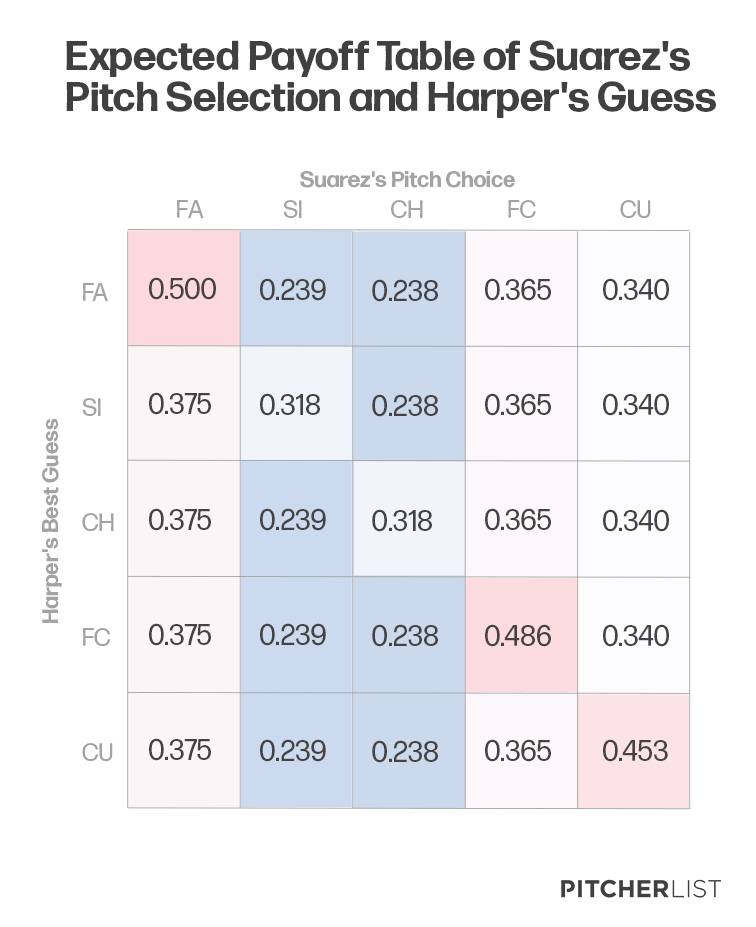
Based on these estimates, Suarez chose the wrong pitch by a slight margin. His changeup would be expected to allow 0.5 points (0.0005) less of wOBA compared to his sinker. Subscribing to the minimax theorem, the changeup would’ve been the correct choice. Such a minute difference is inconsequential in a singular at-bat, making such an error practically insignificant. While it is known in hindsight that the sinker was a bad move, and a preliminary error, it was one of the best pitches that he could have thrown in that situation. Knowing these facts, to count his choice against him would be somewhat unjust.
Given that the sinker choice is made, the next point of inquiry is location. Where should he have thrown the ball, given the sinker choice?
Time for another payoff table! Using Baseball Savant’s zone charts, it is easy to get a picture of both the pitchers’ and hitters’ success in certain zones for and against the sinker. This one will be similar to the previous one, except a bit larger. 13 total zones will be utilized (1-9, 11-14), with the payoff table representing the average of the hitter and pitcher, with the 25% bonus added to the hitter if correct and the corresponding penalty counted in the other twelve zones.
Based on hindsight, one could surmise that Harper knew that a sinker-like pitch was coming. With one aspect of the equation already figured out, Harper would likely be more successful anyhow regardless of the location. Hence, each payoff will be adjusted to reflect the prior 25% bonus for choosing the right pitch.
Ranking each zone by their adjusted expected payoff, the 4-Zone (middle-outside in the zone) where Suarez threw had the third-worst aggregate payoff for him, with the expected outcome averaging a .418 wOBA. Using the penalties allotted, a correct guess of the zone would’ve yielded a .523 wOBA and an incorrect guess of a .409. Correct or incorrect, it can be easily argued that Suarez was in trouble anyhow when the ball veered toward that spot in the zone. So, what would’ve been the right move? These are the average payoffs for each zone from the chart:
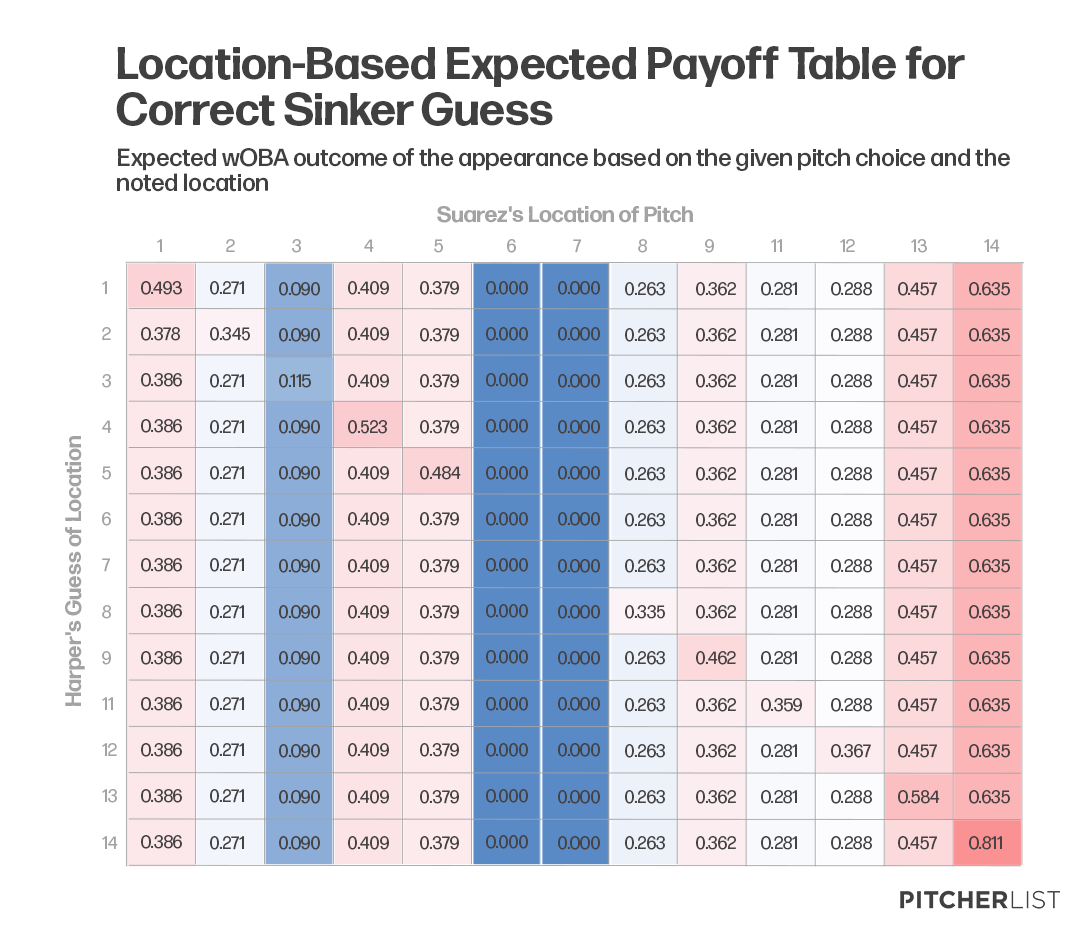
For starters, we need to assume that Suarez is trying to throw a strike, as the count dictates such a move and that’s what happened in the real-life scenario. Consequently, the 1-9 zones will mainly be focused on.
The zeros in the 6 and 7 zones seem like the first place to start. Given that the sample is somewhat comparable to the other parts inside the zone, aiming for these spots may not have been a bad idea. The 3-zone also could’ve been the call, as that is the next lowest payoff for Suarez.
However, we have to keep in mind that pitchers have a decently high room for error, with sites like Fangraphs citing that the average miss is 12-18 inches depending on the pitch. Knowing that, let’s suppose he can only aim for the part of the plate and hope for the best possible results. Averaging each row and column, the lowest expected payoff wOBA could be achieved for Harper by throwing inside – his expected payoff is a .154. Within that, the worst possible outcome would yield a .462 wOBA (if Suarez hits the 9-Zone and Harper happens to guess that exact spot). Although, it is unlikely Harper would guess such a spot as pitches are not thrown there very often and the expected results are somewhat in the middle of the pack.
The best possible outcome for Suarez would be the 6-Zone, with a preference for Harper not guessing that location. Even an expectation of the pitch taking on an addition-based bonus versus a multiplicative one would still lead to one of the best possible results. Ergo, the 6-Zone (or at least something inside) would’ve proved to be the optimum choice given that a sinker was chosen and Harper successfully guessed the pitch.
Suarez did not make the optimum choice – the expected payoff would be a .271 wOBA to the outside and .268 to the middle horizontal plane of the plate, two areas he likely should not have been aiming toward with a margin of error. On top of that, Suarez targets the 4-Zone the second most of all his pitches, and this specific target is tied for first among his thrown sinkers. Harper may’ve gotten lucky on probability in regards to guessing the sinker, but after that, the 4-Zone location was historically the most probable to happen. Such an error in judgment, however minute it may seem, was likely the difference between giving up that sort of damage and not.
What if Things Were Different?
As was made clear earlier, the utilization of a sinker was not the most optimum choice. While by the tiniest margin, the changeup would’ve been the possible pitch to utilize in general with Harper. If one assumes that Harper was more likely to guess the changeup due to its higher usage against Lefties, then the sinker was the correct choice – Harper is expected to yield a .263 wOBA on the Sinker and a .293 wOBA on the changeup if one accounts for the historical probabilities of Harper guessing correctly.
But in truth, I am not sold on that idea. After all, Harper chose the pitch that was about 2.2x less likely to be thrown, and there is no probable evidence that hitters guess pitches accurately and efficiently based on historical probability. Such an assumption of efficiency could prove to be a fatal mistake in this study. And while I am not suggesting that pitchers should assume ignorance in hitters, choosing what pays off better in the aggregate puts sole emphasis on what the pitcher can control.
Given that we know Harper was not to select the Changeup, these are the expected payoffs for each of the zones on the plate with that pitch.
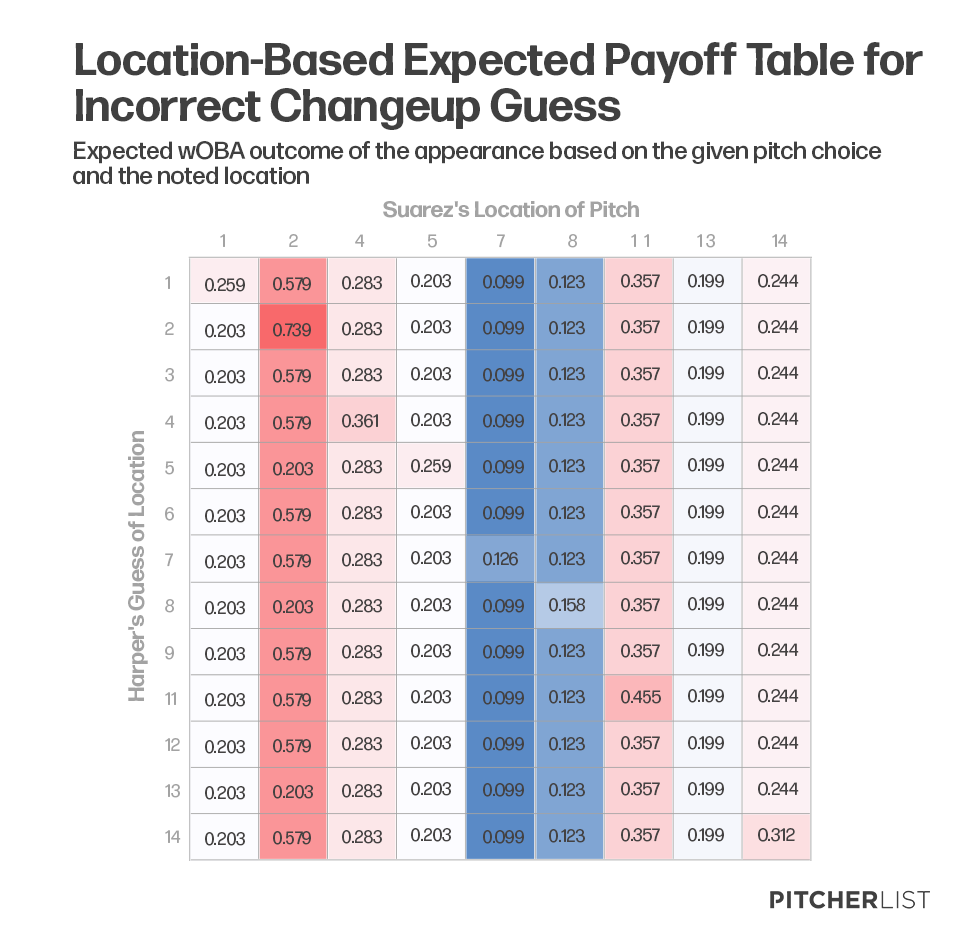
Based on the expected payoffs, the 7 and 8 zones look to be the most promising in inducing the smallest amount of runs. As above, the assumption that pitchers have a decently sized margin of error needs to be accounted for in deciding on the best zone(s). To do so, we again look at the average wOBA of the horizontal and vertical zones of the plate within the zone.
With the data available (the 3, 6, and 9 zones did not have sufficient data for both players), the outside part of the plate (.199 expected payoff wOBA) and the bottom of the plate (.113 expected payoff wOBA) were ideal for Suarez. And given that the 7-Zone had the lowest expected payoff overall (.101 wOBA), the efficient recommendation would be for Suarez to have thrown a changeup aiming for the 7-Zone, with a preference for a wandering pitch to go to the side / above that spot. In this situation, Suarez likely would not have given up his notorious homer.
Of course, that is not what happened. The sinker came in, and Harper made history. But, that doesn’t take away the usefulness of hypotheticals. How is someone supposed to grow without reflecting on their past mistakes and deciding what they should optimally do in the future? Game Theory helps provide a way to see these decisions beforehand, and ideally choose correctly. Its potential applications to pitching situations expand much farther than one singular matchup.
Further Application to All Pitchers
As this was intended as a preliminary application of Game Theory, there are many more facets and potential matchup possibilities not mentioned as to where this type of mathematical consideration could be applied to yield the maximum outcome for pitchers. These will be briefly touched upon.
Ball / Strike Selection
While in theory, the ultimate goal is to “throw strikes”, throwing a strike every time will lead to a pitcher doing badly. Hence, the need to throw balls and strikes – to keep the hitters on their toes. The reader is likely already familiar with this, although it is worth restating. In applying Game Theory to such decisions, one needs to consider the payoffs of a given hitter on strikes versus balls. Is the hitter likely to chase, or not? What are the hitters’ splits hitting against balls out of the zone versus strikes? How does he do against certain pitches as strikes versus balls? While in the end, a pitcher will have to try to avoid walking at all costs, the use of strategic balls or strikes in given high-leverage counts could give the pitcher an even bigger advantage.
After asking these questions, the answers can be transformed into payoff table form. The average outcomes between both the pitcher and the hitter when considering whether to throw the said pitch for a strike or ball can show the ideal choice, which should in the aggregate lead to better performance. The visualization of a pitcher that does well on the outside of the plate with his slider and a hitter who often unsuccessfully chases can be numerically shown in a table, which justifies such a choice by the pitcher with clear evidence.
Sequence Selection
With the last pitch in mind, if he thinks I’ll throw this, I’ll throw that, which he may guess, which means I have to throw this… etc. To first justify, it has been proven that a percent of pitches can be predicted based primarily on overall patterns. Just look at this article by Ethan Moore: Pre-Pitch Predictions.
With predictability being physically possible, the need to play to the proper numbers and avoid predictability is more important than ever. If Player B (the hitter) can guess Player A’s (the pitcher) move correctly, Player B becomes the winner despite Player A choosing a strategy that yields the best results on average. Suppose Player A elects to choose a slider, as that is their best pitch. They have not thrown the pitch the entire at-bat, and Player B knows that it is used primarily as a put-away pitch. Even though the average expected outcome is the lowest of any pitch, Player B is now sitting on the slider, and the max expected outcome takes place – a homer over the center-field wall.
While choosing a mini-max strategy (as Player A did) is normally ideal, a predictable choice in this strategy can still lead to a max outcome, which will likely exceed the minimum of some of the other outcomes. In other words… just because it’s right on average, does not mean it’s right in practice. Predictable sequencing is a big reason for this, which makes weighing the certain probabilities of a player guessing a certain pitch important.
As mentioned in the Harper-Suarez matchup, I am not sold on the idea that players efficiently guess pitches based on past usage. But if one were able to calculate the actual odds of a player guessing a pitch (perhaps based on swing patterns, hitter pitch type by sequence, etc), such considerations would go a long way in adjusting a payoff table to consider the potential outcome. Avoiding predictability is key, and adjusting the odds of guesses is incredibly important in deciding the route to take once predictability is avoided.
Pitcher Similarity Utilization
In one way or another, many pitchers are similar to other pitchers. Being as they all play the same game and have the same goal (to get outs), similarities were bound to happen. While the idea of sabermetric application of these similarities was first introduced by Bill James to compare player performance, various other sites and sources have introduced several ways to compare players, from underlying Baseball Savant-based metrics to the biomechanical field of delivery and motion.
But how would this apply to Game Theory? In the above experiment, the primary data was used for a singular pitcher, given pitch types, and lefty/righty splits in general. In a future edition of such calculations, one could get much more specific. How does Player Y do against a Player X-like slider? How does Player Y respond to a Player X-like delivery? What specific metrics ultimately affect the given batter’s performance the most?
In asking these questions, the goal is not only to get more specific but potentially provide a better sample size for the study. Player Y may do poorly against Player X, a given pitch type, or lefties – but look at the underlying issues. If one finds that Player Y’s performance is dramatically affected by these things, look for a potential underlying cause – perhaps, he does ultra poorly against a 3/4th arm slot lefty. In being able to nail down connections between a given player’s performance and certain traits, a sample of said types of players could be used to weigh the potential outcome, providing a much more robust way to calculate the expected payoffs of a given appearance. Such exploration would need to account for potentially random variables somehow having correlations, but enough research could further optimize a pitcher’s given choices.
Potential Improvements
Quantifying Correct and Incorrect Guesses
In considering the areas of improvement, I would personally enjoy the ability to exactly quantify the benefit/detriment of a hitter’s guess of a pitcher’s pitch and location. The same goes for the topics mentioned in the further application. To do such a thing, it may need to start with an idea mentioned earlier – have hitters speak their guessed pitch beforehand. But to take this a step further, a scientific study could be conducted in a lab-like area where hitters can speak into a microphone before a pitch, and the actual pitch type can be logged. It would be treated as a live at-bat, with software such as HitTrax or Trackman logging the Launch Angles and Exit Velocities to determine the expected wOBA of such contact. There would also need to be a comparison to the average performance rate in general. With a big enough sample size and a variety of different handed / types of hitters represented, then conclusive results could be logged to correctly adjust the payoff tables to show the true value of guesses.
Adjusting Calculations of Expected Outcomes
In creating the expected outcomes, a clear-cut average between the pitcher’s expected performance and the hitter’s expected performance was used. This was done as it is a combination of both that provides the real outcome, although such 50/50 weights could be adjusted. The first scenario that comes to mind relates to sample size. If a Pitcher or Hitter has limited experience in a given part of the payoff table, it may make sense to adjust the scale to put more weight onto the data point that has more sample size. After all, the one with less sample size is likely to vary by a bigger margin, giving reason to potentially adjust expectations to not be as close to a historical match. Such weights would likely need to be justified through a model/test of sorts to disprove the 50/50 null hypothesis and have a replacement, but it feels possible and potentially more accurate.
Conclusion
While Game Theory first took prominence in an effort to aid the Allies in the war effort, its application has grown to a vast series of topics – including baseball. There are many methodologies to think about baseball through Game Theory, although the general point of this article was to specifically focus on deciding the right choice in a two-person zero-sum game. In doing so, potential payoff tables of weighted probabilities (unlike regular zero-sum payoff tables, which include the general outcome) were shown, using the backward induction strategy to estimate the best mini-max for a pitcher, given what one knows about the expected outcome between the pitcher and the hitter. By following this strategy, the article utilized a real-life example between Bryce Harper and Robert Suarez to ultimately gain an answer of what should have been the pitch selection in that given appearance.
Such logic can be applied to all sorts of pitching decisions, with the further application portion touching on how one could possibly research further to potentially get more accurate payoff tables. And while this line of thought in application to baseball is still not perfected, this introduction hopefully provides a way for you, the reader, to more clearly think about how pitching decisions should be made – with logic and reason.
Photos by Icon Sportswire | Adapted by Justin Paradis (@JustParaDesigns on Twitter)
