


The hot summer months are in full swing, and with the warm weather comes scorching offensive performances. Baseballs have already started flying out of the park more regularly across the country, and that’s only going to get more and more common as we get deeper into the summer.
A great way for a batter to take full advantage of this offense-friendly climate is to choose which pitches he should attack correctly. In this article, we’ll take a look at some of the hitters who made the best swing decisions in June using PLV’s Decision Value. If you’re unfamiliar, Decision Value is one of our very own metrics here at Pitcher List and grades a hitter’s ability to recognize the pitches he can turn into favorable contact and then make the appropriate swing decision. It’s measured on a scale where 100 is the league average, and every 15 points above or below 100 is one standard deviation. We can even break Decision Value down a little bit further to specifically look at pitches thrown inside (zDV) and outside (oDV) the strike zone.
For a more in-depth description of Decision Value, check out the intro to this piece. You can support Pitcher List and get access to full leaderboards for Decision Value and other PLV statistics by joining PL Pro.
Juan Soto – 134 Decision Value (92 zDV, 140 oDV)
If you had to think of one player in all of baseball who most exemplifies Decision Value, Soto likely comes to mind. The $765-million man got off to a slow start for his new club, but has turned things on recently. His 134 Decision Value in June was the best mark in the sport, and he sure performed like he was seeing the ball well. Soto slashed an incredible .322/.474/.722 in June with 11 HR and 20 RBI. Those numbers were good for a .495 wOBA and 227 wRC+, both tops in baseball.
Here’s a look at Soto’s rolling Decision Value so far this year. You can see that early-season lull was still significantly better than the average hitter, and now he’s up to his typical elite level of production.
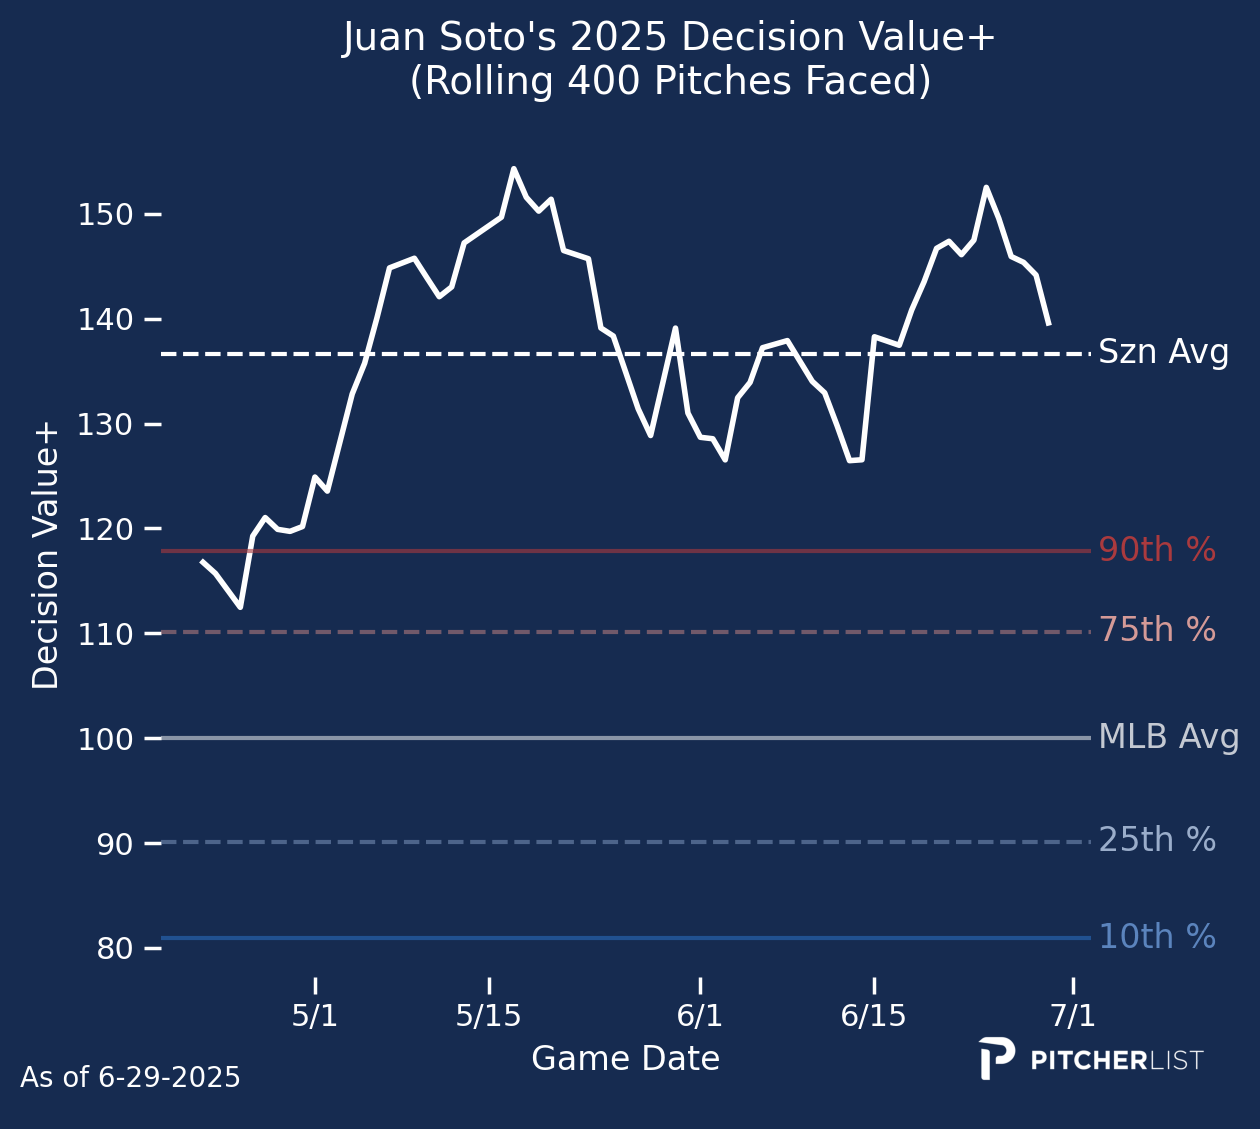
As we’ve come to expect from the four-time All-Star, Soto excels at laying off bad pitches outside the strike zone. His 140 oDV in June was the best in baseball, and his 137 oDV over the full season is tied for first. You’d think that Soto’s incredible eye at the plate would translate to good Decision Value grades in the zone too, but that hasn’t necessarily been the case. His 92 zDV in June is a good bit below average. That’s likely more due to Soto’s passivity at the plate — his 34.2% swing rate is literally the lowest in the league — than it is him not knowing which strikes he can drive. He watches more strikes go by him than 94% of hitters, so Decision Value is knocking him for not swinging at more of those pitches that typically lead to good batted ball results.
Taking a boatload of pitches is working out great for Soto, but it’d sure be fun to see what type of numbers he’d post if he turned up the dial on his aggression to league average. I don’t doubt we’d see him flirt with a 50 HR season at the expense of his premier OBP skill.
Mike Trout – 131 Decision Value (94 zDV, 136 oDV)
Trout can do pretty much anything on a baseball field with the best of them, but his placement this high in swing decisions still comes as a bit of a surprise. His strikeout and swinging strike rates have been creeping up over recent seasons, which you’d think would mean he’s not swinging at the best pitches, but that’s not the situation at all.
Like we just talked about with Soto, Trout isn’t an aggressive swinger. He ranks in the 4th percentile of big league hitters by offering at just 39.2% of the pitches he sees, and he flat out refuses to expand the zone. His 21.5% O-Swing% is better than all but 5% of batters. That’s how he’s earned yet another placement among baseball’s elites.
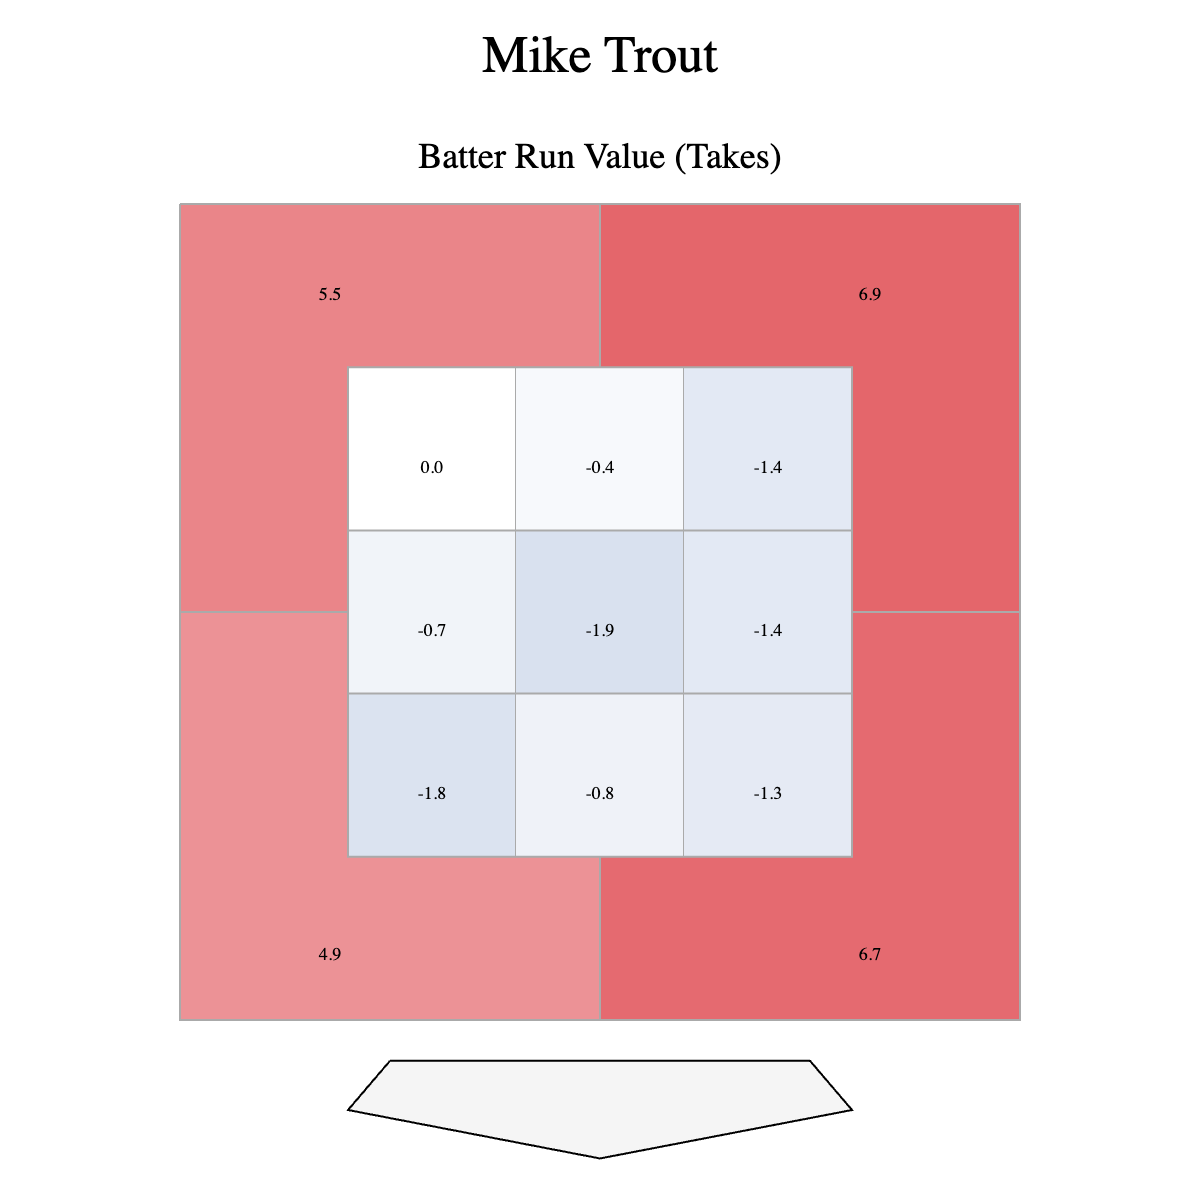
Trout’s 136 oDV is a great illustration of how Decision Value works under the hood. The best swing decisions a hitter can make is to not swing at a pitch out of the strike zone, and that’s exactly what Trout does day in and day out. That’s why he’s sitting so high on this leaderboard, and you’ll see other players with similar profiles in this article.
Here’s a great look at Trout’s Statcast Run Value on pitches he doesn’t swing at, broken down by zone. It’s a great visual representation of that idea.
Trout could stand to be a little more aggressive at pitches he could clobber in the strike zone. Perhaps that tweak could be the change he needs to get him back to his elite levels of production. Not that his current .230/.343/.445 isn’t good, but it’s not the Troutian level of production we’re accustomed to seeing from the future Hall of Famer. For now, we can just be happy that Trout is healthy and on the field.
Ronald Acuña Jr. – 128 Decision Value (120 zDV, 119 oDV)
Acuña didn’t make his season debut until May 23rd, but he hasn’t missed a beat. The former NL MVP has looked every bit the part, slashing .350/.467/.610 with nine homers and four steals across 150 plate appearances.
The production has once again been off the charts, but it’s even more fun that the underlying data supports what he’s been doing. His 128 Decision Value was the third best in baseball last month, and unlike the two names above him, he’s succeeding both in and out of the strike zone. Acuña’s 120 zDV and 119 oDV were both the sixth-best marks in the bigs. Here’s a look at how his Decision Value grades out visually:
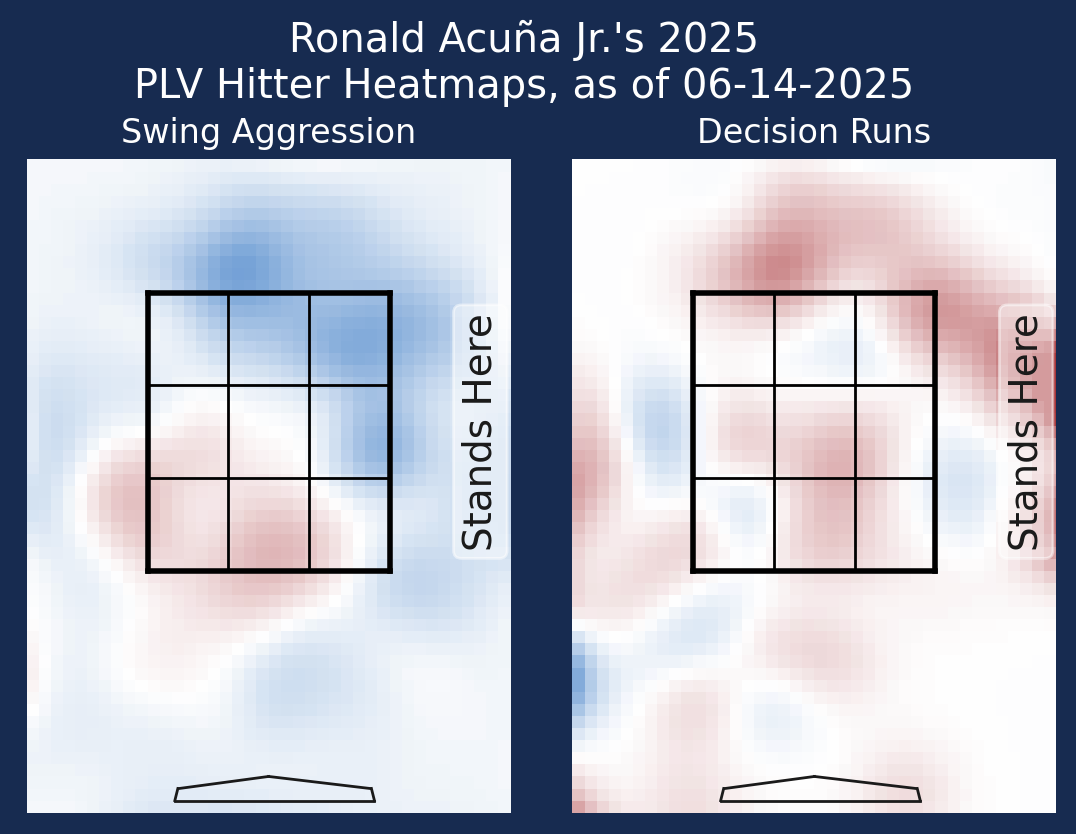
You gotta love how red that Decision Runs chart is!
When you pair Acuña’s incredible swing choices with his gaudy batted ball numbers — 18.3% barrel rate and 90th percentile bat speed — you’re going to get a lot of loud contact. He doesn’t have enough plate appearances to qualify for leaderboards, but if he did, his .414 xwOBA and .574 xSLG would be among the best in the sport. Not bad for a guy just five weeks into a return from his second career ACL tear.
Fernando Tatis Jr. – 127 Decision Value (128 zDV, 114 oDV)
Another name near the top of the leaderboard, another one of the game’s superstars. Tatis excelled at making good swing decisions last month, but surprisingly, his production at the plate didn’t follow suit. It was still a good month for San Diego’s right fielder, but his .235/.370/.337 batting line comes out to a good, not great 110 wRC+.
The immediate takeaway from Tatis’ June numbers is that his power evaporated in the warmer weather. Tatis left the yard 13 times across 240 plate appearances in March, April, and May, but homered just twice in 119 June plate appearances.
Of course, power isn’t the only way for a hitter to succeed. Tatis may have been missing the long ball from his game last month, but he still made the most of his trips to the plate. The two-time All-Star put up consistently great at-bats. He made good swing decisions no matter a pitch’s location and was able to work deep counts, leading to the first month of his career with a higher walk rate (15.1%) than strikeout rate (14.3%). That’s the kind of thing that really makes me think a hitter is growing into a better version of himself.
Tatis was content to not sell out for power, but put in good at-bats that helped his team. His good plate discipline led to a .370 OBP, and he took advantage of his ample opportunities on the basepaths. His seven swipes in June were tied for the fifth most in baseball. He’s up to 18 on the year.
Gleyber Torres – 127 Decision Value (90 zDV, 132 oDV)
Torres looks pretty content in his new home. The Tigers’ marquee offensive acquisition over the winter has acclimated quickly to his new digs, posting a .279/.383/.428 batting line through 321 trips to the plate. Both his average and OBP would be career bests if he can keep them at that level during the second half.
With a new home has come a new approach for the 28-year-old second baseman. Although his new team is named after a ferocious animal, Torres hasn’t embodied that spirit and has instead become less aggressive at the plate. His 40% swing rate is at an all-time low, and he’s refusing to chase pitches outside the strike zone. Torres’ 16.7% chase rate is among the best in baseball, sitting in the 99th percentile.
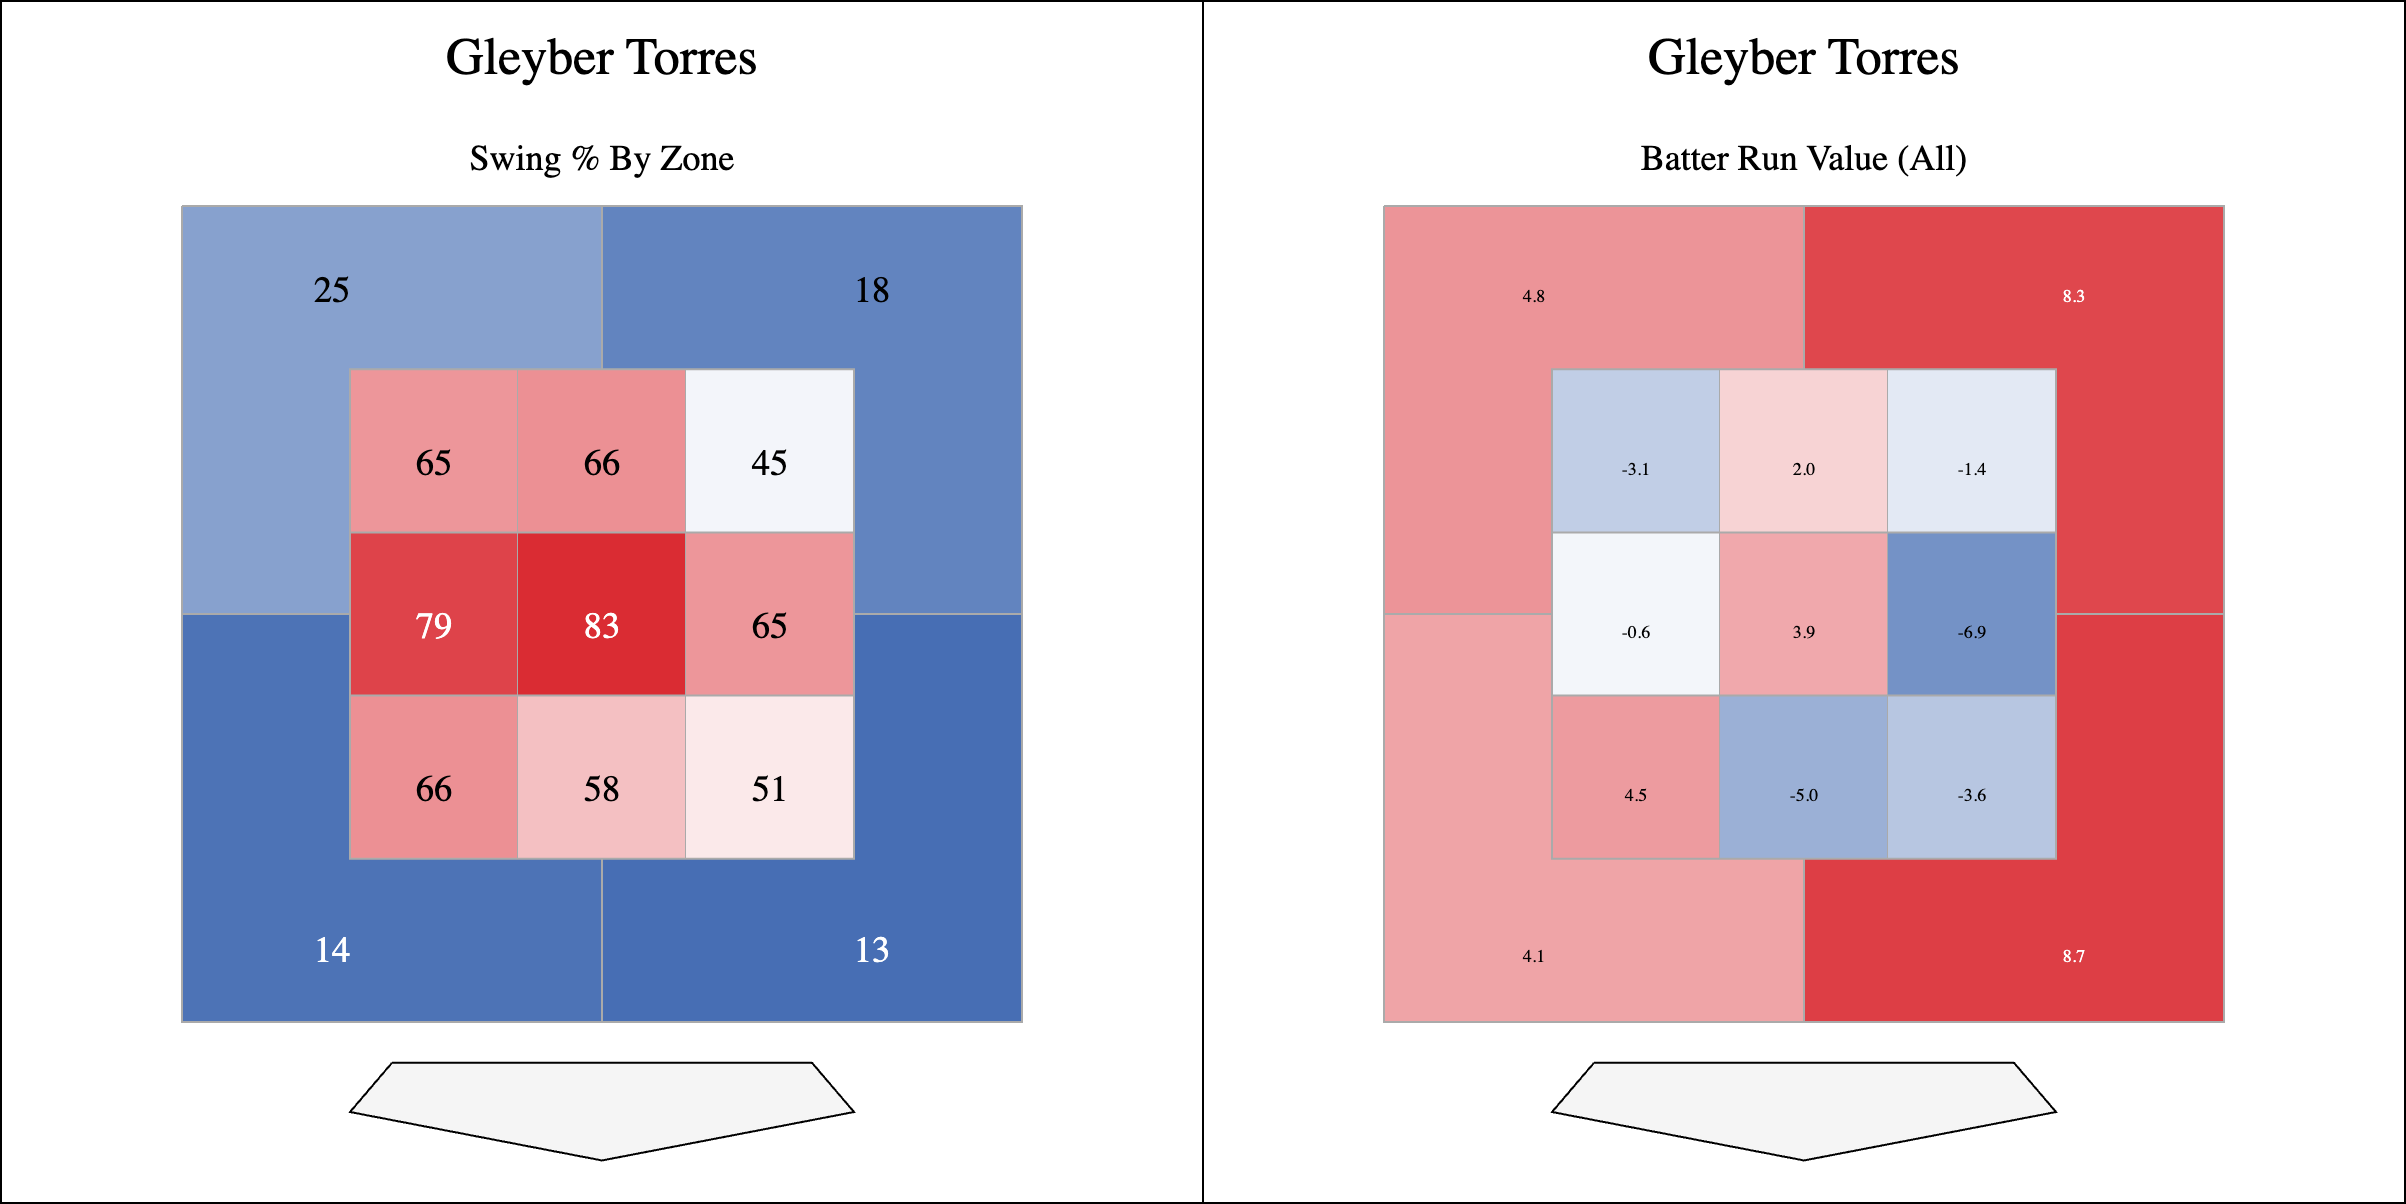
Here’s a good look at Torres’ swing% and his Statcast Run Value broken down by zone.
Torres picked a good year to swing less often – pitchers have been throwing him fewer pitches in the strike zone than they do the average hitter. Only 45.3% of the pitches Torres sees are strikes, a rate that falls in just the 22nd percentile of big league hitters.
When Torres does attack pitches in the zone, he’s not always making the best choices, but he’s at least been above average at making contact – his zContact% is 67th percentile. While Torres isn’t among the game’s elite in creating production on those in-zone swings, he has improved over last year’s poor results. He’s increased his Statcast Run Value on pitches that fall in the Heart and Shadow zones from -14 to 2 and -26 to -10, respectively.
Adapted by Kurt Wasemiller (@kurt_player02 on Instagram & Threads, @kuwasemiller.bksy.social on BlueSky)
