This past offseason, Pitcher List introduced PLV, a new set of metrics. I won’t try to explain the machinations here, suffice it to say they provide us with a more intuitive way to evaluate player performance by dissecting outcomes at the individual pitch level. For example, was this a good pitch? And what might the expected result be based on the quality of the pitch? Basically, PLV provides better context by accounting for variance while assessing player performance. For a much more thorough explanation, be sure to read Nick Pollack’s primer on PLV here.
For reference, the definitions are listed below straight from the source.
Swing Aggression: How much more often a hitter swings at pitches, given the swing likelihoods of the pitches they face.
Strikezone Judgement: The “correctness” of a hitter’s swings and takes, using the likelihood of a pitch being a called strike (for swings) or a ball/HBP (for takes).
Decision Value (DV): Modeled value (runs per 100 pitches) of a hitter’s decision to swing or take, minus the modeled value of the alternative.
Contact Ability: A hitter’s ability to make contact (foul strike or BIP), above the contact expectation for each pitch.
Power: Modeled number of extra bases (xISO on contact) above a pitch’s expectation, for each BBE.
Hitter Performance (HP): Runs added per 100 pitches seen by the hitter (including swing/take decisions), after accounting for pitch quality.
Pitch Level Average (PLA): Value of all pitches (ERA Scale), using IP and the total predicted run value of pitches thrown.
Pitchtype PLA: Value of a given pitch type (ERA scale), using total predicted run values and an IP proxy for that pitch type (pitch usage % x Total IP).
Every week, we’ll survey the PLV numbers and see who is performing well and conversely, who isn’t. It could lead us to breakout players or maybe help us better understand why a player might be struggling or doing well. We’re only about two weeks into the season, so sample sizes are really flimsy right now, which will result in a ton of fluctuating and make evaluating players, especially rookies, a challenge. The idea this early on is just to get a better description of the results so far as opposed to finding out anything concrete as values aren’t stable yet.
On that note, here are the stabilization points, i.e., when the results tend to become a bit less noisy. They come courtesy of Kyle Bland, one of the very smart and talented people that helped develop PLV. You can follow him on Twitter @blandalytics.
For PLA and Pitchtype PLA, things tend to stabilize at around 500 pitches.
For hitters, it’s a little different.
SZ Judgment and Decision Value: 500 pitches, or roughly 32 games played.
Swing Aggression: 75 pitches, five games played. This one settles down quickly.
Contact: 90 swings, about 12 games played.
Power: 95 Batted ball events, about 35 games played.
The last two depend a little bit on the type of hitter. For example, aggressive hitters will reach it more quickly relative to hitters who are passive and don’t swing as often.
With that, let’s dive in and see what the way-too-early PLV report card is telling us.
Rookie Hitters
(Note: Data in this section is current through April 12th)
Why not start out surveying the rookies? This past Wednesday, Jordan Walker matched a 111-year-old record as the first rookie 20 or younger to record a hit in 12 consecutive games. His raw power hasn’t shown up yet thanks to a GB rate of 63.9% (MLB average is 46.2%), but his contact ability has been surprisingly good so far. Most projections have him at around a 24-25% K rate and he’s currently at 22%.
Corbin Carroll has been as advertised. There was some concern about his potential splits against LHP. So far, he’s struck out twice in 15 PA against lefties (13.3%). Granted, it’s a silly sample size, but hey taking Clayton Kershaw yard is not a bad way to get started. Maybe the only slight surprise is that he has yet to draw a walk, and that might be reflected in the 35-grade decision value which will be worth keeping tabs on.
If you’re going to fret over one of the three, it’s Gunnar Henderson. Strikeout rates tend to stabilize quickly at around 50-60 PA and he has a 38.6% K rate through 48 PA. Let’s keep an eye on him and see if he can push past his current 35-grade contact.
The Red Sox’s big offseason addition, Masataka Yoshida, posted terrific K/BB in Japan. So far, so good stateside as he boasts a 6.7% K rate and 15.6% BB rate (45 PA) reflected by an excellent 65-grade decision value. The only question is how will his power play?
If you enjoy walks as much as I do, then you’re probably a huge fan of Miguel Vargas. He leads all rookies (40 min PA) with a silly 31% BB rate. He’s only hitting .200 and he hasn’t hit one out yet, but the underlying skills look terrific so far. He gets a gold star from PLV in SZ Judgement and Decision Value.
Yankee shortstop Anthony Volpe is at the bottom of the rookie leaderboard with a .479 OPS. Similar to Henderson, Volpe is going through an adjustment phase and striking out in bunches, although not quite as much at a 30% clip and a 45-grade in contact. Henderson, however, has a clear edge in power between the two.
Garrett Mitchell has shown some early power with three home runs, but the 35-grade contact is concerning. So far, he’s striking out at a clip well north of 30%.
Ezequiel Tovar has shown excellent contact ability and should help you out in batting average. However, he’s an extremely aggressive hitter which might cap his power.
Esteury Ruiz was a popular late-round target for steals this past offseason. The big question mark is what kind of hitter is he as he could very well end up being a one-category player. The too-early returns indicate that he’s a little below average, which might make him difficult to roster given the state of Oakland’s lineup.
Speaking of aggressive hitters, Chris Clegg nailed the scouting report on Oscar Colás. He might not have seen a pitch he doesn’t like. The 21.7% Swing Aggression is the ninth-highest mark that PLV has tracked so far this year. He’s got impressive power, but there might be some growing pains once pitchers realize they can get him to chase.
James Outman leads all rookies with a 1.122 OPS. The strikeouts are a concern, but his profile is buoyed by good grades in SZ Judgment and Decision Value that should help him weather any storms.
Spencer Steer has been a nice surprise so far for the Reds and boasts a .974 OPS through 11 games backed by solid scores across the board. If he keeps it up, it’s not hard to imagine him being a sneaky CI that ends up with 20 home runs.
Top Ten SPs by PLA (So far)
(Note: data in this section is accurate through April 13th)
Uneven results so far for George Kirby and Hunter Greene, but their fastballs are undeniably good. Kirby’s fastball has a -0.76 PLA and Greene’s heater is even better at -1.06. For reference, the highest-rated fastball among all pitchers currently belongs to…you guessed it, Nats RP Mason Thompson at -5.22.
Joe Ryan’s fastball isn’t far off at -0.67. After his dismantling of the Yankees this past Thursday, Ryan has the fourth-best K-BB% among SPs at 32.9%.
The 13-0 Rays have two SPs in the top four in K-BB%: Jeffrey Springs (37.4%) and Drew Rasmussen (35.7%). Rasmussen’s slider holds a PLA of 0.99, the fifth-best among SPs. Can you guess the top four sliders? That would be Austin Gomber (0.47), Hunter Brown (0.79), Martín Pérez (0.93), and Carlos Carrasco (0.98).
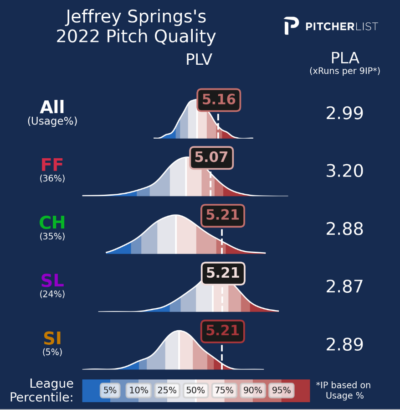
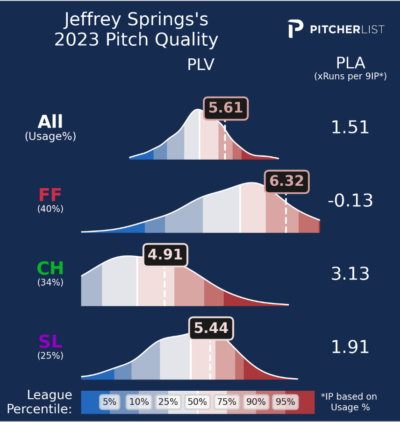
As Tim Cheng mentioned in his excellent Going Deep article, Springs is probably best known for his changeup. But the results on his fastball and slider have been even better this year. Hopefully, we see him back soon.


Brady Singer’s appearance in the top ten definitely throws me for a loop. While his second start against the Giants resulted in five earned runs, PLV thought the performance deserved a better fate and charted it with a 0.68 PLA. His sinker has so far returned a -0.43 PLA, sixth-best among starters. But his velocity was down noticeably in his latest start, so that’s something to watch.
Dylan Dodd got roughed up in his second start against the Padres and allowed seven earned runs on ten hits. However, his fastball PLA of -1.00, and his slider PLA of 2.43 give us a glimmer of hope. I’m interested to see if Dodd gets another chance. For comparison, Atlanta’s other rookie lefty, Jared Shuster, graded out significantly lower with an overall PLA of 5.27 (170 pitches).
Hey, look! It’s Tony Disco! So far, his slider grades out really well (1.70). The Giants seem to be rolling a six-man rotation at the moment, but given Disco’s history of low walks, I’m interested in seeing if the slider might give him some added strikeout upside.
In case you were wondering, Jacob deGrom, who leads all starters with a 37.9% K-BB%, missed the cut with a 1.90 PLA. Other notables that missed the admittedly arbitrary top-ten cutoff: Mitch Keller (1.61), Zack Wheeler (1.65), Jesús Luzardo (1.69), Kyle Gibson (1.69), Gerrit Cole (1.70), Kodai Senga (1.71), Hunter Brown (1.73), Dustin May (1.77), Luis Castillo (1.77), and Graham Ashcraft (1.84).
Up-and-down aces
Were you worried about Corbin Burnes after two starts? It might’ve been easy to say it’s too early to fret. But at the same time, Burnes had just one start last year with three strikeouts. After a ho-hum debut against the Cubs, he fell flat with another dud against the Mets making it two straight with three strikeouts. With Burnes, it all comes down to the cutter, which recorded just a 5.39 PLA during the start against the Mets in stark contrast to the 3.24 PLA it recorded in 2022. But then he righted the ship in his third start against the D-Backs as his cutter returned a pristine 0.45 PLA. That’s what we like to see.
Having played my fair share of DFS over the years, I’ve developed a love-hate relationship with variance. It can have us all chasing our tails. I think Sandy Alcantara’s two latest starts provide a good example. The reigning NL Cy Young winner tossed a shutout against the Twins in his second start. And then the roof caved in against the Phillies. One of my favorite features about the Pitcher List player pages are the game logs – they have a ton of information. Let’s look at Sandy’s start against the Phillies:

The final line was awful: Nine earned runs on ten hits. But PLV is here to help us get a better understanding of what happened. In which case, the +8 hit luck (total hits-predicted hits by PLV) really stands out. The funny thing is, he actually ended this start with a better PLA (1.15) than his 1-0 shutout against the Twins (1.73). But he ended that one with a more fortunate hit luck of +1. Sometimes, you can only shrug your shoulders. Variance, go figure.
Two Potential SP Breakouts
(Note: data in this section is accurate through April 13th)
He’s only made two starts, but Kris Bubic certainly looks like he’s up to something as he’s sporting a career-high 30.7% K rate. So what does PLV say?
Above you’ll find Bubic’s PLA and the PLA of his individual pitch types. The slider is new. And, again, it’s a really small sample as he’s thrown only 16 of them. But if you’re willing to take the leap, the new pitch has so far returned a 55.6% whiff rate. And it’s, so far at least, PLV-approved. He’s also up about a tick on his fastball, which PLV likes a lot, too, compared to a year ago. If the improvements stick, he could be a good source of strikeouts. His walk rate is also down from 10.7% to 2.3%. I’m very interested.
It feels like the Mitch Keller (above) breakout has been happening for at least two years. You could probably say it already happened last season when he posted a career-best 3.91 ERA (ignoring the five starts he made in 2020) across a career-high 159 IP. But it came with a 20.1% K rate and 1.40 WHIP, all sorts of meh.
This year he’s added a new cutter as he now features an eclectic arsenal that would make Yu Darvish proud. The strikeouts are way up at 29.3%. Still, I can’t help but shake the sense that, no matter what, Keller is a pitcher who is destined to carry a high WHIP as walks are still an issue. Regardless, he rates out really well so far and just missed the top ten from earlier as he sits 11th in PLA among SPs at 1.60.
There are way more potential interesting SPs than I could hope to cover this week, so here’s another. Although this one technically happened last year if not for a mid-season injury, I’d be remiss if I didn’t mention Jesús Luzardo. It’s hard not to be impressed with the results so far.
I think the only thing we’re waiting for is his slider to come back a bit. Once it does, things could get really exciting.
Struggling Southpaws
(Note: data in this section is accurate through April 13th)
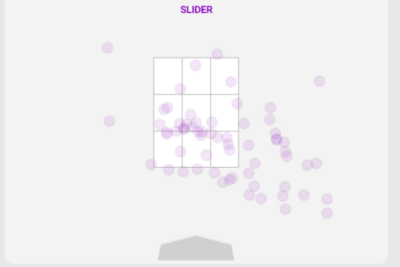
Chris Sale was probably one of the biggest mysteries of this past draft season. Unfortunately, PLV data only goes back to 2020, so we can’t compare him to his glory days. However, one thing that stands out is his slider, which has returned a not-so-great PLA of 5.87. I’m admittedly an untrained eye, but you can kind of see the problem by glancing at the slider’s heat map. Quite a few bad ones lingering in the middle of the plate.

If you were in on Sale before the season, I wouldn’t give up hope. This just seems like it’s going to be a slow burn, so to speak, as he gets his command back after missing so much time. The one positive is that his fastball has a PLA of 1.88 despite the fluctuating velocity. That suggests that his heater command is decent, at least. We’ll have to see if he can get the feel back for his slider.
If you’ve been playing fantasy baseball for any length, then you kind of know the drill with Blake Snell. It’s Jekyll and Hyde. Right now, he’s one of those Allstate commercials. Leave Mr. Mayhem on the bench.
Post-hype hitters
(Note: data in this section is accurate through April 13th)
Jarred Kelenic struggled last year to the tune of a .534 OPS and 33.7% K rate across 181 PA. But he’s been on highlight reels lately thanks to a three-game home run streak.
So far, we’re seeing gains in DV and contact. If they stick, and we see his K rate settle down in the 25% range like most projections have him pegged at, then I think Kelenic truthers could finally be in business. The power plays! We’ll have to see if he can keep up the contact gains and also how he fares against lefties. He’s been on the bench against LHP, but he’s in the lineup tonight (Friday 4/14) against Austin Gomber.
Josh Lowe made some noise early on including a home run and a stolen base on April 11th. Overall, he’s hitting .345 with a 1.096 OPS (32 PA). His breakout is a little more subdued because the Rays, in their replete wisdom, prefer to deploy platoons as often as possible. It could make him challenging to roster unless you’ve got deep benches. Regardless, PLV supports the early success with a 50-grade contact relative to 35 last year. And an increase in DV from 40 to 50. Similar to Kelenic, we’ll have to see if he can keep up the gains in contact.
One last post-hype bat who is now sporting quite the mustache is Trent Grisham. You might recall the former Brewer broke out in 2020 and posted a 10/10 season with a .808 OPS across 59 games. He’s hit four home runs so far with PLV pegging him with a 65 grade in power. The big change is that he’s swinging way more often. Last year, his swing aggression was -9.8%. Now, he’s at 7.7%. A once passive hitter, he’s now done a complete 180. I think we can expect this to stick knowing that swing aggression tends to be one of the first things to stabilize.

