


(Photo by Mark Goldman/Icon Sportswire)
With the rise of the shift in baseball, many hitters are struggling to adjust against defensive formations. Thanks to Statcast, we can quantify who is facing the shift the most and how much it’s affecting them. The types of shifts recorded are ‘infield shift’ and ’strategic shift’ – infield shift being a standard shift you’d see against left handed batters and strategic shift representing any other type of shift. For the purposes of this analysis, we will be looking at horizontal angle in relation to results on a standard infield shift.
Statcast doesn’t explicitly track horizontal launch angle, but batted balls are plotted as pixels on an image of a baseball field. The angle can be estimated by comparing the coordinate of home plate to the location of a hit. The following graph shows the relationship between horizontal angle in radians to wOBA on groundballs with standard fielding position in 2018 so far.
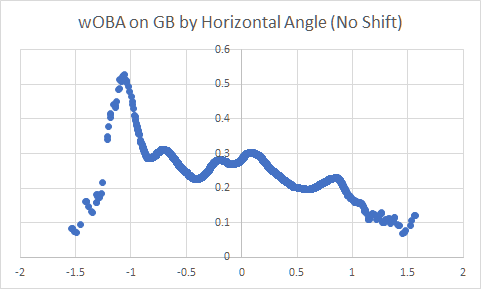
The first spike in the graph around -1 radians corresponds roughly to groundballs hit down the line at third base. To the left of that would be a soft hit that likely managed to stay fair without leaving the infield. Positive results on horizontal angles are correlated with holes between defenders, but small variations can lead to likely outs. The data set is difficult to model accurately because of this. However, the plot is much more linear against the shift.
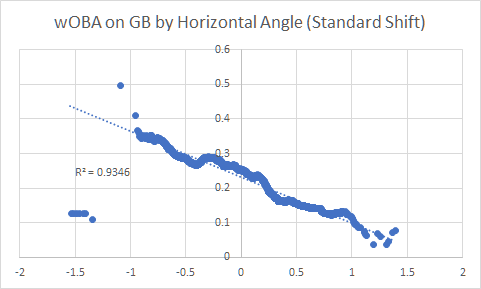
A simple linear regression fits the model very well with an r2 of 0.9346. It is intuitive that hitters should have better results as they can hit farther away from the shift. xwOBA struggles the most with groundballs, but horizontal angle alone against the shift correlates strongly with results. It has already been established that hitters have some control over which parts of the field they tend to hit towards, so horizontal angle may find a use in predictive value against the shift.
The following table shows the qualified players with the lowest expected wOBA based on horizontal angle (hxwOBA) that faced a standard shift on at least 50% of their groundballs. All have a significantly lower wOBA on groundballs than xwOBA with the exception of Cody Bellinger. These hitters can be expected to see worse results on groundballs than average and as a result tend to have lower BABIPs as well.
| Player | Shift Rate on Groundballs | hxwOBA vs the Shift on Groundballs | wOBA on Groundballs | xwOBA on Groundballs | Overall BABIP |
| Joey Gallo | 89.3% | 0.165 | 0.176 | 0.287 | 0.220 |
| Justin Smoak | 59.8% | 0.167 | 0.188 | 0.250 | 0.294 |
| Bryce Harper | 54.0% | 0.168 | 0.157 | 0.230 | 0.230 |
| Logan Morrison | 68.9% | 0.173 | 0.105 | 0.232 | 0.212 |
| Anthony Rizzo | 59.0% | 0.175 | 0.193 | 0.257 | 0.270 |
| Cody Bellinger | 57.4% | 0.175 | 0.241 | 0.209 | 0.289 |
| Matt Carpenter | 84.2% | 0.175 | 0.117 | 0.278 | 0.308 |
| Kyle Seager | 69.7% | 0.176 | 0.180 | 0.263 | 0.266 |
| Alex Gordon | 58.5% | 0.179 | 0.171 | 0.234 | 0.292 |
| Michael Conforto | 50.6% | 0.181 | 0.199 | 0.205 | 0.275 |
