


We all know about the demise of the dedicated closer: more relievers are earning saves every year, and fewer relievers are reaching high save totals.
We also know that a more deliberate approach to mitigating injury risk and an increased concern for leverage indices are responsible.
While both of these things are true, there’s more to the story. Back in April, I wrote about a recent trend away from using arbitration-eligible pitchers as primary closers. In short, saves cost a lot of money in arbitration, and over the past three seasons, teams seem eager to avoid paying up.
The 2023 season means more data and while the jury (or arbitrator) is still out, we’re already seeing signs that the trend is here to stay.
Checking in on April Predictions
In my previous article, I speculated about three bullpen situations that might bear my theory out over the course of the season: the Tampa Bay Rays, the Los Angeles Dodgers, and the St. Louis Cardinals.
Starting with Tampa, I suggested that, despite their bullpen usage reputation, the Rays would use Pete Fairbanks in a more traditional closer role. In order to make my case, I looked at how Alex Colomé accrued 96 saves from 2016 into 2018, before being traded in April once his first arbitration year hit.
With Pete Fairbanks signed to a long-term extension and Jason Adam entering arbitration eligibility, the Rays now had a financial incentive to give Fairbanks the lion’s share of saves.
So, with the season more than halfway over, where do things stand? Adam and Fairbanks have the same number of saves, thanks to Fairbanks’ two stints on the injured list:
With one exception (an appearance that would have had Fairbanks pitching 3/4 days while nursing his injury), Jason Adam has not accrued any saves while Pete Fairbanks is on the active roster. Although this is far from a proof of concept, the usage tracks, and we have good reason to suspect it will continue this way moving forward.
With respect to the Cardinals, I suggested that Giovanny Gallegos, also sporting a newly-inked contract, would likely take saves away from the arbitration-eligible Ryan Helsley. Here too, an injury has prevented a clean result, but still a largely indicative one: when Helsley went on the injured list in June, Gallegos lead Helsley in saves 8-7.
Finally, we have the Dodgers. Here, Daniel Hudson’s single save immediately after activation felt destined, but Hudson returned to the IL with a torn ACL after the game.
None of these bullpen situations prove anything, but they are illustrative of the league-wide trend. Teams prefer, whenever possible, to prevent their arbitration-eligible pitchers from tallying saves.
The Pre-Arb Trio
In my previous article, I focused on veteran closers but also highlighted instances where high save totals were accrued by pre-arbitration pitchers. If you aren’t familiar, under normal circumstances, arbitration eligibility begins after three years of MLB service time.
Accordingly, saves accrued in the first three years won’t cost the organization money until that threshold is met. In the case of Alex Colomé, the Tampa Bay Rays exploited that system to get cheap saves before trading Colomé to the Seattle Mariners. As it turns out, the Rays were just ahead of their time. Sitting at the top of the saves leaderboard, you’ll find three young guns:
| STATUS | NAME | ORG | SV |
|---|---|---|---|
| PRE | Camilo Doval | SFG | 30 |
| PRE | Alexis Díaz | CIN | 29 |
| PRE | Félix Bautista | BAL | 27 |
| VET | Emmanuel Clase | CLE | 27 |
| ARB | Jordan Romano | TOR | 26 |
| ARB | Devin Williams | MIL | 25 |
| VET | Josh Hader | SDP | 24 |
| VET | Ryan Pressly | HOU | 23 |
| VET | Carlos Estévez | LAA | 22 |
| VET | Kenley Jansen | BOS | 21 |
Arbitration Status Source: Spotrac
The ascendance of the pre-arb trio, Alexis Díaz, Félix Bautista, and Camilo Doval, marks a significant shift in save-share distribution over the past three years, but one that squarely aligns with the theory that arbitration eligibility disincentives appearances in save opportunities.
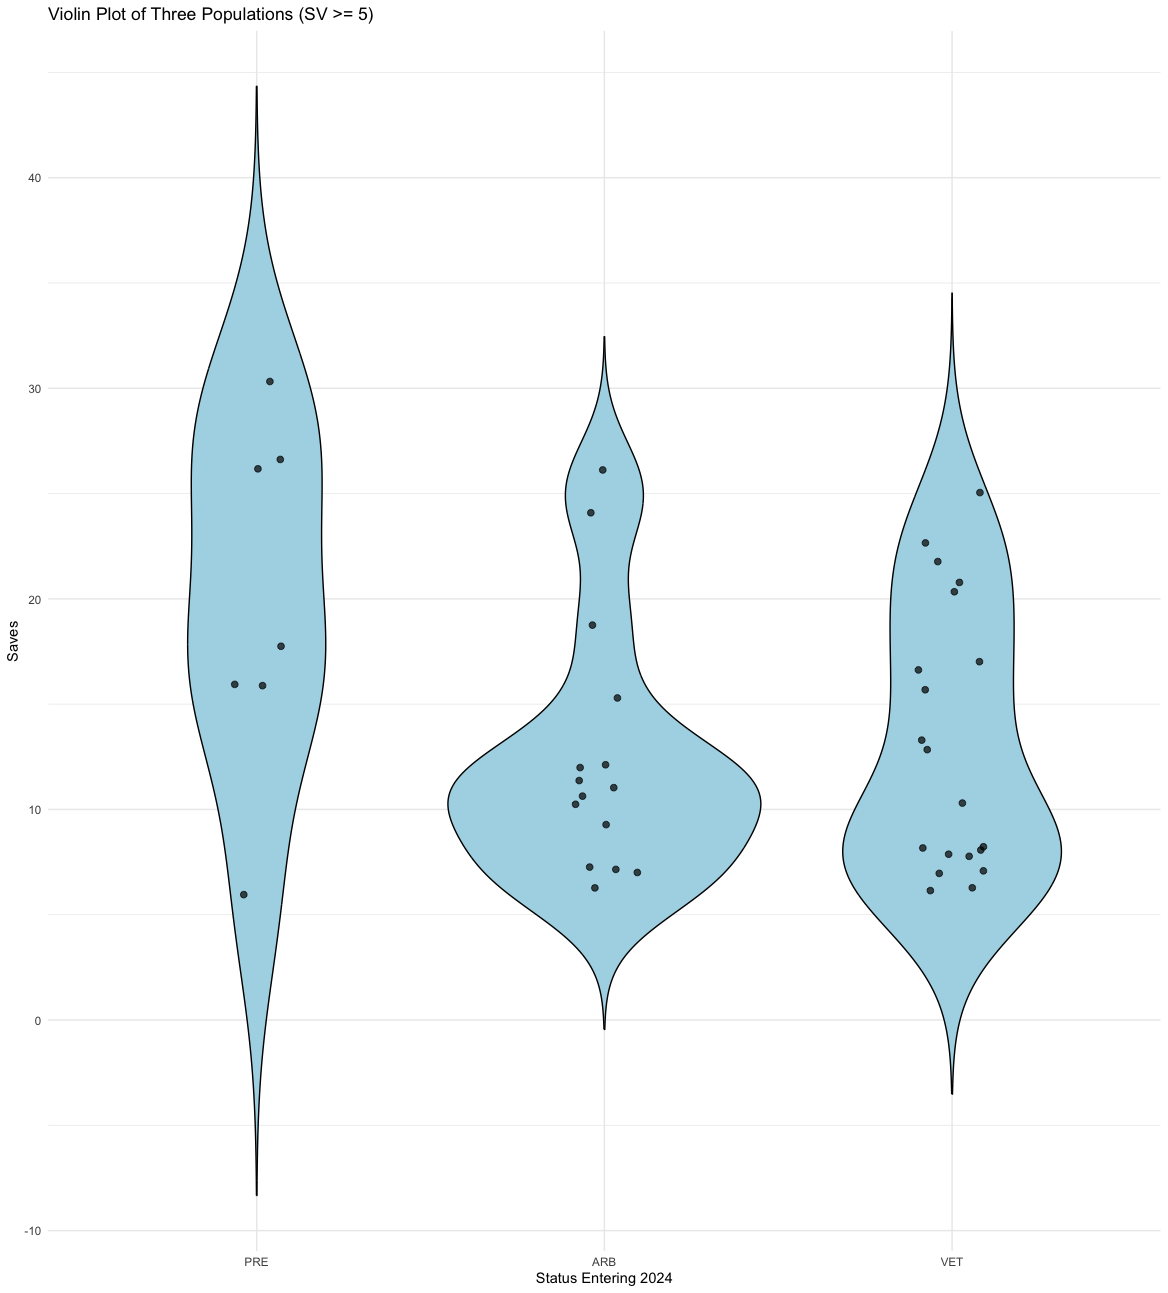
In order to get a sense of how save shares are being distributed this year, I grouped every reliever with five or more saves by arbitration eligibility status in 2024. Rather than simply charting saves by league-wide percentages (which tells us something about the aggregate results, but less about who is racking up high totals), I created a violin plot.
Violin plots visualize the density of a given value across a specific population. The wider the plot is, the more examples there are in a given population that falls within that range. Here, the Y axis is total saves, and each violin represents an arbitration status.
As you can see, the densities of veteran and pre-arbitration save shares are fairly even across the board, while arbitration-eligible pitchers appear to be bottlenecked around 10 saves:
2023 Saves by Arbitration Status Entering 2024:
Arbitration Status Source: Spotrac
The upshot here is as clear as ever: arbitration-eligible relievers aren’t matching the save totals of their peers. Moreover, the bottleneck effect is not simply accounted for by larger population size. Even with a greater number of represented relievers, the veteran population shows a much less severe bottleneck effect.
Cost-Saving at the Trade Deadline
While trade deadlines are always unpredictable, it will be interesting to track which relievers get moved at the deadline. Over the past few years, several prominent closers have been moved before the deadline unexpectedly. I’m thinking specifically of closers on competitive teams: Josh Hader in 2022, Kendall Graveman in 2021, or our friend Alex Colomé in 2018.
In each of these cases, arbitration eligibility was either on the horizon or well underway. Can we expect a similarly surprising trade at this year’s trade deadline? It’s hard to say. Teams are free to wait until the offseason to offload arbitration-eligible relievers.
That said, the deadline means better leverage since competitive teams are almost always in need of relief pitching. With these caveats aside, let’s look at some organizations that might have reason to sell.
I used a basic linear regression of every reliever’s salary (inflation-adjusted) over the past 8 years to model dollars-per-save during arbitration years. I included both players who settled before arbitration and players who went to arbitration with their team. With all else being equal, here are the results:
| ARB 1 | ARB 2 | ARB 3 | |
|---|---|---|---|
| Saves (year prior) | $80,272 | $82,721 | $87,483 |
| Saves (two years prior) | $65,253 | $81,415 | $99,495 |
| Base salary | $1,576,604 | $2,040,598 | $3,148,076 |
Contract Sources: Spotrac; MLB Trade Rumors; Cot’s
As indicated here, saves in the prior two years cost between $65,000-$100,000. In reality, things are more complex: for starters, player negotiation will include other elements of performance. In addition, a linear model is likely to miss any exponential cost associated with large save totals.
Still, the exercise is helpful, since it allows us to estimate which teams are in for a sharp increase in reliever salaries (and, therefore, might be interested in salary relief).
Using this model, rest-of-season save projections from Derek Carty’s The BAT, and committed salaries for 2024, I estimated reliever salaries entering 2024 for each organization. I then compared these projected costs to the previous two seasons, in order to get a better sense of how projected costs measure up to an organization’s budget.
Three teams stand out above the rest, holding projections above their maximum total reliever salary over the past two years: the Rays, Nationals, and Giants.
In the case of the Nationals, the writing is already on the wall. Both Hunter Harvey and Kyle Finnegan, who have each spent time as the primary closer, are eligible for arbitration. Even if Hunter Harvey’s injury prevents him from being moved, Kyle Finnegan is almost certainly destined to be traded, and so much has already been rumored.
The Giants are, perhaps, less interesting. Their unique distribution of innings means that their starters-turned-followers often hold salaries higher than the reliever average.
The more interesting case is that of the Rays: despite their regular manipulation of every line in the CBA, the Rays find themselves stacked with arbitration-eligible relievers, most of whom hold no significant share of saves.
The sole exception is the aforementioned Jason Adam. The model estimates that Adam will garner around $3.85 million in the upcoming year. While I highly doubt the Rays trade Adam at the deadline, we can see why they may be motivated from giving him saves for the remainder of the year: every twelve saves will cost the Rays around $1 million.
The most interesting case, in my estimation, falls to a team with a track record: the Seattle Mariners. Paul Sewald has now spent two seasons holding the closer role in Seattle and is about to enter the final year of arbitration.
The model projects Sewald to make roughly $7.67 million, but as I noted above, the linear projection has its shortcomings. If we take a look at recent salaries for pitchers with similar profiles, we see some potential for a larger return:
The variability here is a testament to the complexity of player negotiations, but on average the group made $8.36 million following these performances. Moreover, Sewald’s high strikeout rate and consistently low ERA bode well for him. If Sewald were to see higher returns, the Mariners would be spending more on relief in 2024 than they have shown a willingness to spend.
Whether it’s at the deadline or in the offseason, don’t be surprised if the Mariners opt to move him. They already have an elite reliever in Andrés Muñoz under a team-friendly contract, a track record of making unpopular moves to save costs, and a deep pen.
Time will tell how the trade deadline plays out, but keep an eye out on all arbitration-eligible relievers with significant save shares. Scott Barlow (KCR) and David Bednar (PIT) fit this mold perfectly, as do Jordan Romano (TOR) and Clay Holmes (NYY), though the latter two seem highly unlikely to move.
Closing Thoughts
The deadline is both the perfect time to take stock of the season so far and an imperfect time to analyze the season as a whole. We are about to see large shifts in team bullpens that will necessarily change the save share distribution landscape. For that reason, even the most established arbitration-eligible closers may see their role shift moving forward.
As of right now, the trend continues. As things progress, I’ll be writing more updates. Baseball has always been a business, but in recent years, the product on the field has become increasingly financialized. Teams don’t just make decisions based on in-game advantage.
Instead, they’ve found ways to remain competitive while cutting labor costs wherever possible, which is why I’ve been tracking where teams choose to save money, not games.
