


Here at Pitcher List, we have a suite of PLV metrics to study every event in a baseball game at the pitch level. Decision Value (DV) is our hitter swing decision metric. It takes inputs like pitch velocity, location, and movement, and tells us whether the hitter made a good decision to swing or take a particular pitch. This isn’t quite as simple as plate discipline; swinging at a Logan Webb sinker and pounding it into the ground is a bad outcome even if the pitch was a strike.
Instead, Decision Value rewards hitters for swinging at pitches they should be able to hit hard, and for taking pitches they’re unlikely to do much with. The flipside is that Decision Value punishes hitters if they don’t swing at pitches they should be doing damage on or do swing at pitches that are unlikely to generate quality contact. You can find a much more thorough introduction to PLV metrics and Decision Value here.
One of the advantages of pitch-level metrics like PLV is that hitters see many more pitches than they have at-bats or batted balls. This gives us a bigger sample to study earlier in the season and allows us to draw some meaningful inferences before other useful metrics come online. Ernie Clement and Luis Arraez currently lead MLB with just 93 batted ball events, while Matt Olson has seen 728 pitches. In particular, PLV starts to stabilize around 275 pitches into a season, meaning that for many hitters, we’ve got more signal than noise in our measures.
In this article, I’ll highlight a few relationships between our different decision value measures and offensive outcomes throughout the beginning of the season. I’ll also highlight some outlier performances relative to what player swing/take decisions would suggest the player has earned. In addition to overall DV, we report two component DV measures: zone decision value (zDV) and out-of-zone decision value (oDV).
In theory, we shouldn’t expect the component measures to have similar correlations with outcome stats. A hitter who has a superlative zDV but poor oDV attacks hittable pitches in the zone, but also swings at a lot of junk outside the zone. This should lead to strong batted-ball outcomes on contact but poor strikeout and walk numbers. Consider that a good zDV entails swinging at meatballs in the zone, but spitting on pitches that usually lead to bad outcomes like soft ground balls or popups. Unless the hitter has excellent contact ability, a high zDV, low oDV hitter will likely have poor strikeout and walk rates despite their good decision-making.
Our archetype for this hitter is Jeremiah Jackson. Jackson leads MLB with a 142 zDV but has just an 84 oDV. He’s barreling about 8% of batted balls and has a solid .259 batting average, which is supported by his .251 xAVG. He’s also walking in less than 2% of his plate appearances and striking out in roughly 22% of them.
Contrast Jackson with the idea of a hitter with excellent oDV, but poor zDV. This hitter excels at not chasing outside the zone and ought to have an excellent walk rate. There are a couple of ways they could be poor inside the zone. They could be too passive, not swinging at the types of pitches that are usually punished. They could also be too aggressive, swinging at pitches that are usually not hit with authority.
Taylor Ward is our archetype of a too-passive hitter with a low zDV and high oDV. Ward leads the majors with a 139 oDV, but has posted just a 77 zDV. He’s chased only 11% of the time this year, but he’s also dramatically cut his zone swing percentage over the past two years from 65% in 2024 to 53.7% in 2025 and 51.6% thus far in 2026. Ward’s running an unbelievable walk rate of over 20% this season, but all of his power has disappeared, with a career-low .125 Iso (2020 excluded) and only a 5.8% barrel rate.
Garrett Mitchell is our archetype of the aggressive hitter with a poor zDV and good oDV – a fairly rare type of hitter, since generally swinging at strikes is a good hitting strategy. Mitchell doesn’t chase much, but he also has little ability to discern which pitches inside the zone he should be swinging at, leading to a 54% ground ball rate and a 20% infield fly ball rate.
With these examples in mind, let’s examine the league-wide relationships between DV, its components, and offensive outcomes for players. To quickly spoil the results: zDV and DV tend to have weaker relationships with performance than oDV. I hypothesize that we need to account for contact ability as well, and the interaction of zDV and contact should perform significantly better. Instead, oDV is a strong correlate of a number of offensive stats we care about, which is valuable since it stabilizes quickly. Now let’s unpack the specifics.
I estimated a handful of bivariate regressions of offensive performance measures on DV, zDV, and oDV. These regressions are purely descriptive, intended to highlight a correlation and not to draw a causal relationship between our process measure and our outcome measure. The residuals from these regressions are how far a player’s measured outcomes are from what would be predicted based on their DVs. Let’s start with walk rate as our outcome measure and initial sanity check. We’d expect DV and oDV to be positively associated with walk rate. It’s less clear for zDV, since zDV rewards hitters for being aggressive on hittable pitches, a trait that, while effective, should reduce walks.
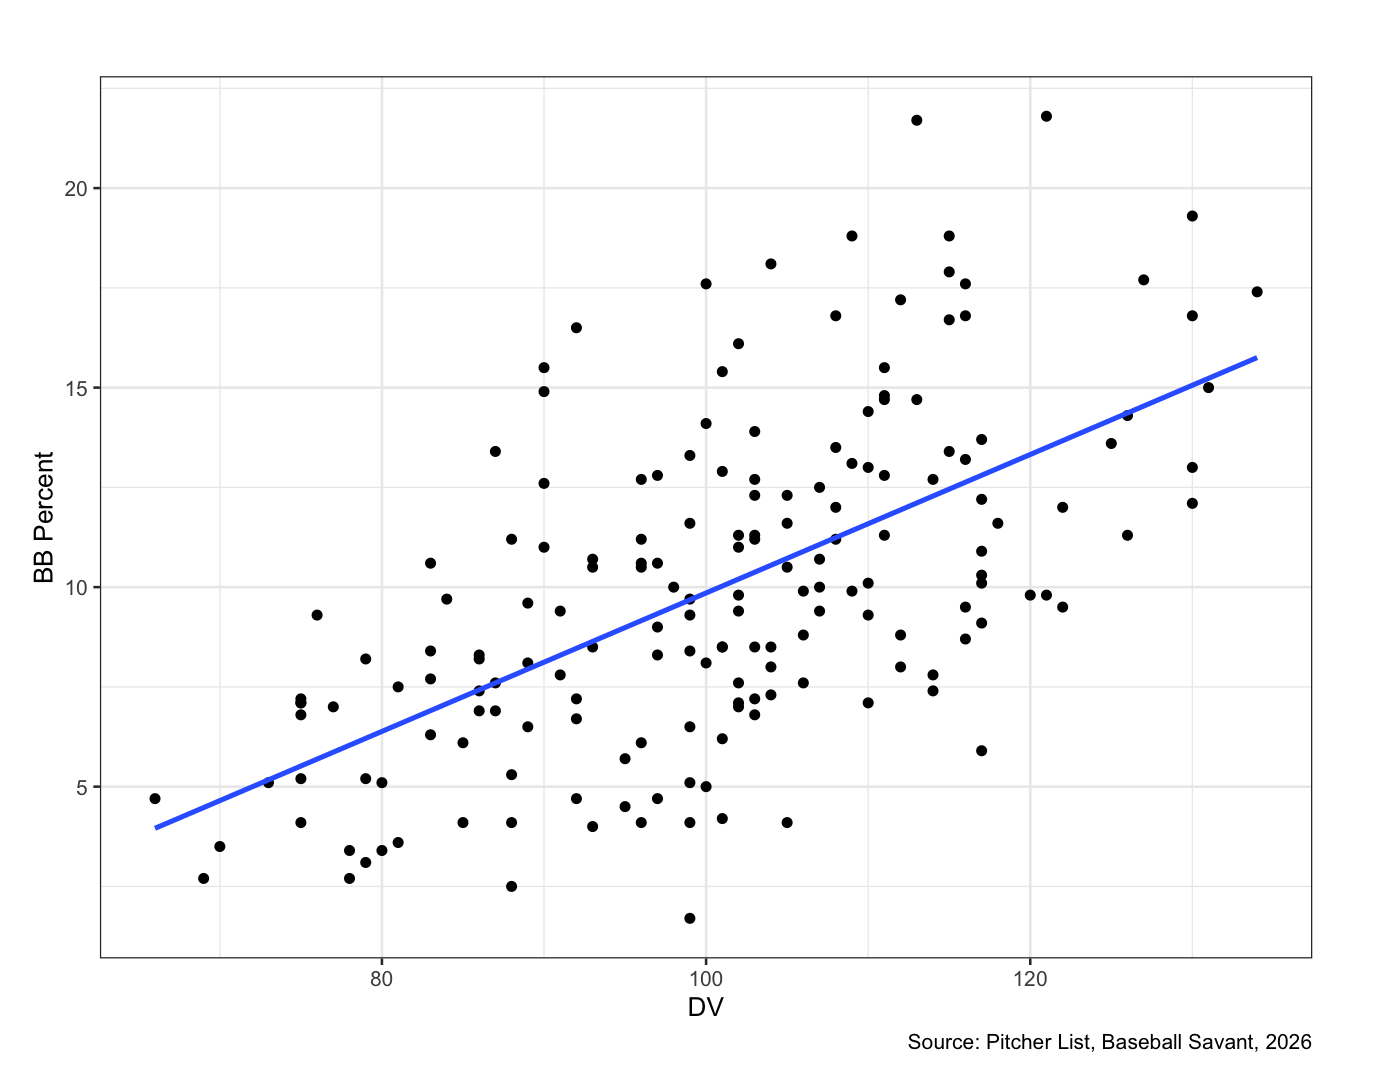
Indeed, we see that DV and oDV are both positively correlated with walk rate. Each point of DV is associated with roughly a .173 percentage point higher walk rate. Thus, hitter with a DV one standard deviation above league average (115) walks, on average, about 2.6 percentage points more frequently than a hitter with a league average DV.
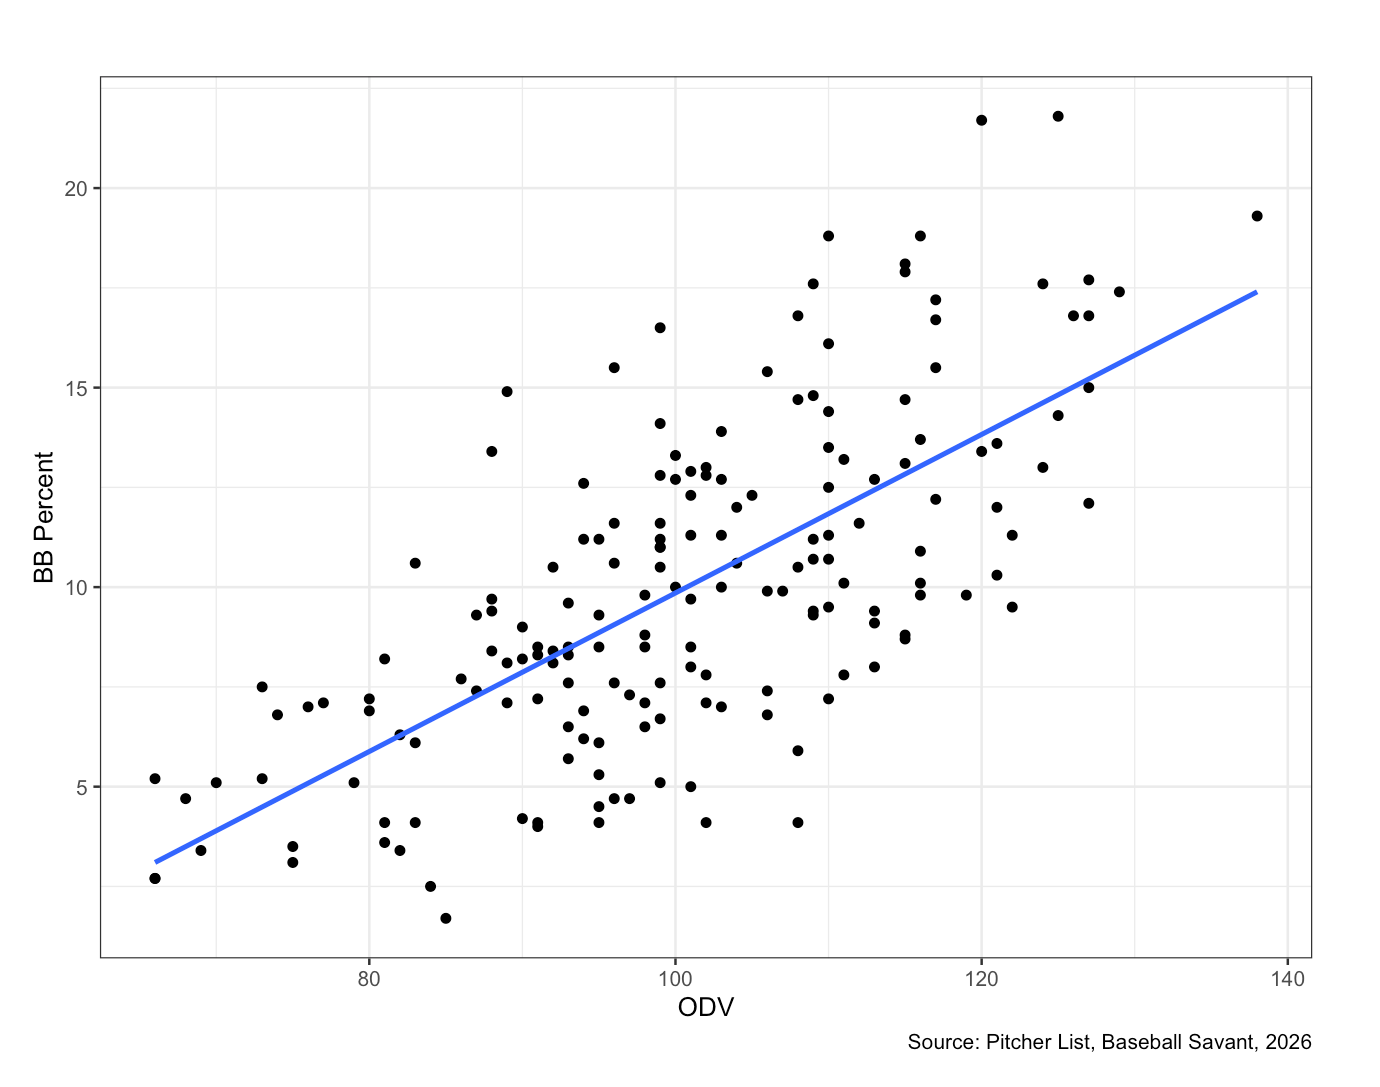
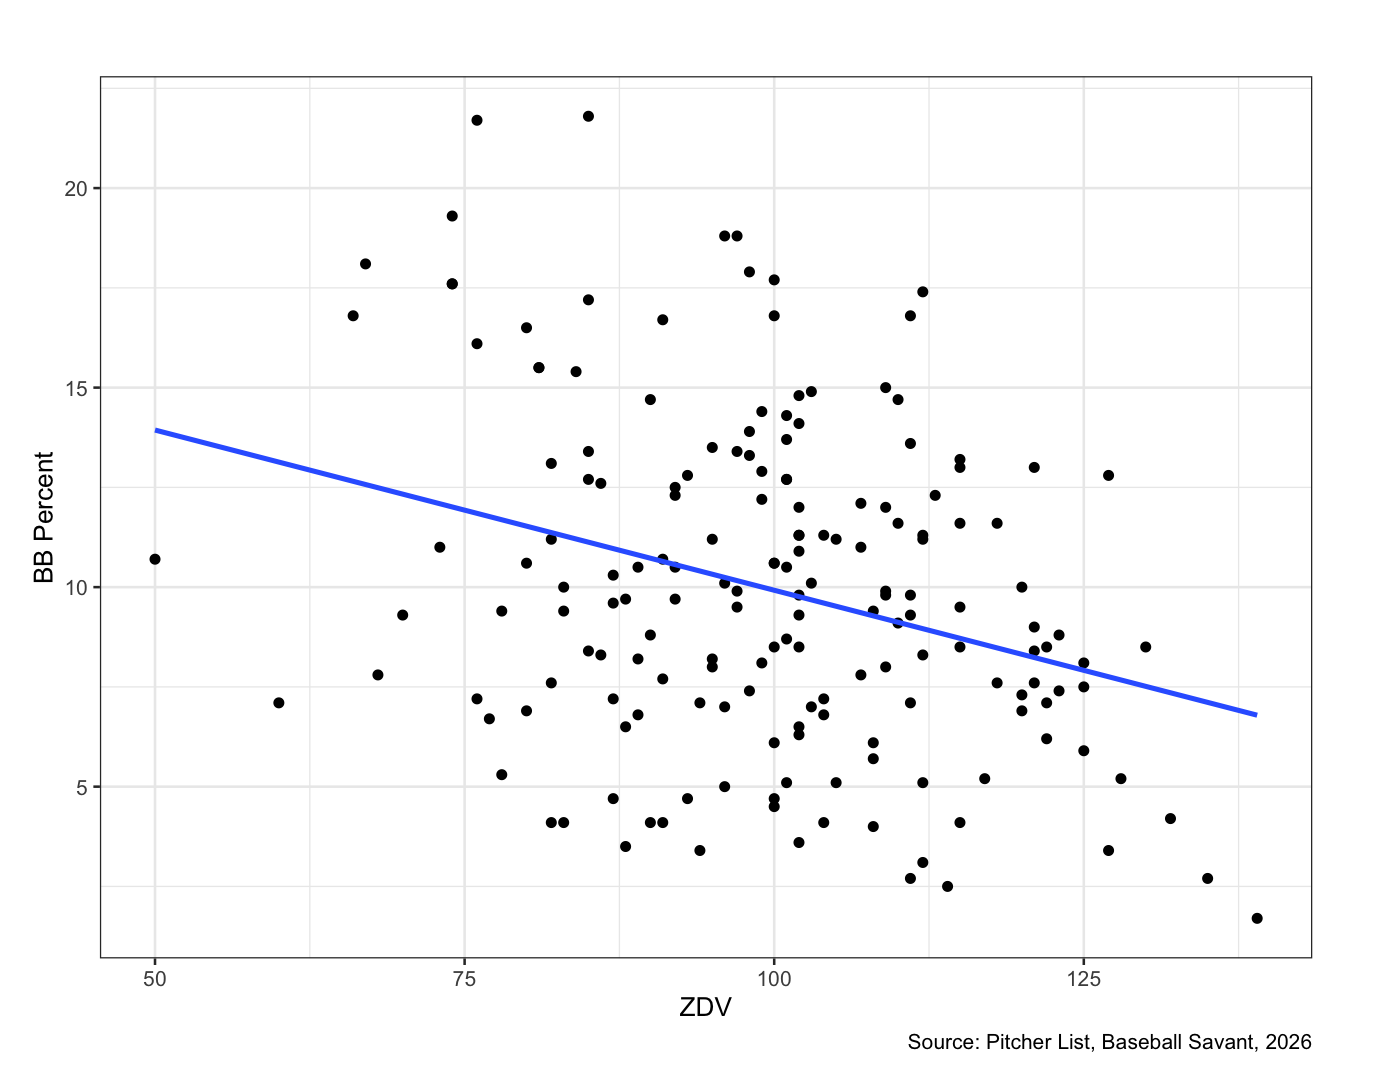
The slope is a bit steeper for oDV, which might be expected; oDV strips out decisions on balls in the zone, after all. Each point of oDV is associated with a roughly 0.199 percentage point higher walk rate. This translates into roughly a 3 percentage point increase in walk rate for hitters with a 115 oDV. Interestingly, what we find on zDV is that hitters who make good decisions in the zone walk less. The patron saint of swing decisions, Corey Seager, is instructive here. Despite excellent swing decisions, Seager has historically walked at solid, but not spectacular, rates in the 8-10% area. Instead, a hitter like Nolan Schanuel, who makes comparably good decisions on chasing but is substantially less aggressive in the zone, has walked at nearly an 11% clip for his career.
Differing from walk rate, strikeout rate is negatively related to DV as well as both component measures. In particular, it’s strikeout rate where zDV shines. Each point of DV is associated with a 0.072 percentage point reduction in strikeout rate. Each point of oDV is associated with a 0.006 percentage point reduction in strikeout rate – a reduction that is neither statistically significant nor significant in baseball terms. Instead, every point of zDV is associated with a 0.163 percentage point reduction in strikeout rate.
Combining strikeouts and walks in K-BB, the most predictive stat in baseball, we find that each point of DV is associated with a 0.245 percentage point reduction in K-BB. A point of zDV is associated with a 0.082 percentage point reduction in K-BB, and a 0.205 point reduction in K-BB for each point of oDV. Each of these relationships is strongly statistically significant, even in a small sample of 177 qualified players.
Establishing that players who make good decisions in and out of the zone (or at least perform well on our measure) are less likely to strike out and more likely to walk is probably not surprising. Instead, what might be useful is to look at the outliers from the predicted relationships. Matt Wallner is the (unfortunate) leader in excess K-BB based on his overall and out-of-zone decision values. He ranks third based on his zDV, with each metric indicating that a hitter with his decision-making ability should have about a 16 percentage point improvement in K-BB. Wallner doesn’t chase much and is aggressive in the zone; what he lacks is contact ability, with his contact rate outside the zone cratering to 34.2% and maintaining his low 73.7% zone contact rate.
Indeed, among the 50 hitters who strike out most frequently relative to their expectations based on zDV, only Chase Meidroth has an above-average whiff%. Based on his combination of swing decisions and contact ability, I’d buy a continued strong batting average from Meidroth based on a decline in strikeouts. Early-season hero Ildemaro Vargas is among the league leaders in outperforming his decisions, with his DV metrics indicating he could be expected to have a 6 to 12 percentage points larger K-BB. Vargas has elite contact skills, though, which allow him to succeed despite very poor swing decisions.
We can repeat the same exercise with a variety of outcome statistics. The early-season relationship between swing decisions and wOBA is very weak. Instead, the relationship between swing decisions and xwOBA is stronger. This shouldn’t be that surprising since early in the season, there’s a lot of noise in wOBA as well. If we inspect outliers in these relationships, again, our early-season hero Vargas ranks highly. By DV and its component measures, Vargas’s xwOBA should be 30 to 60 points lower. Predicting his wOBA off his swing decisions would indicate he should be giving back 115 to 130 points, which is almost precisely the predicted decline in xwOBA plus the difference between his current wOBA and xwOBA.
Mickey Moniak is another hitter who is an outlier in performance relative to expectations. We should be expecting this from the outset, as Moniak has posted a .461 wOBA vs a .345 xwOBA thus far. Moniak is actually a relatively strong decision-maker inside the zone, with a 109 zDV. It’s his propensity to chase that is an issue, with Moniak putting up a 67 oDV and a 69 DV overall. Based on his swing decisions, we should expect regression even in Moniak’s xwOBA, with predicted declines of 11-38 points depending on the measure. Our swing metrics predict his wOBA to fall into a similar range, yielding values ranging from .313 to .329. Moniak’s succeeded this year by improving his zone contact rate to a very strong, career-high 87.8%. Unlike Vargas, though, he doesn’t make elite contact when he (frequently) swings outside the zone, making contact only 47.8% of the time. Rest of season projections like Moniak a lot more than either his expected stats or swing decisions suggest.
I’d be tempted to shade those projections down slightly, especially in batting average. No one will pay you for exactly what he’s done so far, but if you’ve already banked a third of his likely full-season production and can sell him to someone more optimistic, I’d jump at the chance.
Designed by Aaron Asbury (@aarongifs on Instagram)
