


Whatever state your team might be in at the end of the season, there is always room for improvement for next season. One of the ways teams seek to improve is through free agency, which can be a gold mine for teams with smart investments and a terrible pitfall for teams that feel the need to make splashes to appease their fanbases in the short term. Free agency is especially alluring to teams because it’s one of the quicker and simpler ways to make a team significantly better because, in free agency, the cost of acquiring a player is mostly just money. Signing a free agent doesn’t typically require international bonus money, prospects, or draft capital (Yes, I’m aware of compensatory picks, but it’s not often an issue in signing players), unlike trades, and it’s a “quicker fix” for holes on the major league roster than drafting or trading for players.
However, free agency isn’t always all it’s cracked up to be because a player’s first shot at free agency often overlaps with the middle or tail end of the player’s prime (why they reach free agency then is a debate for another article) production years, which means that the front end of a contract is where the player’s most productive years lie. By handing out long-term contracts, teams will get the benefits of players in their prime years, when production is likely at its highest, but they also have to be ready for the player to enter their post-prime years, where production may decline steeply or slowly, depending on the player’s skillset. Accordingly, teams have handed out very long-term contracts to only a small number of players, such as Albert Pujols, Max Scherzer, Gerrit Cole, and Bryce Harper. More recent examples from this offseason include long-term deals for Corey Seager and Marcus Semien, among others.
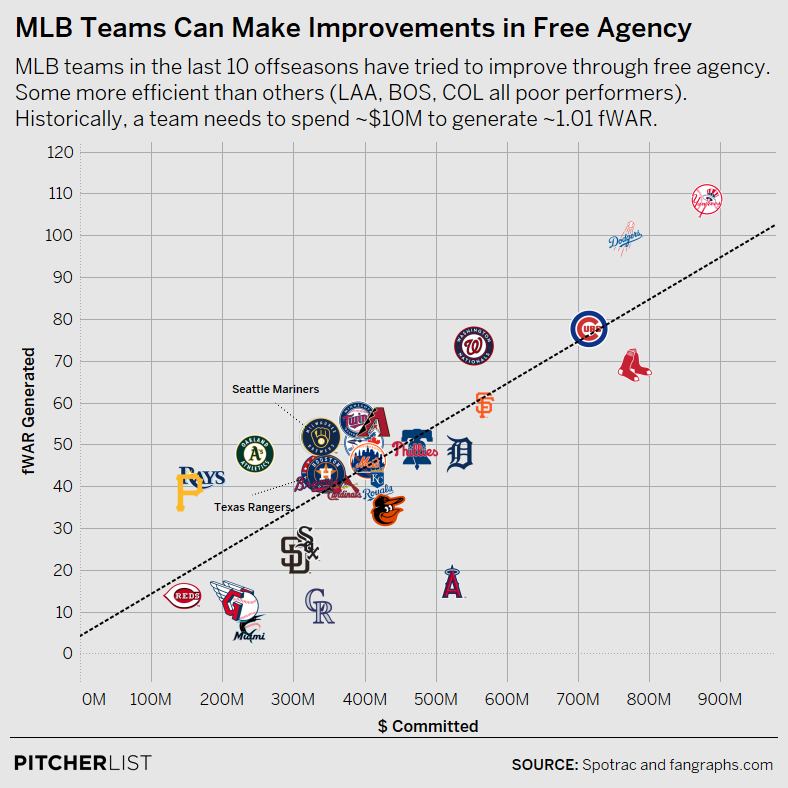
The majority of players entering free agency will never sniff the earnings of the players listed above. But many players entering free agency also have a lot to contribute to their new teams and can sometimes be the difference between a playoff run and no playoff spot at all. So, even though free agency often centers around 4-5 big names and contracts, it’s helpful to get a big-picture sense of every team’s efficiency (or lack thereof) in free agency spending, among all the contracts (stars, non-stars, and everyone in between) they’ve handed out because it’s an important part of team-building. I wanted to see which teams got the most “bang for their buck” in free agency by calculating their $ spent per fWAR earned, which you can see the exact methodology for below. The teams are sorted into tiers based on efficiency, with the top tier being the most efficient spenders and the bottom tier being the least efficient spenders.
MLB’s overall spending efficiency is detailed further, below the “Methodology” section. For a deeper look at each individual team’s spending across the measured period, see the tabs at the top of this article.
Methodology
Free agency contracts (or contracts in general), as I found out, are a minefield to try to navigate through. Most contract details are generally made public via national reporters and beat writers, but we don’t always have a sense of what every player’s contract ends up paying out because basically only the team, the player/agent, and MLB know the ins and outs of each player’s contract. Thanks to some excellent reporting from Spotrac, which I used to calculate payouts to each player, we have a good idea of what every player makes over the life of their contract. But the further back you go (especially in 2012 and 2013, as I found), the more difficult it is to see exactly how much money teams pay to players who don’t spend the life of their contract with a team.
It’s also important to note the methods I used to calculate $/fWAR because it will not reflect the exact amounts of money that players sign for at the beginning of the deal. Players are traded all the time. They or the team will refuse to exercise options for additional years on their original deals. The player might get cut. All of these things alter exactly how much money teams pay out to players over the life of their deal with the team. So, I tried to stick to the money paid to players that they specifically negotiated with teams once they reached free agency.
That means extensions aren’t included because many extensions are agreed upon while the player is still employed with a team, and distinguishing between extensions negotiated in February and extensions in November was going to be too difficult, based on the vast number of them. Players are not actively fielding offers from every interested party during extension negotiations like they theoretically might be during a true free agency period (it doesn’t always work that way, but let a kid dream). The same goes for qualifying offers, which aren’t included because they’re an average of the top 125 salaries in MLB, and not a reflection of negotiation between player and team in a free agency period. I felt that players who accepted qualifying offers never truly “tested the free agent market” and thus did not negotiate their salaries and contract length with multiple offers in hand, so it wasn’t a good reflection of a team’s ability to get “value” from a player in free agency. None of these contract types are included in my ultimate calculation of dollars per fWAR. It was also tough to judge international free agents like Shohei Ohtani, Yoenis Céspedes, etc., because Ohtani was “posted” by his NPB team (which constituted the majority of the Angels’ initial financial commitment), while guys like Cespedes were not, and was paid the major league minimum (plus a $2m signing bonus) during his rookie season and $650k in 2019. Céspedes, Yasmany Tomás, and Rusney Castillo had a different salary structure than Ohtani, so ultimately, I opted not to include Ohtani in my calculations, but other international free agents stayed in.
However, player and team options are included in a contract, so long as the contract was negotiated during free agency (and during or after the 2011-12 free agency period) because it is a reflection of the player and the team’s negotiating powers — and thus, ability to get “value” — during free agency. Contracts with favorable or multiple options are certainly becoming more popular for players who have lots of leverage in free agency, such as Carlos Correa and the Dodgers pitcher who will not be named. So, those contract years (and the $ required to decline them) are included in my ultimate calculation of dollars per fWAR.
Additionally, players who are traded in the midst of their contract will only have the dollar amount (known as the “Dollars Committed” in my analysis) they were paid while with the team attributed to their dollars per fWAR calculation. It seems unfair to reflect the full dollar amount of a player’s contract in the calculation of $/fWAR for a guy that no longer plays for the team they signed with unless the team is still on the hook for money owed to the player. For example, David Price’s dollars per fWAR with Boston is going to look different from the reported overall amount of money Boston signed him for because Boston paid him the full $30 million per year he negotiated in free agency from 2016-2019, and now that Boston is paying for half of Price’s 2021 and 2022 salary while he’s with the Dodgers, his overall dollars committed with Boston (on my graphs) will be less than the $217 million he agreed to with Boston during the 2015-16 free agency period.
All of the dollar amounts are courtesy of Spotrac, and all of the fWAR amounts are courtesy of Fangraphs. Spending and fWAR data is based on the period from the 2011-12 offseason to the 2020-21 offseason. So, the contracts at the tail end of this period will have relatively small dollar commitments but only because the lives of the deals have not played out. For example, Gerrit Cole’s huge deal with the New York Yankees during the 2019-20 offseason only reflects 2 years and $49,333,333 paid to Cole because it would be unfair to charge the Yankees for all 9 years and $324 million they committed to the deal when the remaining 7 years haven’t been played yet.
Contracts are listed by the year they were first signed, with the total money paid out over the life of the deal attributed to the offseason they signed in. So, Lorenzo Cain’s deal with the Brewers was signed in the 2017-18 free agent period, and the money he has been paid and the fWAR he was generated (prior to 2021-22, he was paid $48.9 million and produced 9.2 fWAR) is listed under the $ committed in 2017-18.
Finally, I toyed with the idea of creating a different valuation system for pitchers but decided to go with a stat that people are more familiar with when determining value relative to the dollars committed. Pitching fWAR isn’t the best way to determine player value, but I felt that if all pitcher contracts were compared by the same metric, it could still be a good comparison of contract value.
Overall Stats
The $/fWAR has remained around $10 million per 1 fWAR via free agency. Some teams have gone well beneath this, others way above this number. Keep that in mind when comparing each team’s overall $/fWAR metrics and $/fWAR per year.
 Data Visualization by @Kollauf on TwitterDollars, fWAR, and $ per fWAR (By Season)
Here’s the $/fWAR per season, broken down into $ committed to hitters, pitchers, and then overall numbers. Bear in mind that deals that continued through 2020 will decrease the dollars committed (and dollars per fWAR) due to the prorated salaries in the 2020 season. And, 2020-21 will likely see a decrease in value (increase in $/fWAR) as players age into their deals. Remember that the early years of a player’s deal are generally more productive, so the $/fWAR of subsequent seasons may decrease as the player’s skills decline. That’s not true in all cases — ask Max Scherzer — and the numbers likely won’t change so dramatically as to render 2020-21 a total “flop,” just bear in mind that teams were more cautious following a decline in revenues in 2020 and the players are more productive (in fWAR numbers) in early seasons of their deals.
Thank you to @Kollauf for the data visualization and Justin Redler for the article featured image.
