


Often, baseball analysts will use ERA predictors and peripherals to attempt to forecast players who are due for either positive or negative regression (or reversion). It often is a lazy approach that ignores several other factors. Pitchers like Nick Pivetta always seem to underperform their peripherals, while pitchers like Chase Anderson tend to outperform theirs. In statistics, there is never a case in which one statistic can tell the whole story. This is why people generally lean on multiple metrics to paint a fuller, more accurate picture. Well, Julio Teheran says to hell with your metrics! Since becoming a member of the Braves rotation, Teheran has been particularly confounding, compared to pretty much any other pitcher. This is a case of him exceeding expectations not once. Or twice. Or three times. No, Teheran has done this for the entirety of his career.
Rather than compare them one by one or simply selecting one, I’m going to use a cheap way to analyze Teheran’s ERA versus his predictors. Here, I am combining FIP, xFIP, and SIERA into one composite statistic, which I’ll call COM for simplicity’s sake. In other words, I am taking an average of FIP, xFIP, and SIERA. This isn’t without its limitations, and I haven’t done this since my first article at Pitcher List, but I think this table will be pretty shocking.
| ERA | COM | ERA-COM | |
| 2013 | 3.20 | 3.67 | -0.47 |
| 2014 | 2.89 | 3.63 | -0.74 |
| 2015 | 4.04 | 4.28 | -0.24 |
| 2016 | 3.21 | 3.92 | -0.71 |
| 2017 | 4.49 | 4.93 | -0.44 |
| 2018 | 3.94 | 4.74 | -0.80 |
| 2019 | 3.46 | 4.95 | -1.49 |
This isn’t a blip, clearly. Teheran holds a career 3.63 ERA, 4.20 FIP, 4.34 xFIP, and 4.24 SIERA. By all accounts, he should be something along the lines of a 4.25 ERA pitcher, but he’s not. He’s only had one full season above a 4.04 ERA, and he’s done it all while striking out fewer hitters than average, and walking more hitters than average. It’s fascinating.
The obvious answer here is we should be able to point to batted-ball data to show that Teheran is sustainably inducing weak contact. Easy. Statcast, here we come!
Expected Stats
Here is how Teheran ranks, by percentile, from 2015 to 2019 among qualified starters:
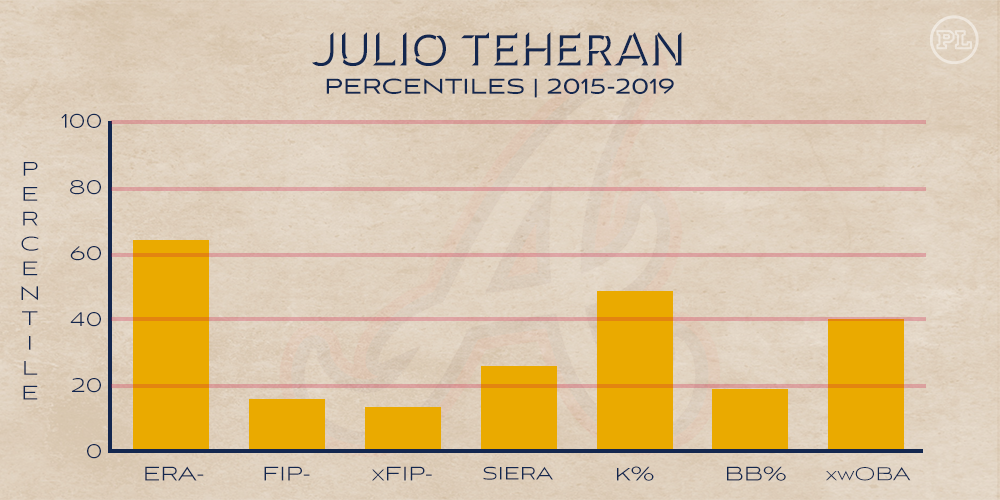
Not good! What I want to focus on here is his xwOBA. This should have explained the incongruence between his ERA and ERA predictors!
Since 2015, Teheran has a 0.345 wOBA on all batted balls, which slots him into the 81st percentile. This suggests that he has shown the ability to induce weak contact since he’s been doing it for the entirety of the Statcast era (but also his career). The thing is, though, his xwOBA doesn’t support this argument: He has an xwoBACON (expected wOBA on contact) of 0.370 since 2015. That slots him into the 47th percentile. So, in other words, by results, he’s been well above average on batted balls. But according to his expected stats, he’s been average at best. Since 2015, Teheran has ranked in the 93rd percentile in wOBA-xwOBA. This means that, for whatever reason, Teheran has shown the capability to be a consistent outperformer of his xwOBA.
Here’s what all of this information sort of means, in table form. A table, showing Teheran’s overall wOBA and xwOBA in the Statcast era:
| wOBA | xwOBA | |
| 2015 | .322 | .335 |
| 2016 | .281 | .302 |
| 2017 | .330 | .338 |
| 2018 | .295 | .322 |
| 2019 | .303 | .321 |
| Career | .307 | .324 |
If you’re more of a visually oriented person, here’s a scatter plot showing xwOBA on the X axis, and wOBA on the Y axis—except, this time, on balls on contact:
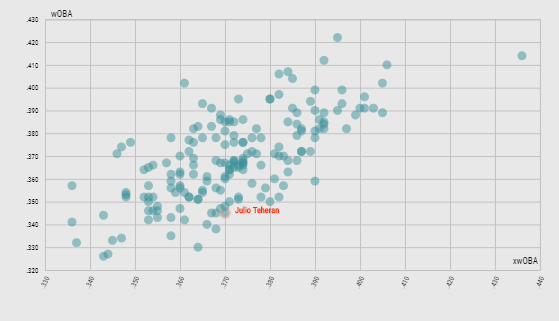
As you can see here, Teheran has been pretty fortunate, relative to his peers—not the most fortunate, but fortunate. But even relative to his own expected statistics, he’s also been fortuitous. In every year since the Statcast era began, he has outperformed his xwOBA. It should be noted that xwOBA is far more useful for hitters than pitchers, but these results are interesting nonetheless. At this point, it’s clear that xwOBA isn’t very predictive for Teheran, but it doesn’t appear to be descriptive, either. The question is: Why not?
Park Factors
Part of this is his park. Turner Field was skewed slightly in favor of pitchers, and since the inception of Atlanta’s new stadium, SunTrust Park, it appears that this hasn’t changed much. At home, Teheran holds a 3.50 ERA with a .299 wOBA over his career. On the road, those numbers fall to 3.77 and .312, respectively. Notably, his home xwOBA of .321 matches up with his road xwOBA of .322 over his career. Clearly, he’s been helped out by his park.
Here are Teheran’s home/road splits (wOBA-xwOBA), comparing Turner Field from 2015 to 2016 and SunTrust Park since then:
2015/2016, home: .280-.307 (-.027)
2015/2016, away: .330-.330 (.000)
2017-2019, home: .315-.333 (-.018)
2017-2019, away: .305-.315 (-.010)
This might feel like a lot to take in—and it’d be nice to have more data—but the way that I would interpret this is that Turner Field was friendlier to Teheran than SunTrust has been, but it’s difficult to say with certainty since we can’t eliminate other factors, and because we have limited Statcast data.
The numbers support that Turner and SunTrust are home run-suppressing environments, too, although the evidence is a little mixed. By wOBA-xwOBA, Turner Field has been the most fly-ball friendly environment in baseball (-0.076 wOBA-xwOBA) in the Statcast era, while SunTrust has been 19th.
The same can be said about HR/FB at both parks:
| HR/FB | Rank | |
| Turner Field (2015-16) | 9.1% | 27th |
| League Avg (2015-16) | 12.2% | |
| SunTrust Park (2017-19) | 16.4% | 23rd |
| League Avg (2017-19) | 17.9% |
Of course, these numbers are skewed to an extent because Atlanta plays every game in these parks. But these confounding factors should wash out some given the heterogeneity of Atlanta’s pitchers, and the fact that other teams play in their venues as well.
Defense
Since 2013, Atlanta—by both UZR and DRS—has more or less been middle-of-the-road in terms of fielding. So, on the surface, we can’t chalk this up to defense, right? Well, I’m not entirely sure looking at DRS or UZR as a whole accurately captures the interactions of pitching, defense, and park. Maybe I’m biased.
At the beginning of the season, FanGraphs rolled out some new “Plus Stats” that take numbers like K% or GB% and put them into a form (similar to wRC+ and OPS+) where it is much easier to make comparisons. Not only is it easier to make comparisons between years, but Plus Stats also make it easier to say that, since 100 is average, Shane Bieber’s 138 K%+ means he is striking out batters at a rate 38% better than league average. We’ll use these with Teheran.
Teheran has got a league-average line-drive rate, but he has a GB%+ of 87, and (for our purposes) more importantly, a 117 FB%+. This is the 17th-highest fly-ball rate in the league, or 89th percentile. So while Teheran isn’t an extreme fly-baller in the way that Marcus Stroman or Dallas Keuchel are extreme ground-ballers, he is extreme to the degree that, say, Kendall Graveman induces ground balls.
Because of this, perhaps looking at the Braves’ entire defense leaves us with a blind spot. Interestingly, in writing about teammate Luke Jackson, I did cite defense as one potential factor in explaining why he has been so unfortunate—but he’s one of the most extreme ground-ball pitchers in MLB. So, their overall defense has been about average, sure, but maybe we should focus on their outfield since fly balls are such an integral part of Teheran’s game.
Starting outfielders, by year:
2013: Justin Upton, Melvin Upton Jr., Jason Heyward
2014: Justin Upton, Melvin Upton Jr., Jason Heyward
2015: Jonny Gomes, Cameron Maybin, Nick Markakis
2016: Matt Kemp, Ender Inciarte, Nick Markakis
2017: Matt Kemp, Ender Inciarte, Nick Markakis
2018: Ronald Acuna Jr., Ender Inciarte, Nick Markakis
2019 has been more patchwork than anything due to injuries in the Braves outfield. Inciarte has been hampered, leaving Acuna to be a stopgap in center field and Austin Riley to shift over to left field from his native third base. Markakis has been injured recently as well.
What should stick out is that, at every step of the way, Teheran has had elite fielders at his disposal. From 2013 to 2014, Jason Heyward put up a 39 DRS. 2015 was mostly a wasteland, which contextualizes Teheran’s career-worst .026 wOBA-xwOBA on fly balls that year, but perhaps it comes as no surprise, then, that Teheran’s .008 wOBA-xwOBA on the year was his lowest of his career. Since then, he’s had Inciarte, who is quite good, patrolling center field.
But that’s not to say that Teheran’s infield doesn’t help him out. From 2013 to 2015, Andrelton Simmons accumulated a 94 DRS(!) at shortstop. To demonstrate how utterly insane this is, Nolan Arenado is second, with a 64 DRS in that same time frame. Admittedly, in the past two years, Teheran has a -.041 wOBA-xwOBA on ground balls. Simmons is no longer a Brave, but they tout a strong infield defense in Freddie Freeman, Ozzie Albies, Dansby Swanson, Josh Donaldson, and (sometimes) Johan Camargo—all of whom have combined for a 48 DRS over two years. It’s impossible to ignore that Teheran helps out his own cause too: He’s accumulated a 30 DRS over his playing career. Give the man a Gold Glove!
Ender To Flying Things
If you ask DRS, Inciarte is a top-five outfielder. If you ask UZR, he’s a top-10 outfielder. Baseball Savant, though thinks Inciarte is the best outfielder in baseball. His Outs Above Average (OAA) of 65 since 2015 is the highest in the league. Regardless, he’s a defensive force to be reckoned with. In two seasons in which he’s been healthy, he’s posted 99th percentiles in both OAA and outfielder jump. Importantly, on all fly balls, Teheran ranks second in the entire sample, with 38.5% going to center field. That means that a disproportionate amount of his fly balls are going to Inciarte, who is a demonstrably elite fielder.
And he makes plays like this:
https://gfycat.com/admirablesardonicdinosaur
When Inciarte has been on the shelf, the Braves outfield has suffered. Riley has slotted into left field admirably—and Duvall is great defensively too—but Acuna is a much superior fielder in left field than center field.
That’s not to say that he can’t still do this:
https://gfycat.com/linearforcefulchicken
Clearly, when Inciarte is in center field and Acuna is in left field, they constitute one of the most formidable outfield groupings in the league. Perhaps this all helps to explain why Mike Foltynewicz had an ERA in 2018 that was far below the rest of his numbers, too. Foltynewicz’s 112 FB%+ in 2018 rivals Teheran’s 122 FB%+ in 2018, and so he and Teheran have both been the main beneficiaries of Atlanta’s outfield.
In any case, this has been a valuable lesson that (a) defense is difficult to quantify, and (b) not all defenses affect pitchers equally. That’s not to say that we didn’t know these things before—we did—but it serves as a gentle reminder. Maybe the outcome of my analysis was obvious to you all. I think I’ve put forth a compelling explanation for the consistent outpacing of Teheran’s peripherals, but I would be lying if I didn’t see any ambiguity remaining. For instance, sure, Foltynewicz showed similar outpacing of his peripherals to Teheran in 2018, but why didn’t he in the years before that? Or, what about Kemp? He is the worst outfielder in the Statcast era, by OAA (-48).
At the end of the day, maybe we just have to accept that Teheran is weird, and he is unique, but he is very clearly not as skilled of a pitcher as he has been over his career. Overall, Julio Teheran is a slightly below-average pitcher, but if we’re talking results, his fly-ball tendencies and a remarkable trifecta of his current outfielders—and to a lesser extent, his home park—combine to make him an above-average pitcher. So for now, we can continue to expect Teheran to defy all of his ERA predictors, and his xwOBA too. So long as a healthy Inciarte is in the center with Acuna and Adam Duvall/Riley/Markakis flanking him, he’ll be just fine.
Featured Image by Justin Paradis (@freshmeatcomm on Twitter)
