


1856. That’s the exact number of balls that have flown over the fences in this 2021 MLB season (at least until 6/02, the day I’m writing this) which amounts to around 1.14 home runs per game.
That’s a respectable number, but it’s lower than the 1.28 and 1.39 home run per game rates we had in 2020 and 2019 respectively so, MLB, you can feel proud you got that right with the new ball, although you messed up with a bunch of others stuff while doing it, so let’s give you a C+ for effort.
All those homers are distributed between the teams in the following way:
Unsurprisingly, we find that the two teams having the players who lead the AL and the NL in HR category are at the top of the board, Atlanta and Toronto. Vladimir Guerrero Jr. and Ronald Acuña Jr./strong>. have been fantastic to start the season, so they help increase their team’s rates. At the bottom, the Mets and the Pirates have been anemic in home runs (and other offensive categories).
What can we learn from homers, and what’s important (if anything) about them for fantasy purposes? Let’s look for some tips on this for in-season evaluation.
Distance, Launch Angle, and Velocity
The average Distance for all homers hit this year is 401 feet and their average Exit Velocity was 104.8 mph. If you wonder what an average home run looks like this year, this one by Joey Wendle against Dean Kremer was exactly 104.8 mph and 401 feet of distance, at a Launch Angle of 22°:
https://gfycat.com/blinddefenselessarchaeocete
An average long ball, indeed.
On the extreme sides of the distance spectrum, the shortest home run this season was, until now, this barely-out shot by J.D. Martínez against Chris Mazza, a 97.0 mph, 326 feet shot, at a 27° LA:
https://gfycat.com/minorwildbubblefish
There is a good reason why that foul pole is called Pesky’s Pole, and it is not because it is far away.
On the other hand, we have this mammoth of a blast by Tony La Russa’s favorite player, Yermín Mercedes, who vaporized a Brad Keller slider at an EV of 113.3 mph, a launch angle of 24°, while traveling a fantastic distance of 485 feet.
https://gfycat.com/gracefuloffbeatkinglet
Ranging from barely-gone to obliterated-into-outer-space, distance is a simple and relatable way to classify homers, arguably the one that we, as fans, are most used to; we immediately react when we hear about a “500-foot” homer, even when that’s usually an exaggeration, as those are really rare.
But distance is a tricky stat to use because it only gives us one dimension of the characteristics of the home run, the most obvious one for sure, but it can also be deceptive (when used by itself) to gauge a player’s prowess for hitting homers.
We can take the following two homers by David Bote, for example; first a 366 feet flyball to the left side of Wrigley Field for his fifth of the year:
https://gfycat.com/scornfultangibleandeancondor
A nice long ball that easily cleared the left-field fence, although it’s 366, nowadays, it doesn’t sound that imposing. Now let’s take a look at this other homer, a 407 feet blast, 11% longer than the previous one, right through the middle of Wrigley Field:
https://gfycat.com/ablewarlikeasiansmallclawedotter
Bote’s 407-foot home run to center would have only been a home run in eight of the MLB parks and Bote was lucky to be playing in one of them. Meanwhile, the first one, at its unimpressive 366 feet, would have been a home run in every Major Leagues park.
This simple example shows why using distance for home runs can be a tricky thing, the place where you hit them while traveling said distance, matters a lot. That takes us to our first tip:
- Check Savant’s Home Runs Leaderboard to corroborate how many of the homers by a player would’ve definitely been no doubters (out in every park) and which were the result of a friendly park. This leaderboard right now shows that Ozzie Albies has only two no doubters so far, out of nine HR, which might be the first indicator that his home run production could slow, depending of course on other aspects.
Now, what about the other measurements we can do on homers (and any other ball in play), namely Exit Velocity (EV) and Launch Angle (LA)?
Actually, they can tell us more than distance. Beginning with launch angle, always take into account that there are certain launch angles that are better to produce a homer; we can get an idea of this if, as an example, we look at the frequency graphs (histograms) of the home runs connected at all the different LAs for seasons 2019 and 2021:
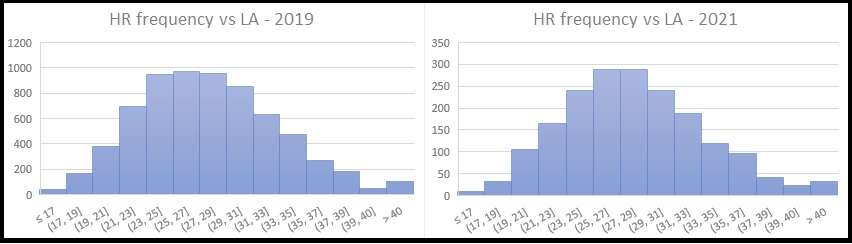
The X-axis shows buckets or bins of LA in intervals of 2 degrees. The Y-axis represents the number of home runs hit at those intervals.
We can see that more than half of the home runs in seasons ’19 and ’21, were hit with an LA from around 23 to 31 degrees, so checking for players who tend to have most of their balls in play hit in that LA range is a good idea.
A relatively simple way of doing this is via a Baseball Savant search like this one, in which we search for a batter’s (Albies in this case) balls in play, grouped by Player & Event and including LA, among other stats. You’ll get a list from which you can find out how many batted ball events (BBE) were in the 23-31° range out of the total.
This leads us to tip number two:
- It’s not the same to look for batters with an Average Launch Angle around 26° (middle point between 23 and 31 degrees) as looking for those that have more than half of their batted ball events in that 23 to 31 degrees range; the latter would yield better candidates as you will be minimizing the noise innate to averages.
Albies is hitting 18% of the balls in play in that range, that’s an improvement from 2019 and 2020 when it was 4% and 13% respectively, so there is an improvement here, meaning Albies is hitting the ball at more optimal angles for home runs this year.
Last, but definitely not least, let’s look at Exit Velocity (EV). This variable is arguably the most important when trying to predict, not only home runs productions but general hitting performance.
Hitting the ball hard is one of the most beneficial things a batter can do to improve his chances of being successful when batting (the most crucial being that a player must actually hit the ball).
As with launch angle, it’s best to stay away from looking at average EV, as the variances in the data could provide a misguiding result.
In this case, it could be better, at least initially, to use an indirect stat like Hard Hit rate (HH%) in which the percentage of batted ball events (BBE) that were batted at more than 95 mph is calculated. This rate correlates nicely with the number of home runs belted in-season, as we can see in this graph for 2019:
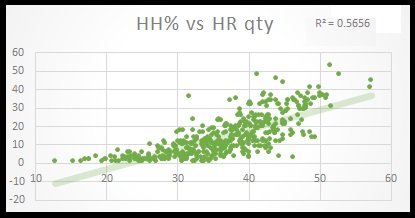
A 0.56 R2 means that 75% of the HRs could be explained due to HH%; that’s pretty cool. There are more advanced rates like Dynamic Hard Hit rate, Barrels%, Barrels/PA, and Blasts% that are indeed better and deserve to be analyzed and used but, for a first approach, HH% works very well, which brings us to our third and final tip:
- The higher the EV, the better; just be aware that you can’t hit hard the balls that you miss.
Ozzie Albies HH% is at his highest ever, so are his average EV, max EV, and Barrel%, he should continue producing home runs at a high rate, probably leading to a career year in that regard.
As we have seen, there is more than one way to look at the balls that leave the park; the data can help us categorize them and extract a lot of very useful details that can help us create better profiles for batters.
In the case of looking for power batters that help our teams in the home run category, watching launch angles and exit velocities, directly or indirectly via their related stats, are the way to go instead of just focusing on the raw number of long balls and distances.
Ozzie Albies progression in said stats is an example of how we can figure out, after a shortened season in which we didn’t have a full sample, the possibilities he has on the power side of batting; things look good for him this year in that regard and 30-35 home runs for the year are not out of the question for him.
Using these three statistics as the foundation for analysis is important but let’s also always keep in our minds their limitations.
Photos by Quinn Harris, David Kirouac, and John Cordes/Icon Sportswire | Adapted by Jacob Roy (@jmrgraphics3 on IG)
