


As the slug line suggests, we’ll be talking walks in this one. From a thousand-foot view, walks have not become especially more or less common in MLB to the degree that other outcomes such as home runs and flyballs have over the past couple of decades. The league-average walk rate was just under 10% at the turn of the century before hanging out between 8.5% and 9% for most of the 2000s. In the early-mid-2010s, free passes became slightly more scarce before rebounding to that 8.5% neighborhood as three-true-outcomes baseball took center stage, still sitting comfortably there in the mid-2020s.
From the highest single-season average walk rate in 2000 (9.6%) to the lowest in 2014 (7.6%), there hasn’t been a dramatic change over this quarter-century. A 2% fluctuation is rather meaningful when we’re talking about the entire league, but there have certainly been more prominent alterations to the way hitting has been taught during that timespan.
To walk on a regular basis, a hitter must not chase all that often. Right? Right! Kind of.
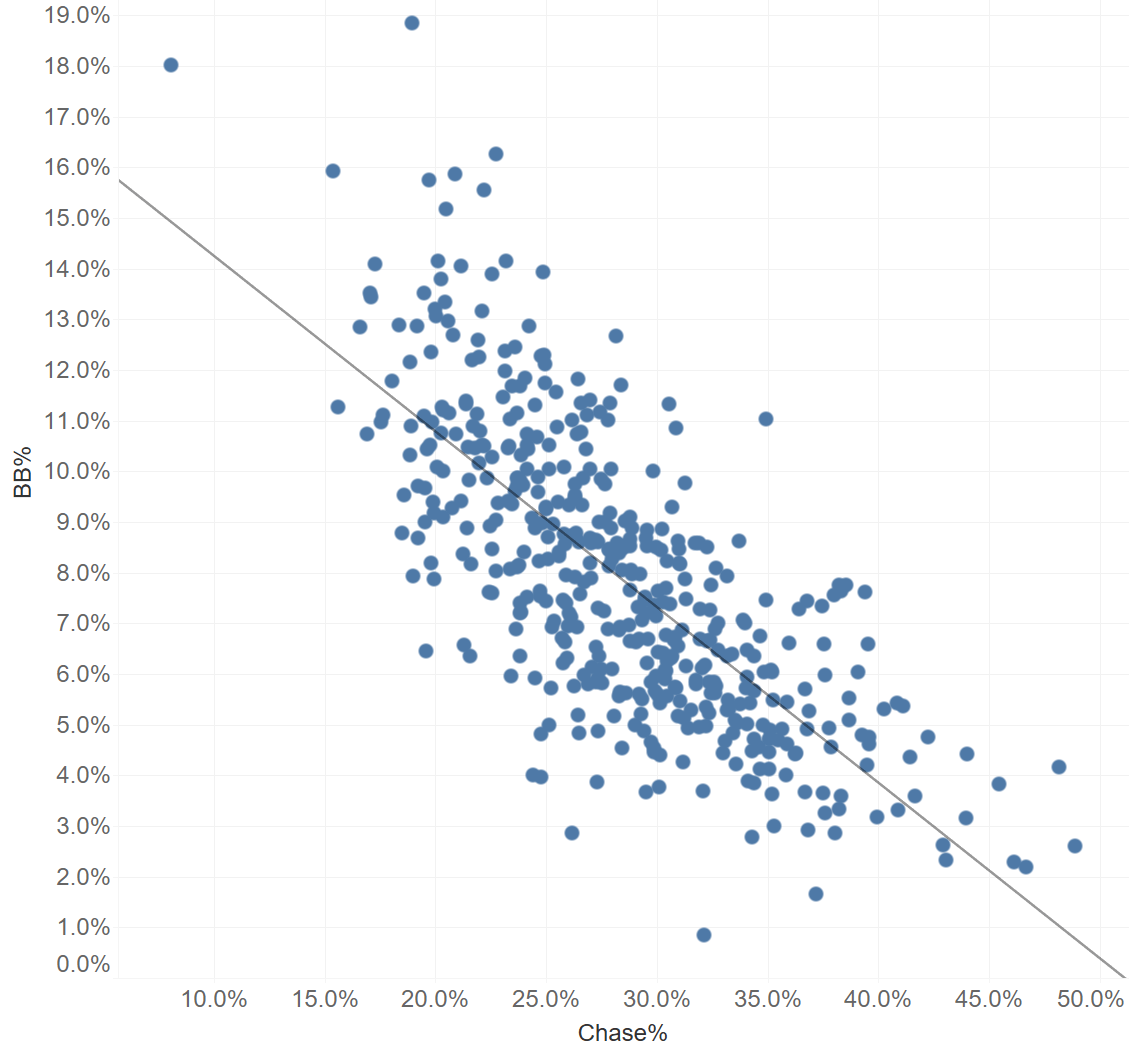
BB% and Chase%, 2025 (every MLB hitter with at least 100 PA)
In 2025, the R^2 value between BB% and chase% at the hitter level (min. 100 PA) was 0.54. That is, roughly 54% of the variance in BB% could be explained by chase%. There’s definitely a relationship there, but while I’m not sure exactly what I should’ve expected the R^2 to be, I thought it’d be higher. There are more hitters who don’t chase and don’t walk relative to the rest of the league, just as there are more hitters who do chase and still manage to frequently walk, than logic might dictate.
That second point especially warrants further explanation. How can a hitter walk a lot while chasing a lot? Longtime Pitcher List readers have probably clued in by now that this question is based on the Westburg Paradox, proposed by former PL writer Tanner McGrath two years ago in one of my all-time favorite pieces I’ve ever read on this site. The gist of it is parallel to what I’ll be investigating here, except it deals with hitters who maintain a low strikeout rate despite frequently swinging and missing, such as Orioles infielder Jordan Westburg. I’m not going to spoil Tanner’s findings here, but he did find a handful of very acute and repeatable skills associated with maintaining higher-than-average strikeout and whiff rates, and wouldn’t you know it: The same applies to the chase-walk conundrum. So, which players manage both high walk rates and high chase rates? How do they do it? How could they continue to do it in the future?
The Namesake
Bryce Harper’s Walk and Chase Rates, 2024-25
This whole phenomenon is named after Bryce Harper, and all you need to know about why is within the table above. In each of the past two seasons, he has posted a walk rate 2.5-3% above league average and a chase rate 4-6.5% above average. What gives?
In 2025, he saw, by a long shot, a lower rate of pitches in the strike zone than any other with at least 200 plate appearances. That is an ingredient crucial to being able to walk a line like this. A mid-30s chase rate isn’t as detrimental to a hitter if they see an inflated amount of non-competitive pitches to begin with. Harper gets pitched like this because he’s one of the most feared left-handed sluggers in baseball: Opponents would rather walk him than give him anything near the zone once he takes control of the count. Sometimes, they don’t even think about it, which is why he once went 0-0 with 6 walks and a hit-by-pitch during a game. Seriously! This is all for good reason. He’s a perennial 30-homer guy when healthy, and, when considered alongside how aggressive he is when he does get good pitches to hit, his relative lack of discipline outside the zone actually seems perfectly appropriate. Are there other Harper Paradoxers that also have a low zone rate, thereby leading to less detrimental chases and more room for a high walk rate?
Seeing Fewer Strikes
You bet there are. These five players all have, to varying extents, one thing in common: Raw power that pitchers are rightfully intimidated by. Naturally, Harper boasts the most extreme high-walk, high-chase combination of the group, but Raleigh has been an obvious runner-up to that title for the past two years, and for similar reasons. Nobody wants to give him anything to hit because he can pull, lift, and barrel from both sides of the plate, so he can be aggressive while still taking his fair share of free passes.
Anthony Santander clubbed 44 homers the year before last but has never had a single-season OBP higher than .318 and chases on the regular; pitchers, therefore, have little incentive to challenge him. Jasson Domínguez displayed merely half-decent game power in his first extended go-around in New York, but his reputation precedes him – he was talented enough to be given the nickname “The Martian” as a teenager. No reason for pitchers to tempt fate with him either. And then there’s Cruz, who can hit a ball harder than literally anyone but has non-competitive bat-to-ball skills. Throwing him something he can drive may as well be an occupational hazard.
A lower proportion of hittable pitches is a consistent thread with the most notable individual exceptions to the intuitive chase-goes-down, walks-go-up rule. It’s the most logical explanation we have so far, but if you plot chase rate and walk rate by hitter in 2025, you’ll see that it doesn’t address all the discrepancies by itself. Let’s see what else stands out.
Swing Decisions
When looking at the 2025 leaderboards for Decision Value, Pitcher List’s in-house metric for evaluating hitters’ swing decisions, I noticed that all five of the hitters in the above table received below-average grades from the model. Are there any counterintuitive patterns that come to the surface if we slice and dice their swing rates into contextual buckets, such as count states?
Not really. Early-count aggression is a great way to avoid both walks and strikeouts, so I hypothesized that passivity in the first few pitches of an at-bat would be a trait that all these Paradoxers share, but it’s clearly not the case for everyone here except Santander. Harper lets it rip no matter the count. Raleigh and Domínguez are also more aggressive than average in 0-0, 1-0, and 0-1 situations. Nothing conclusive can be taken away from Cruz’s numbers here; he swings less than average in early counts but chases more, which seem like trivial reasons for his place among this sample in comparison to his 44.4% zone rate. Hitters can change their approach depending on the count, but outside of Santander, it cannot be argued that any of these guys are deliberately setting themselves up to get in deep counts. We can verify this, though, based on how often they control the count regardless of their swing decisions.
Count Leverage
Below are the same five hitters along with the frequencies at which they’re ahead and behind in the count, the difference between those two rates, and the rate at which they put balls in play in 0-0, 1-0, and 0-1 states.
This is a lot more conclusive. Notice how none of them are ahead in the count more than the average hitter? Some are behind more than others, but none of them own count leverage at a high rate. Harper often puts balls in play early because of how much he swings in those spots, and so does Dominguez because he had the highest contact-ability of any of the guys on this list who had a high early-count swing% in 2025. On the whole, this seems substantial enough to make another takeaway: The Paradoxers aren’t often ahead in the count, but they aren’t often behind either, instead finding themselves in neutral situations, which theoretically makes it easier for them to get into deep counts when they aren’t jumping out to a 3-0 advantage every time.
Once you get to three balls, though, your odds of walking obviously increase. What about hitter behavior in those spots?
Stop at the Red Light
To discern the three-ball approach, I’m going to deploy what I call Green Light%, which is simply swing percentage in 3-0 and 3-1 counts. Since hitters who swing less here relative to all other counts stand a better chance at walking, those who fit that description while chasing more than their walk rate suggests are thereby Paradoxers. Four more of them enter the conversation below. All of them have a below-normal green light%, as do most of the ones we’ve established.
Matt Wallner’s walk rate went up by more than 2% compared to 2024, even though he chased slightly more. The difference? In 2024, he had a swing rate in the mid-40s in 3-0 and 3-1 counts. It decreased to the other side of average in 2025. Despite having terrifying raw power, he’s the only one of this group with a zone% over 50. The change in behavior in 3-0 and 3-1 counts appears to be the driving force. The recently-traded Luis Robert Jr. may have had poor results, but he showed the most patience we’ve seen from him in a long time last year while showing a similar increase in selectivity in prime hitter’s counts.
Alejandro Kirk saw a subtle bump in walk rate even though there was a slight uptick in both chase and rate of pitches he saw in the zone, and consistently being one of the most patient hitters in “green-light” scenarios bridges at least some of that informational gap. In my opinion, José Caballero is the most interesting Paradoxer of them all because even though his power indicators are below-average across the board and he’s known for having killer speed on the bases, he drew more walks than anyone on the list with a merely pedestrian chase rate. In 2024, his chase rate was closer to the mid-30s and his walk rate suffered, but his 2023 and 2025 were similar, with the noticeable difference being 3-ball passivity. Not wanting to get beat by his speed is understandable, but his zone swing rates have been average at best the past few years. Throw him more strikes!
Santander is the most aggressive 3-ball hitter of this bunch, but we’ve already chalked up his status as a Paradoxer to the low zone rate and early-count passivity. If I had to pick anyone on this list to walk less in 2026 if all else remained equal, it would be Dominguez. The only factor he really has going for him is the zone rate, as he’s aggressive both early (and makes contact in those spots to boot) and with three balls. Meanwhile, each of Harper, Raleigh, Cruz, Wallner, and Robert figure to have low green light rates because they don’t get anything to hit if they find themselves ahead by that much. We know where the ball would end up if they did.
The Harper Paradox
So, you want to take walks in the big leagues even though your chase rate suggests you shouldn’t? Three steps: Be a talented hitter to the point that you don’t see many strikes to begin with. Next, you’ll want to either be passive early in counts or be aggressive instead without falling behind so far that clawing back to 3 balls is unreasonable. If the latter tendency describes you better, then when you do get to those three-ball situations, be selective.
Of course, there’s another side to this coin: The low-chase, low-walk guys, who are a more populous demographic than the one I’ve just examined. Curiously, Jordan Westburg himself inhabits that area – he has never met an early-count strike he didn’t like. Most of the rest of those names (Caleb Durbin, Alex Verdugo, Santiago Espinal, Dane Myers) are either early-count BIP guys like Westburg, or they get bat on ball so often that four straight taken outside the zone is rendered an unlikely outcome.
Many thanks are due to Tanner McGrath for inspiring this walk-oriented counterpart to his Westburg Paradox. It’s never a bad thing to remind ourselves that the path between process and results in baseball is never as straightforward as it seems, and the most simple and common presumptions for why certain outcomes take place don’t always hold up in practice!
