


Jordan Westburg is breaking out in Baltimore.
The O’s young infielder is slashing .291/.351/.508 with a 146 wRC+ through his first 200 plate appearances this year. Throw in his top-tier defense (+3 OAA, +2 DRS), and he’s amassed 2.4 fWAR, the 11th-most among qualified position players and the most among third-basemen.
But some advanced stat nerds are a little confused about his early-season success, mostly because he shows surprisingly poor plate discipline. Westburg ranks below the 28th percentile of qualified players in both whiff rate (30%) and chase rate (32%), a little too free-swinging for most analysts.
Yet, Westburg has only struck out 41 times, a rate well better than the MLB average. He’s actually lowered his strikeout rate by five points compared to 2023 despite his swinging strike, whiff, and chase rates all increasing rather significantly.
How can a player who swings and misses at everything … not strike out? It doesn’t compute. The metrics are too closely correlated. It’s paradoxical.
Thus, I introduce The Westburg Paradox.
Prior Correlations
First, it’s important to note that whiffs and strikeouts are very closely correlated.
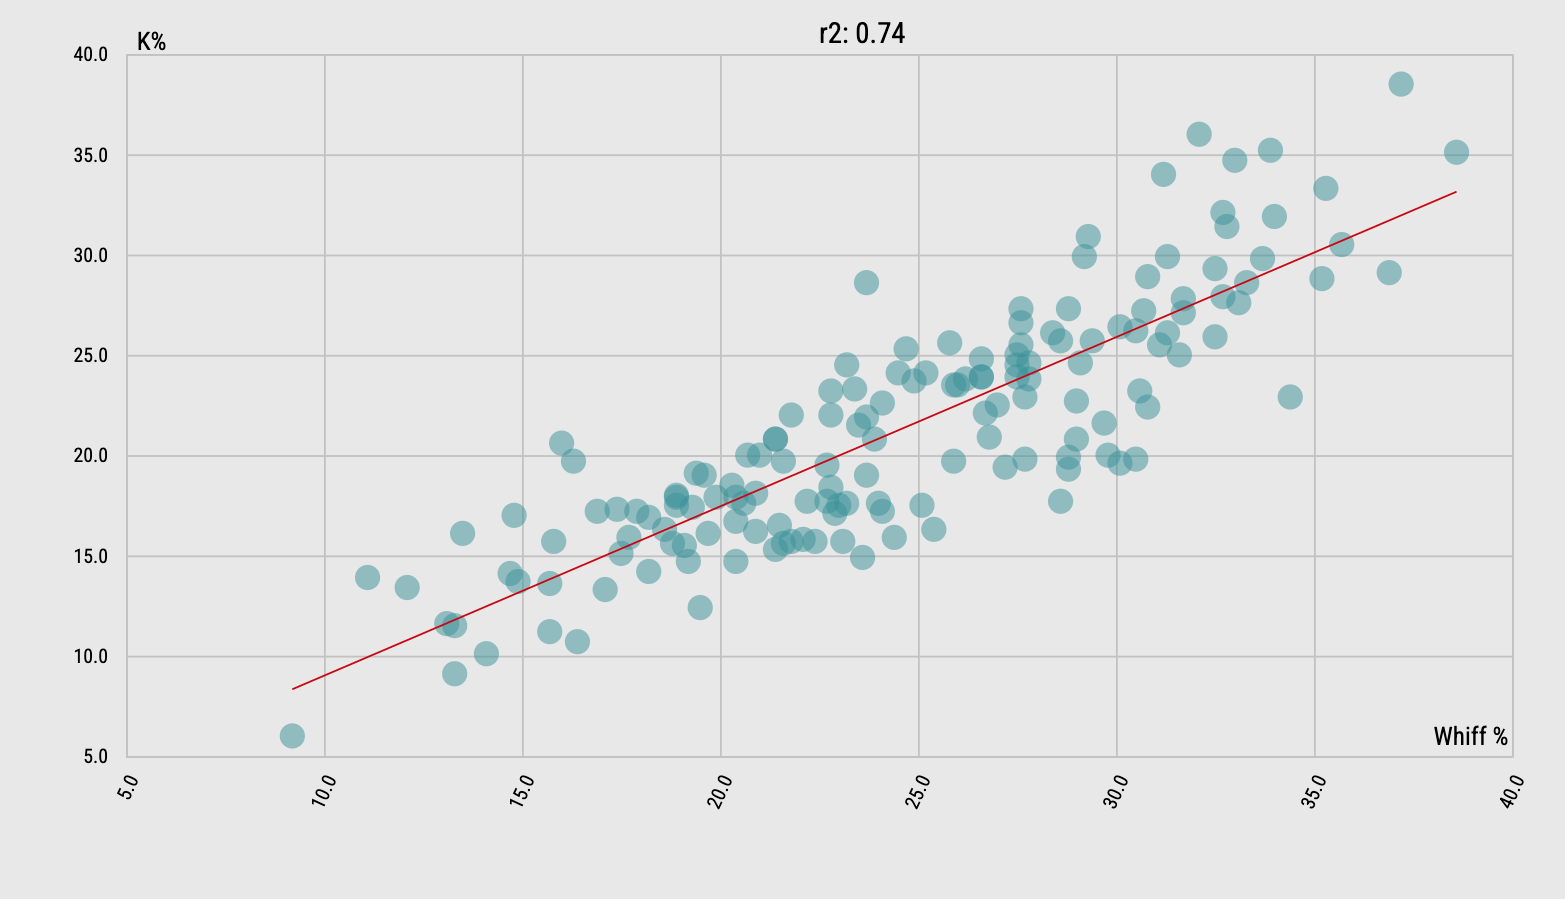
So, the fact that there are Westburgs out there with high whiff rates and low strikeout rates represents a statistical anomaly.
Therefore, I decided to dive deep into this potential paradox, asking the following questions:
- Are there players who pair high whiff rates with low strikeout rates?
- How often does it happen?
- Are there players who can sustain it?
- What does it take to sustain it?
So, I started compiling numbers from Pitcher List, FanGraphs, and Baseball Savant, resulting in this stupidly detailed spreadsheet:
Since 2021 – or after the COVID-shortened year – there have been 66 occurrences of a player pairing a whiff rate over 25% (just above average) with a strikeout rate under 21% (just below average) in a single season with at least 100 plate appearances. For context, there have been 1692 single seasons of at least 100 PAs during that stretch, so the Westburg Paradox has occurred about 4% of the time.
That includes 17 players from this season, with the sample ranging from guys from Javier Báez to Shohei Ohtani to Westburg himself. Of these 66 occurrences, six players have accomplished the Westburg Paradox in multiple seasons.
I think I’ve found out what they all have in common. The spreadsheet introduces a range of statistics that I believe influence the Paradox – there’s a glossary on Sheet 4 for those confused by any metric.
Let’s weave an actual narrative from these seemingly disconnected statistical threads.
Swinging … More?
My first instinct was that our sample would include hitters who don’t swing much.
For example, Kyle Tucker and Rafael Devers have significantly improved their year-over-year plate-discipline metrics by laying off, especially at pitches outside the zone. Given that guys in our sample whiff so often, they are likely not to have great contact numbers – these guys aren’t accomplishing this in a Luis Arraez or Steven Kwan fashion. So, I thought that swinging less would introduce fewer potential strikeouts for higher-whiff hitters.
But the real result of swinging less is just more walks, not fewer strikeouts. Tucker is actually whiffing more this season (20%) than in 2023 (18%), while Devers hasn’t changed course (26%).
Our numbers tell a different story. The Westburg Paradoxers swing much more than the average hitter.
One player in our sample earned a spot among the Paradoxers with a swing rate of over 60%, and he’s a repeat offender – Luis Robert Jr. swung at over 61% of pitches between 2021 and 2022. Four players earned a spot with obscene chase rates over 45% – 2023 Yainer Diaz, 2023 Harold Ramírez, 2022 Hanser Alberto, and 2022 Oscar González.
Five years ago, former Pitcher List analyst Nick Gerli wrote a similar piece on this topic, exploring the relationship between whiffs and strikeouts, specifically how and why the two metrics don’t always align. Among his findings are three things I find worthy of re-hashing.
- There is “no discernible relationship” between chase rates and strikeout rates, which I found absolutely fascinating and helps explain our problem a bit.
- Swing rates don’t exhibit a relationship with strikeout rates “on the whole.”
- However, and more importantly, swing rates do “have a significant effect on why certain players over or underperform their expected strikeout rates.”
The third point demands deep exploration.
Per Gerli, based on the close correlation between whiff rate and strikeout rate, we can reasonably predict a player’s strikeout rate based on their whiff rate via the following formula: (Whiff-Predicted Strikeout Rate = Strikeout Rate*0.8662 – 0.0014).
Therefore, Gerli introduced K-Delta, defined as (Strikeout Rate – Whiff-Predicted Strikeout rate). It’s an excellent indicator of who is over or underperforming their expected strikeout marks. If you have a negative K-Delta, you’re striking out less than you should, and vice versa.
As it turns out, swing rate is a potential predictor of K-Delta. Across every MLB season with at least 100 plate appearances between 2021 and 2023, a 1% increase in swing rate was associated with a 0.2% decrease in K-Delta, explaining 21% of the variation.
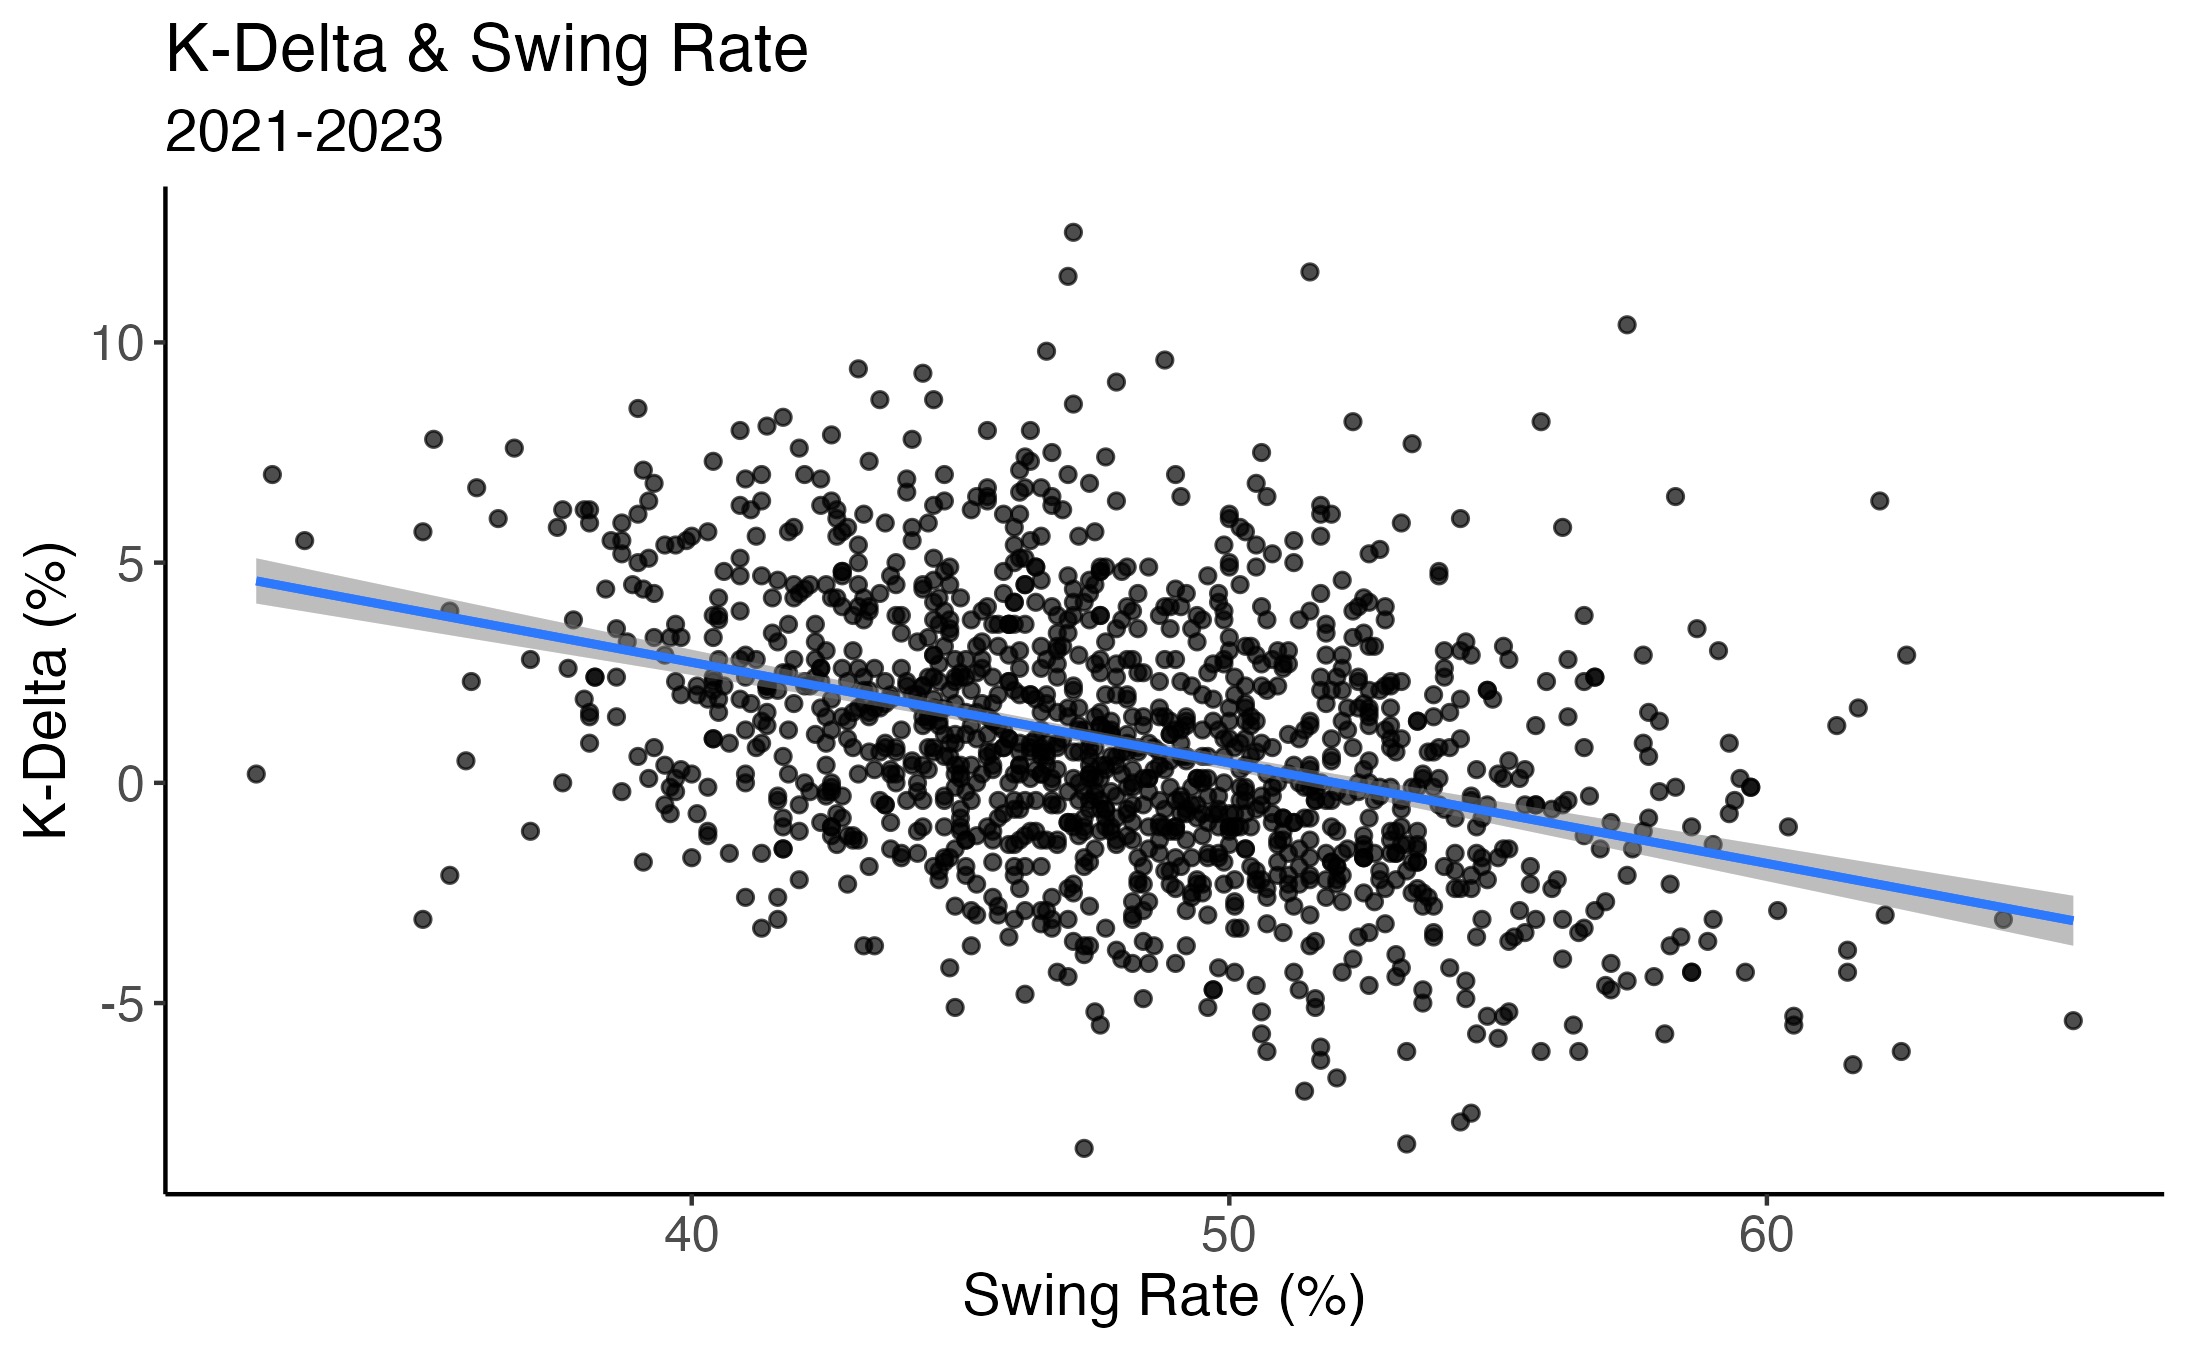
So, guys that swing more often whiff more, but they also significantly overperform their Whiff-Predicted Strikeout Rates.
So, it’s not surprising to see Paradoxers boast high swing rates. But, what’s up with that? How could swinging more result in fewer strikeouts? It still seems paradoxical.
Consistent Aggression
The biggest thing I noticed during my statistical exploration was the shockingly higher-than-average aggression rates.
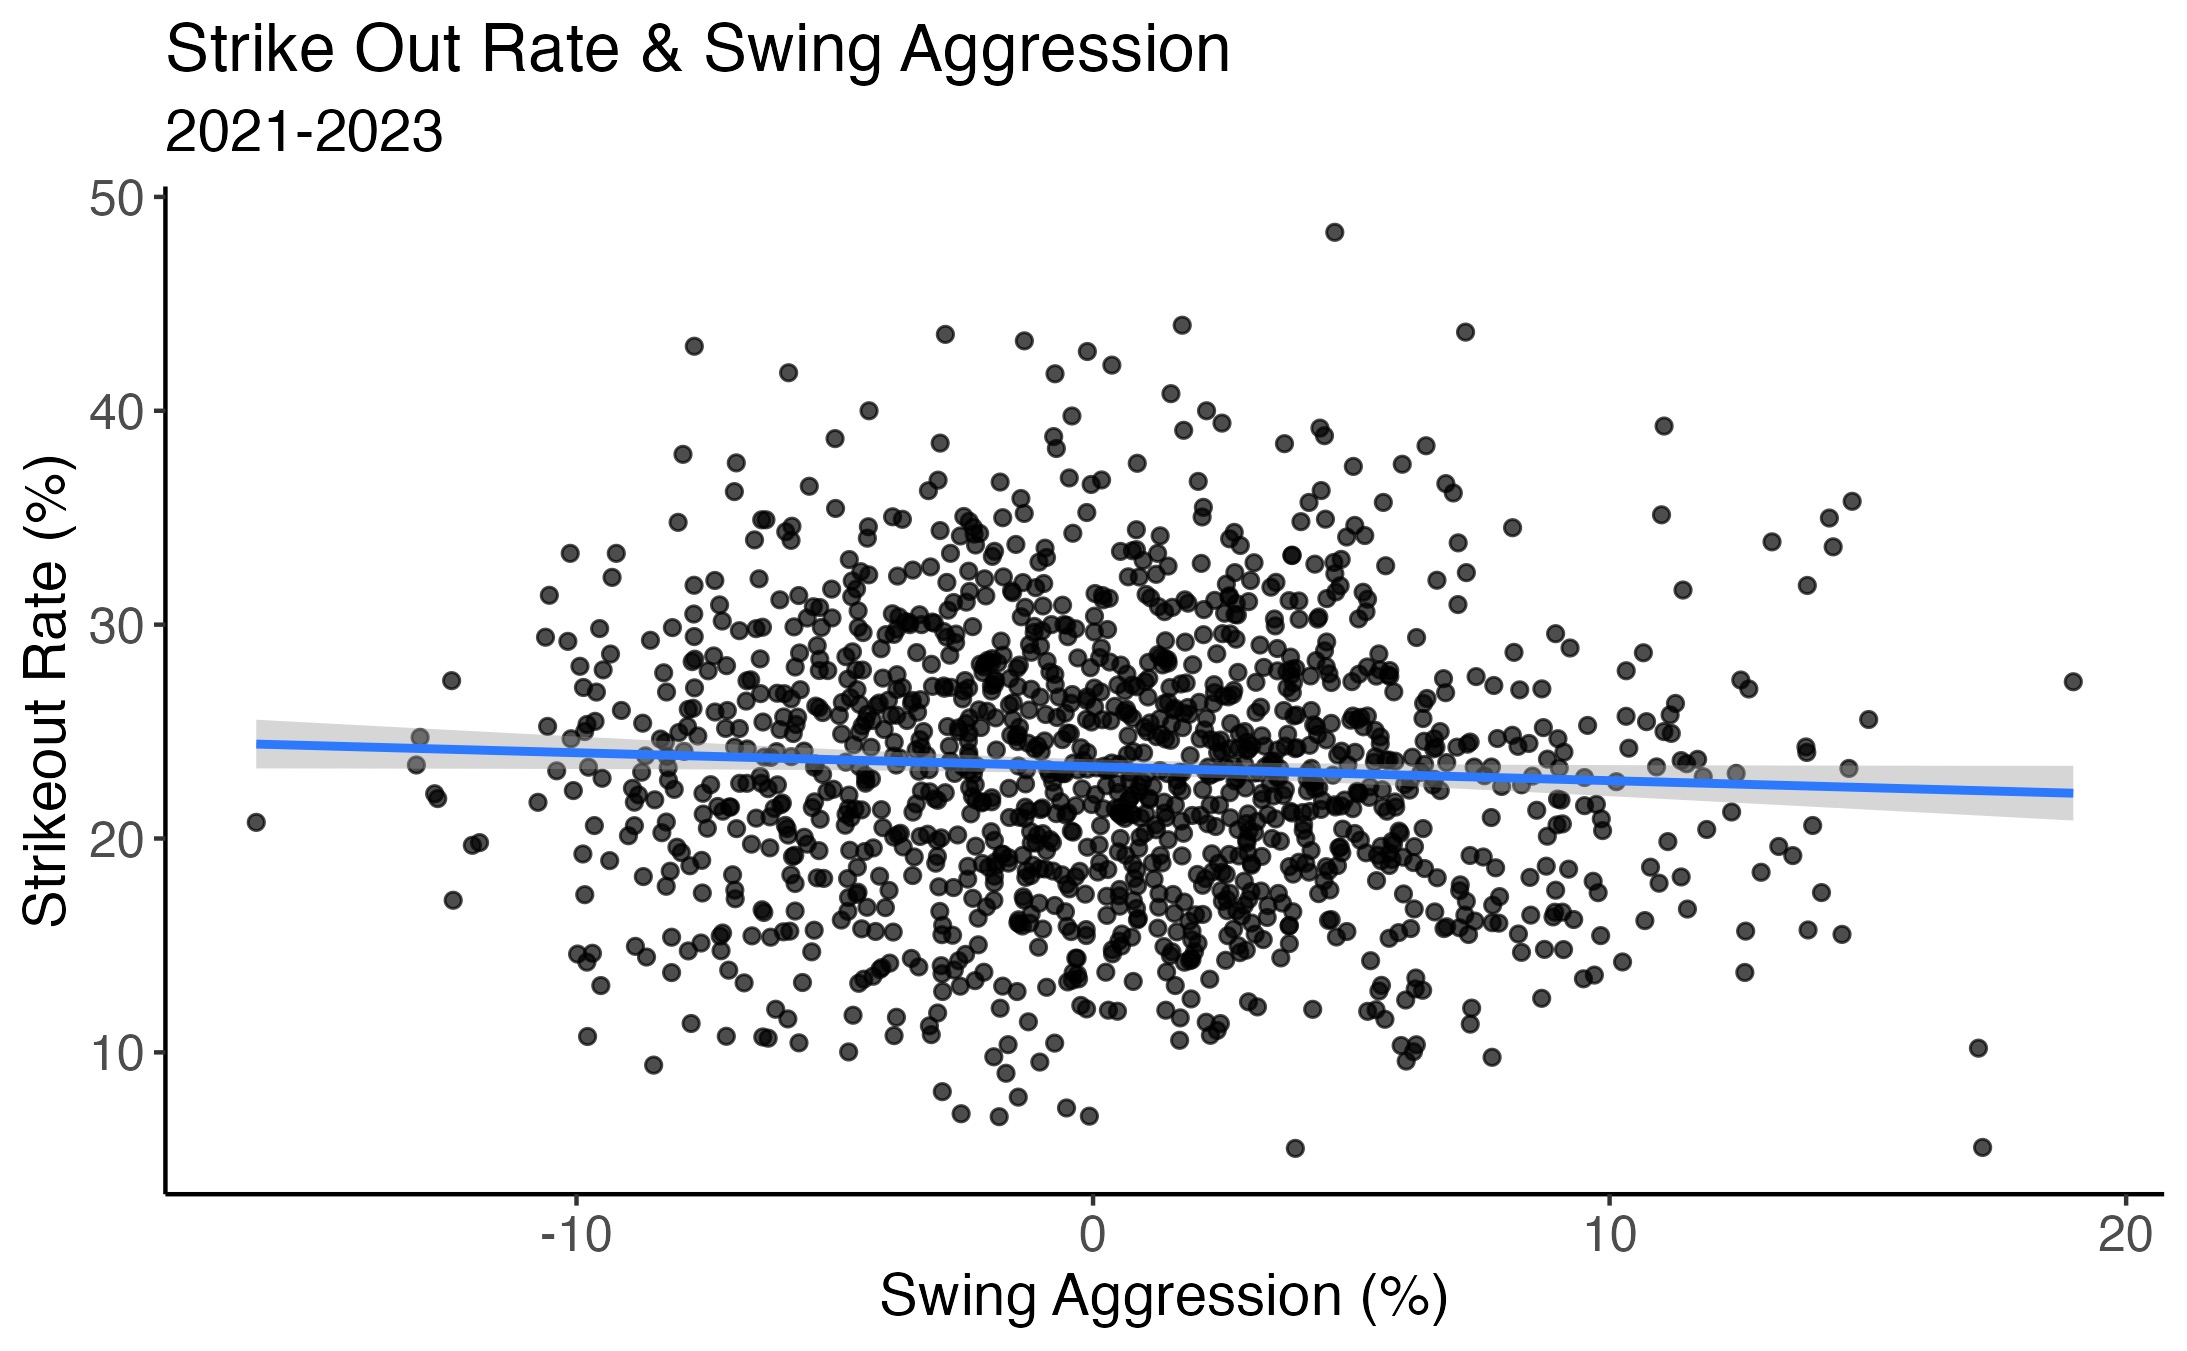
Pitcher List records a metric called Swing Aggression, defined as “how much more often a hitter swings at pitches, given the swing likelihood of the pitches they face.” It’s measured in percentage units above or below the MLB average, which is set at zero.
In our sample, the 49 Paradoxers from 2021 to 2023 had an average Swing Aggression rate 5.3% higher than average. The 17 guys this season have posted a 2.6% average Swing Aggression rate.
This actually pans out across the league. Across every MLB season with at least 100 plate appearances between 2021 and 2023, a 1% increase in Swing Aggression is associated with a 0.09% decrease in strikeout rate.
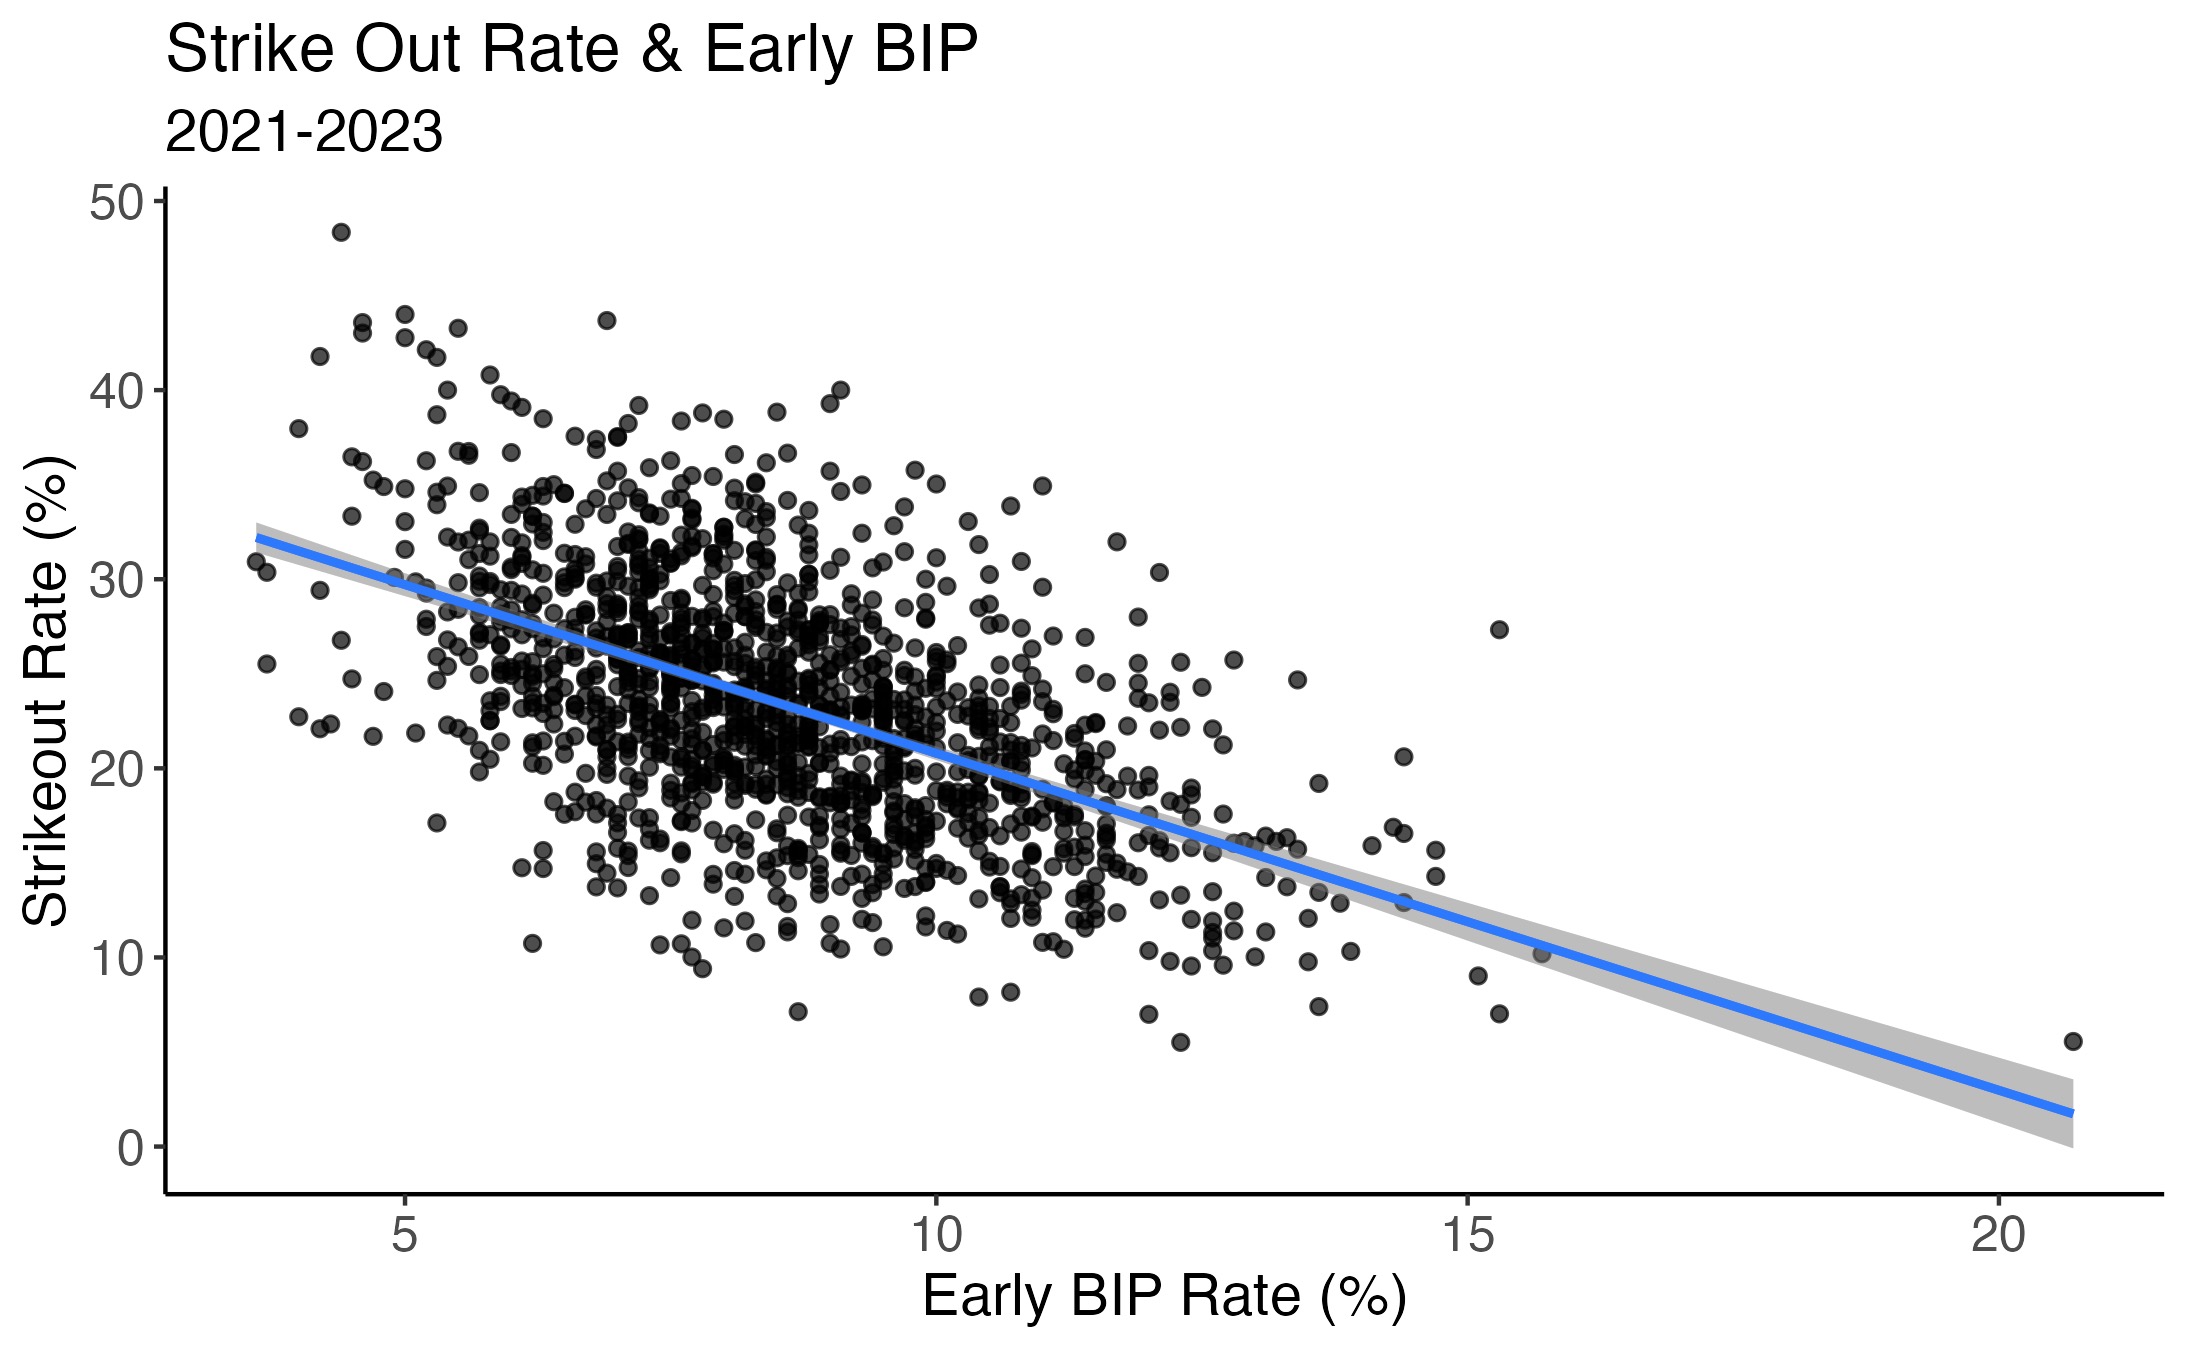
Diving even deeper, Paradoxers are typically more aggressive early in counts. For example, our sample of players has high early-count balls-in-play rates and low true-first strike rates. They also spend a tad more time ahead in the count and less time in 2-strike counts.
This also pans out across the league, with an even stronger relationship to strikeouts than Swing Aggression. Every 1% increase in early ball-in-play rate is associated with a 1.5% decrease in strikeout rate, explaining 21% of the variation in strikeout rate.
Generally, these guys aren’t showing excellent strike-zone judgment or making ideal swing decisions. However, the guys in our sample are producing exceptionally high in-the-zone swing-decision values.
This is likely because there’s a relationship between swing aggression and in-the-zone decision value, as swinging more (and harder) will lead to better results on pitches in the zone, although worse results on pitches in chase zones.
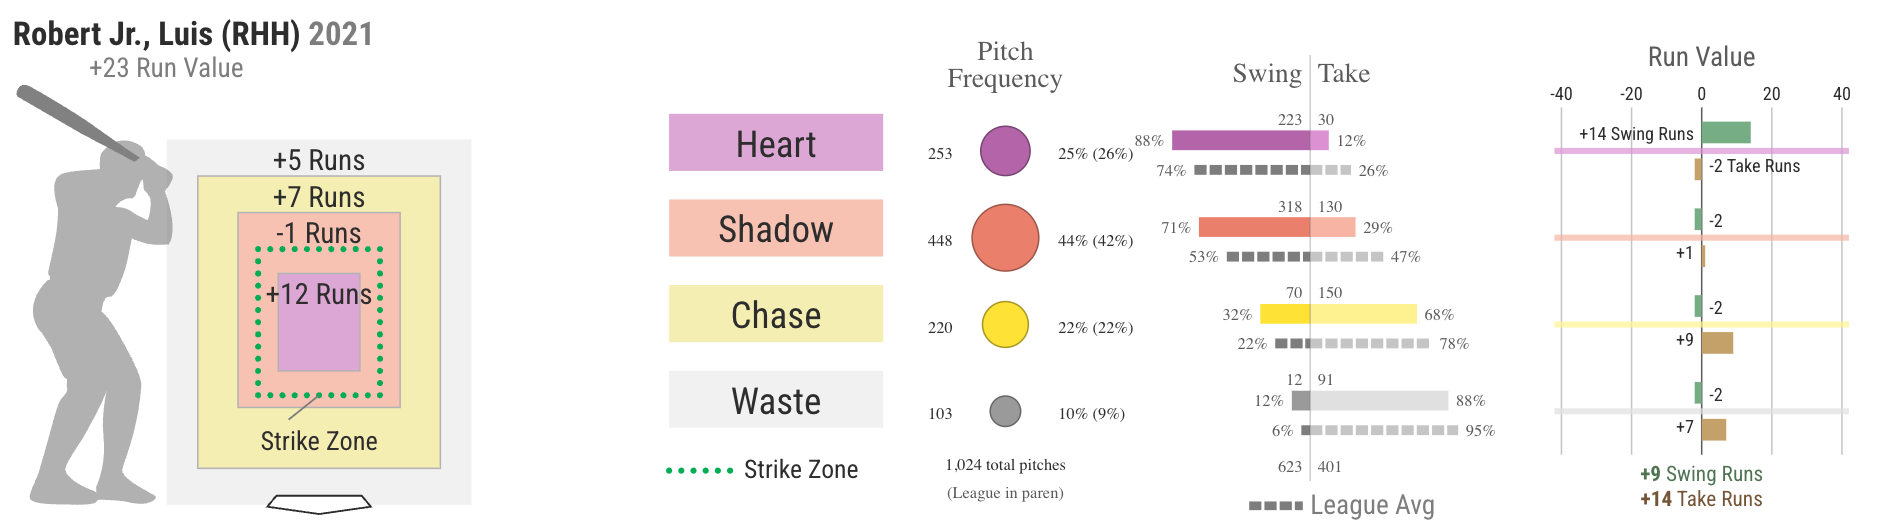
For example, let’s talk about repeat Paradoxer Luis Robert again. In 2021, Robert posted a 145 zDV+ mark, meaning he was generating about 45% more value than the league-average hitter on inside-the-zone swing decisions. He paired that with an 80 oDV+ mark, meaning he was generating 20% less value than average on outside-the-zone swing decisions.
That tracks. His 14% swing aggression mark in 2021 is the highest among any Paradoxer in our four-year sample. The same goes for his 86% zone-swing rate that year. As such, Robert earned a +12 swing/take run value mark on pitches in the heart of the plate that season, but he struggled more with offerings around the edges.
Shortening Up?
Among the most overused cliches in baseball is the ol’ “shortening up with two strikes” shtick. When you’re facing a putaway situation, the key should be making short, contact-based swings, often by choking up on the bat. But does that actually bear out?
The answer is fuzzy.
For what it’s worth, many of the players in our sample shorten their swing slightly with two strikes, even as the league-average swing length remains the same.
I don’t think this really explains much. Two players in our 2024 sample actually have longer 2-strike swing lengths – Javier Báez and Brandon Drury.
Before investigating this topic, I assumed that many Paradoxers would accomplish Westburg status by getting lucky in putaway situations. A high whiff rate paired with a low putaway rate is a good situation to assume regression. That’s true for some guys. Elias Díaz struck out 22% of the time over the past two seasons with a 30% whiff rate, but his putaway rate is five points lower in 2024.
Díaz seems like a guy primed for regression, and I wouldn’t be surprised if he wasn’t a Paradoxer much longer.
The same situation could apply even more to Carlos Santana (15% putaway, 79th percentile) and Austin Wells (16% putaway, 67th percentile) because Santana (43% swing rate, 20th percentile) and Wells (48% swing rate, 50th percentile) don’t swing as often as Díaz (56% swing rate, 91st percentile) and many other Paradoxers. Then again, Santana and Wells have held consistent putaway rates over their careers.
But many of our Paradoxers have relatively high putaway rates, like Baez (22%, 28th percentile) and Josh Bell (23%, 23rd percentile). Overall, the average putaway rate of our 17 Paradoxers (18.4%) is right around the MLB average (19.1%).
Instead, I’m going to default back to Gerli’s 2019 article and introduce his aptly named Whiff Diff statistic, defined as (2-Strike Whiff Rate – Whiff Rate). If you have a negative Whiff Diff, you’re whiffing much less in two-strike counts than you are overall, and vice versa.
The MLB average Whiff Diff is about -0.6%, but our 2024 Paradoxers have posted an average Whiff Diff of -3.4%. The same situation applies over the prior three seasons.
Some of these guys boast super negative Whiff Diffs. Díaz’s -7.5% mark is the second-most extreme among 2024 Paradoxers. Eloy Jiménez posted a -11.8% mark last season, whiffing only 18% of the time in two-strike counts compared to 30% overall.
Ultimately, only three of this season’s 2024 Paradoxers – Baez, Bell, and Jesus Sanchez – boast positive Whiff Diff rates. Who would’ve thought?
In his 2019 article, Gerli summarized his Whiff Diff findings:
“The exact mechanisms behind this phenomenon are unclear. Are these players actually better with two strikes than other players, or is their early count approach just overtly aggressive and their two-strike approach more reflective of their baseline skill?”
I’m beginning to believe it’s the latter. I genuinely think the guys in our sample are making a conscious decision to be more aggressive early in counts.
The Westburg Theorem
Let me introduce my thesis.
Yes, there is a way to sustain low strikeout rates with high whiff rates. The key is consistent aggression, especially early in counts.
- Paradoxers put more balls in play earlier in counts, thus avoiding getting into strikeout situations moreso than the normal hitter.
- Paradoxers are less likely to take called third strikes, especially with negative Whiff Diff rates.
- Paradoxers are ahead in the count more often. This correlation is less strong – they’re only in hitter’s counts about a half-percent more than the MLB average – but still has an impact. These guys don’t generate as many early-count strikes – about 2% less – which has a similar effect.
Ultimately, Paradoxers are swinging more freely, more often, and more aggressively earlier in counts than most hitters. Thus, they’re actually generating the majority of their whiffs in non-putaway situations, thus avoiding more whiffs in two-strike counts. Even if they perform similarly in two-strike counts – which they don’t – they’re putting the ball in play more often before they get there, and they’re much less likely to strike out looking. So, they overperform in the strikeout department.
The opposite of this would be someone like Xander Bogaerts. He almost always takes first pitches – his 60% TF-Strike rate is higher than 97% of MLB hitters this season – meaning he’s allowing more early-count strikes (30%, 96th percentile) and seeing more 2-strike counts (30%, 43rd percentile).
In contrast to Paradoxers, guys with low whiff rates and high strikeout rates are guys who swing less, put fewer balls in play earlier in counts, end up in more two-strike counts, and take more called third strikes. Lo and behold, Bogaerts boasts a 2.1% K-Delta this season.
Let’s compare Xander’s early-count passivity to a repeat Paradoxer – Corey Seager.
During Seager’s three consecutive seasons on the Westburg list (2021 to 2023), he saw 1592 total first pitches and swung at 834 of them, a cool 52%. As a result, he generated 226 whiffs, good for a reasonably high 27% rate.
But he also put 335 of those first pitches into play, meaning he never saw a second pitch or two-strike count in 21% of those appearances. During that same three-year stretch, Bogaerts put 121 first-pitch balls in play, meaning he went on to see a second pitch in 94% of those 1892 plate appearances.
Lo and behold, Seager posted a -6.8% K-Delta during the three-year stretch – and that’s despite a relatively tame -2.4% Whiff Diff.
Seager – alongside many other Paradoxers – is consistently aggressive early enough in the count that he doesn’t let as many opposing pitchers get to two strikes. He earns plenty of whiffs early in the count, but he doesn’t allow himself the opportunity to turn as many of those swinging strikes into strikeouts.
The Ultimate Paradoxer
There’s a reason Robert Orr named his new metric – SEAGER – after Corey.
SEAGER is an acronym for SElective AGgression Engagement Rate, and it’s designed to quantify “selective aggression on hittable pitches.” The best way to simultaneously increase your power and plate discipline numbers is by swinging only – and aggressively – at pitches you can smash. That’s how the best hitters reach their peak.
Seager leads SEAGER for a reason. Nobody is as smart or aggressive on swing decisions. So, it makes sense that he could fit into our high-whiff, low-strikeout model.
He’s consistently ahead in counts, with uber-low TF-strike and early-count strike rates. He has very high zone-swing and swing aggression rates. Given his aggressive nature, he’s generally whiffed over 25% of the time. But, given his selective nature, more of those whiffs are coming in hitter’s counts or non-putaway situations: Of Seager’s 792 whiffs during his three-year stretch in the Westburg Realm, 217 of them have come when he’s ahead in the count, compared to 196 in two-strike counts.
Seager is an aggressive swinger, but he only swings aggressively at pitches he can mash, so his plate-discipline numbers are relatively solid, and his advanced swing-decision metrics are elite.
But there’s more than one way to skin a cat. Only one other player has sustained a high whiff rate with a low strikeout rate across a three-season stretch, but he’s done it in a drastically different way.
Honestly, I might rename this the Harold Paradox.
Over the past three seasons, Ramírez pairs a 27.4% whiff rate with a 17.7% strikeout rate, which legitimately seems impossible. He ranks among the league’s worst at getting ahead in the count (10th percentile) and avoiding first-pitch strikes (5th percentile). He also chases everything, with a 49% chase rate that ranks dead last among MLB players this season.
But what is Ramírez good at? He attacks early and often, ranking well above average in early ball-in-play rate (16.7%) and swing aggression rate (12.3%). During this three-year stretch, the MLB average for early-count swing rate (0-0, 0-1, 1-0, 1-1) is 23%, but Ramirez has swung at 31% of early-count pitches.
Similarly, Ramírez has swung at a whopping 58% of pitches this year, the eighth-highest mark among players with at least 100 PAs. But he pairs that with a stark Whiff Diff mark, a whopping -8.2% that’s the most negative among any 2024 Paradoxer. So, lo and behold, he’s posted a -7% K-Delta through his first 157 plate appearances.
Ultimately, I think the key to overachieving in the strikeout department – thus achieving Westburg Paradox status – is consistent aggression. Early swings will earn you more whiffs, but they’ll also earn you more balls in play, thus fewer 2-strike counts and backward Ks.
Here’s the Ultimate Paradoxer doing what he does best, all in early counts:
Photo by Icon Sportswire | Adapted by Aaron Polcare (@bearydoesgfx on X)
