


Perhaps the most important offseason of a player’s career is his first after making his big-league debut. Whether he contended for Rookie of the Year or was an up-and-down guy amidst struggles in his first taste of the bigs, there are plenty of adjustments for these young players to make. After an MLB club has a season’s worth of data on a hitter, you can be sure they know his exact strengths and weaknesses as well as a game plan to exploit them.
That’s one reason I love using our PLV Decision Value stat to analyze young players, and especially those in their second seasons. It’ll give us a good look at if they’ve fine tuned their approach, stayed relatively the same, or if pitchers have found a way to get them to swing at bad pitches.
If you’re unfamiliar with Decision Value, it helps us measure a hitter’s ability to recognize which pitches he should and shouldn’t attack. It’s similar to plate discipline metrics, but it goes deeper than they do. If a batter takes a nasty slider that dots the corner of the strike zone in a 0-0 count, that’s a good take. A great pitch with precise placement is not going to produce good outcomes on contact very often. In that scenario, the batter is better suited to take that pitch and fall behind in the count 0-1 rather than making weak contact for an easy out.
That scenario is a prime example of what Decision Value is measuring. It’s more than whether a hitter can recognize the strike zone. It’s whether he can correctly identify the pitches that he has a good chance of turning into favorable contact. We can also break this down further by looking at pitches both in (zDV) and out (oDV) of the strike zone.
Like many metrics, Decision Value is graded on a scale where 100 represents the league average. Every 15 points above or below 100 is one standard deviation.
With that background out of the way, in this piece, we’ll be analyzing some of the notable second-year players to see how their swing decisions have changed since their rookie season. This is our second article covering sophomore hitters. To read the first, click here.
You can support Pitcher List and get access to full leaderboards for Decision Value and other PLV statistics by joining PL Pro.
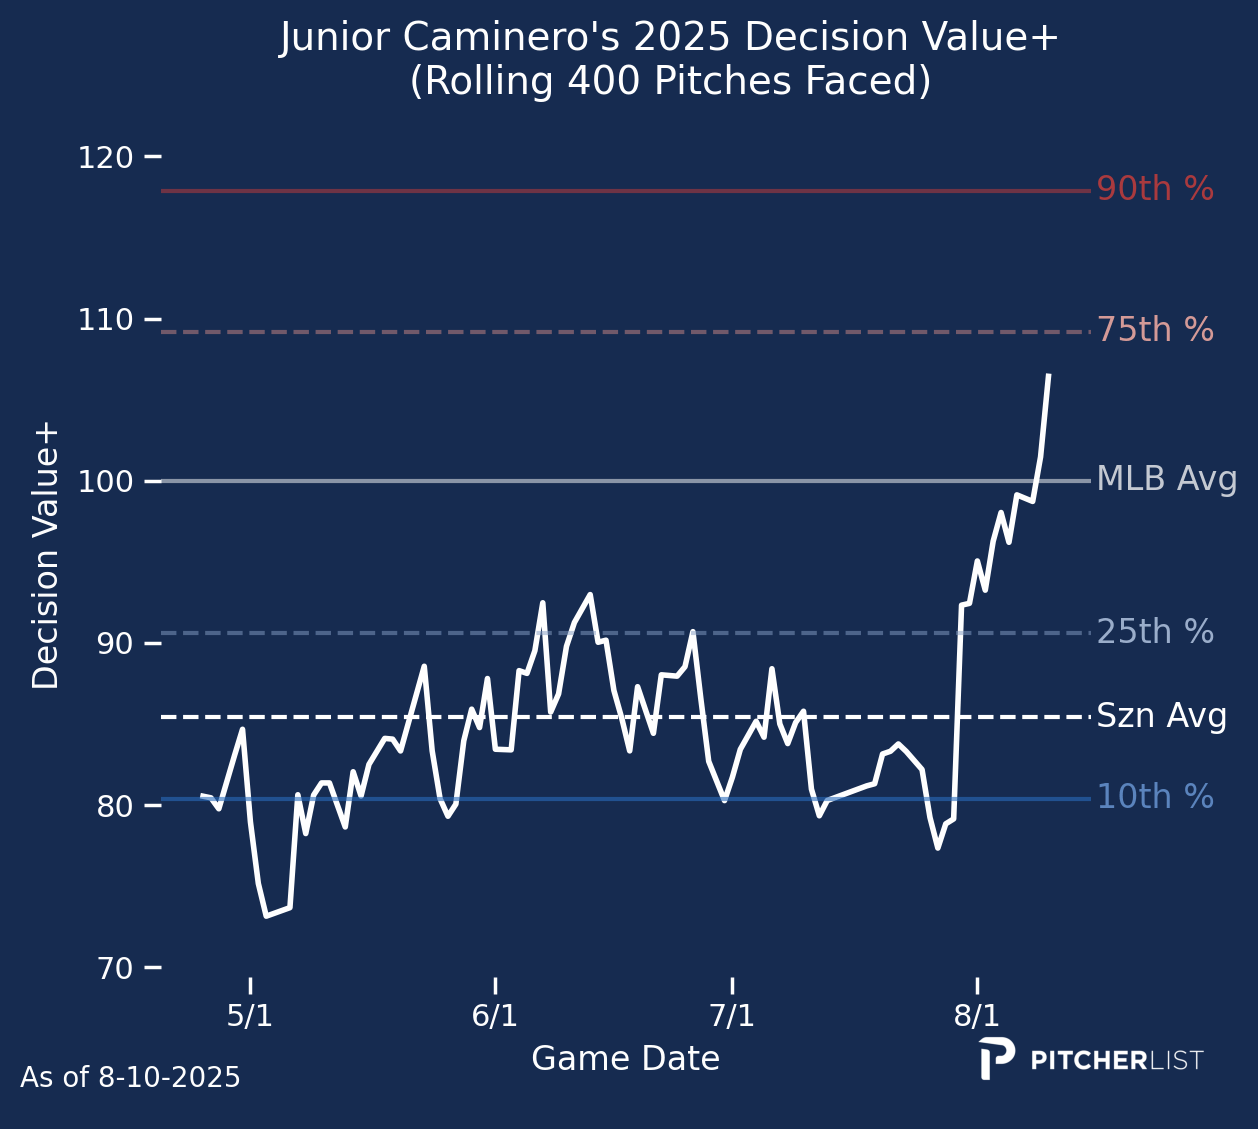
Junior Caminero — 2024: 72 Decision Value | 2025: 88 Decision Value
Although he’s still got a ways to go to get near a league-average Decision Value, Caminero has shown strong growth in his swing choices in his second season facing MLB pitching. His 16-point jump represents the biggest improvement in this article, and also tops every player covered in the first part of our sophomore series. Caminero’s been particularly good as of late.
Caminero’s already broken out at the plate — he’s hit .260/.299/.524 with 33 homers and five steals — so it’s hard to nitpick too much of what he’s doing, but we can definitely see some room for growth in his on-base skills, and a boost to his Decision Value would certainly help in that area.
Like a lot of power hitters, Caminero chases too often. He swings at pitches outside of the strike zone at a 33.8% clip, a rate that falls in just the 14th percentile of qualified hitters. It’s easy to understand why he chases, though. His 78.3 mph bat speed is the second-best mark in the bigs, topped only by Oneil Cruz (and of course Giancarlo Stanton, but he doesn’t have enough swings to qualify for leaderboards yet). With that elite swing speed, Caminero does a lot of damage on contact. Each of his xwOBA, xSLG, AVG EV, Barrel%, and Hard-Hit% fall in the 70th percentile or above. Caminero offers at a lot of pitches because he knows he can do damage to those pitches if he happens to make contact, but that results in poor chase rates, and a big downgrade in Decision Value.
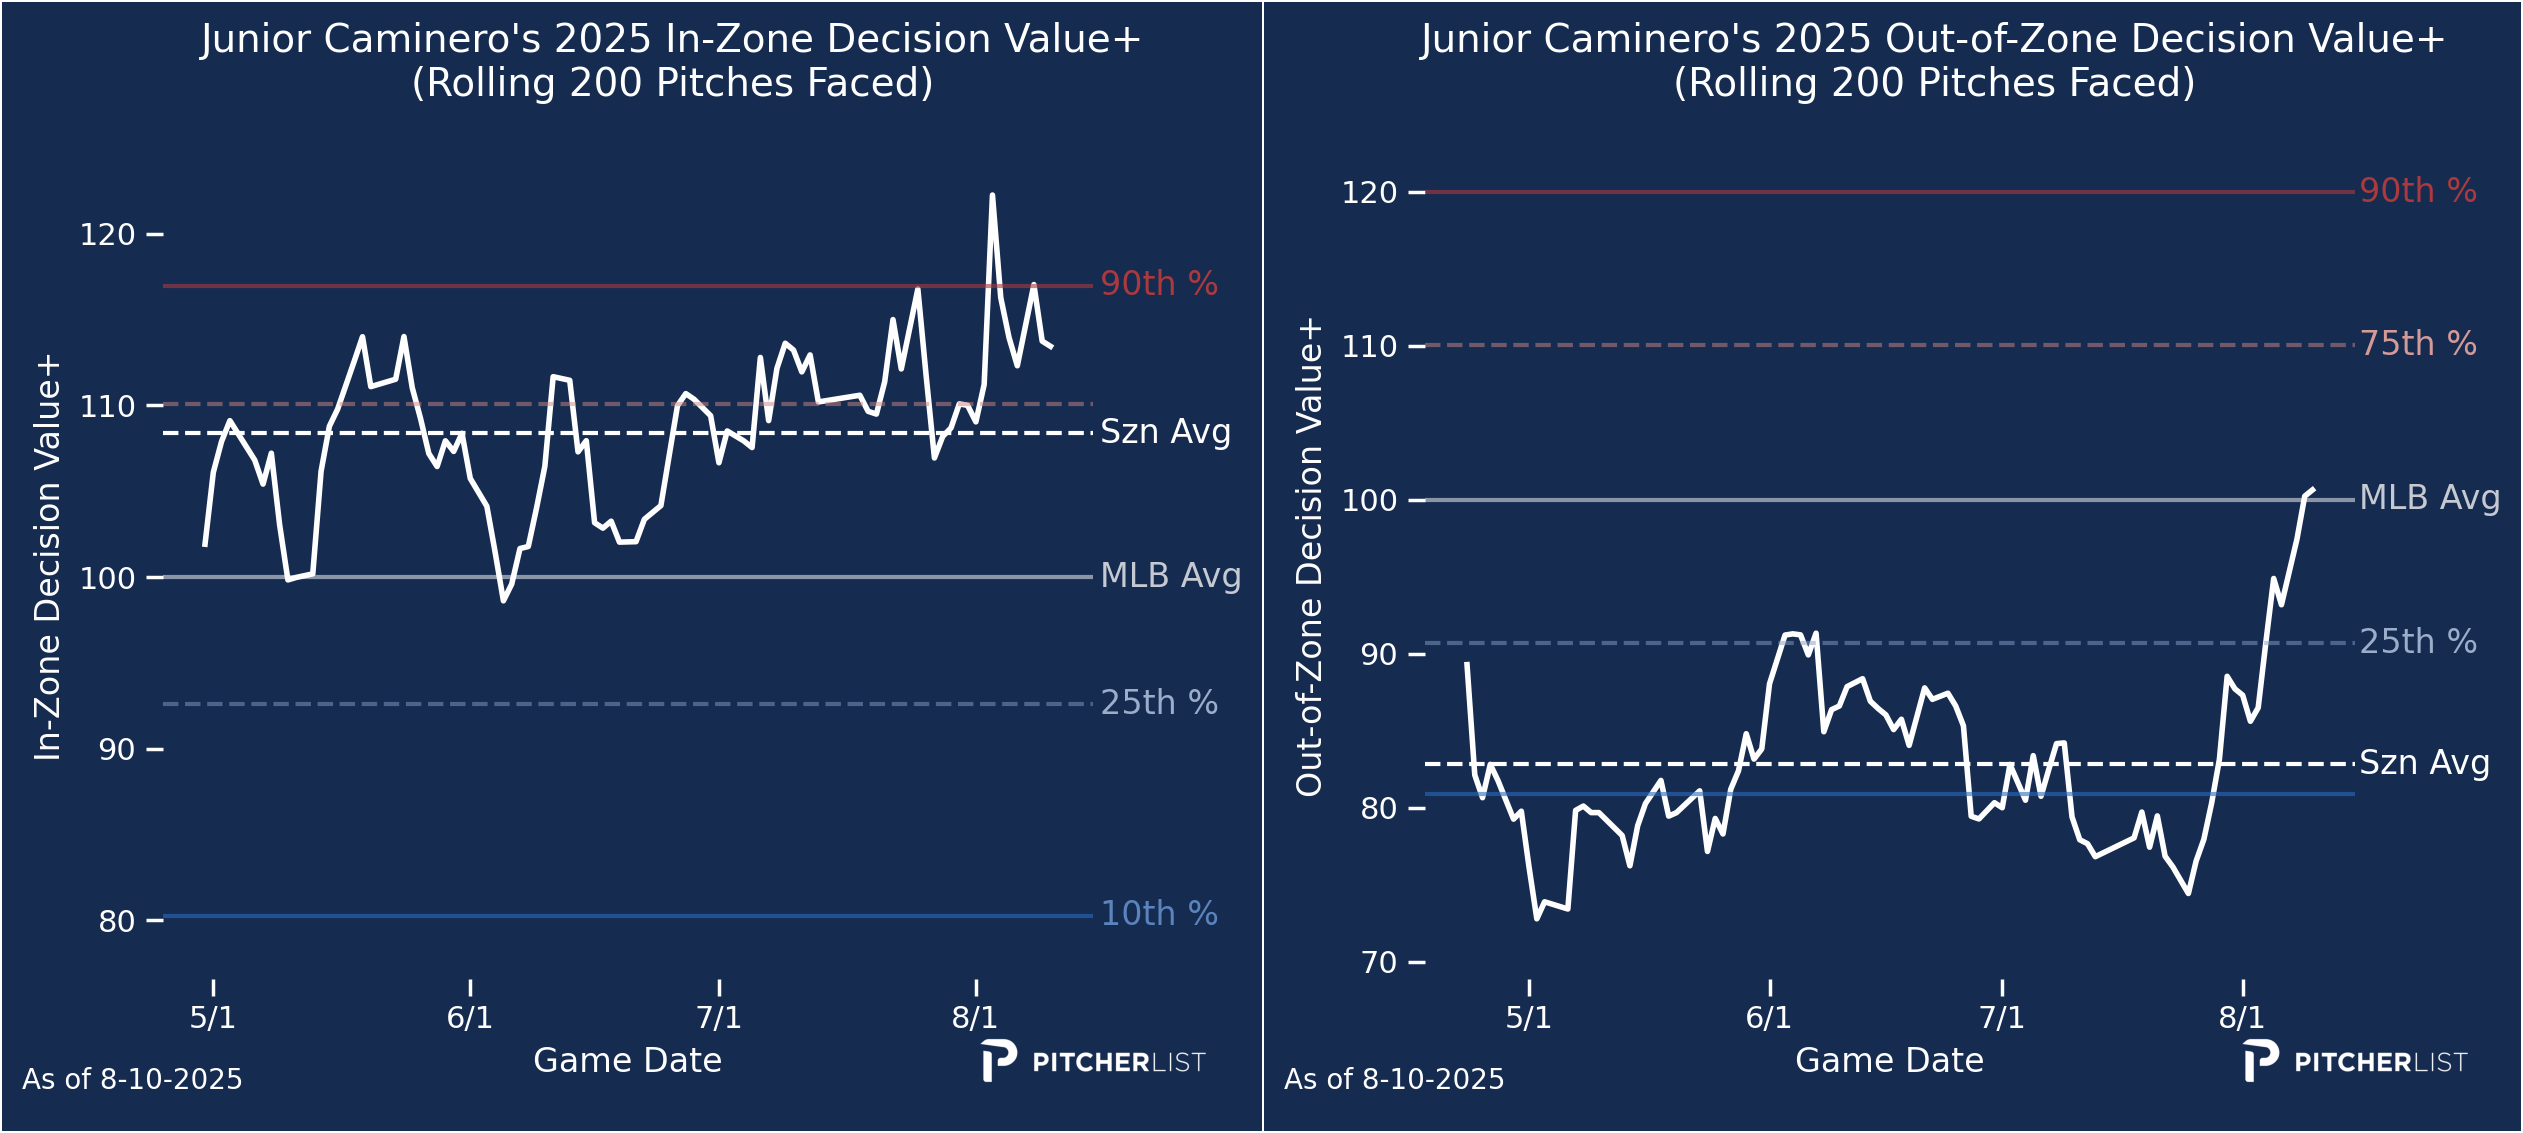
This look at his in-zone and out-of-zone Decision Value really tells the full story. He’s an aggressive swinger for good reason, but PLV can’t stand how often he offers at balls.
Caminero is already one of the most fearsome hitters in baseball as a 22-year-old sophomore. If he can make better swing decisions as he ages and cut back on those chases, the upside is staggeringly high. It wouldn’t be surprising to see a couple of MVP-type seasons from the Tampa Bay youngster.
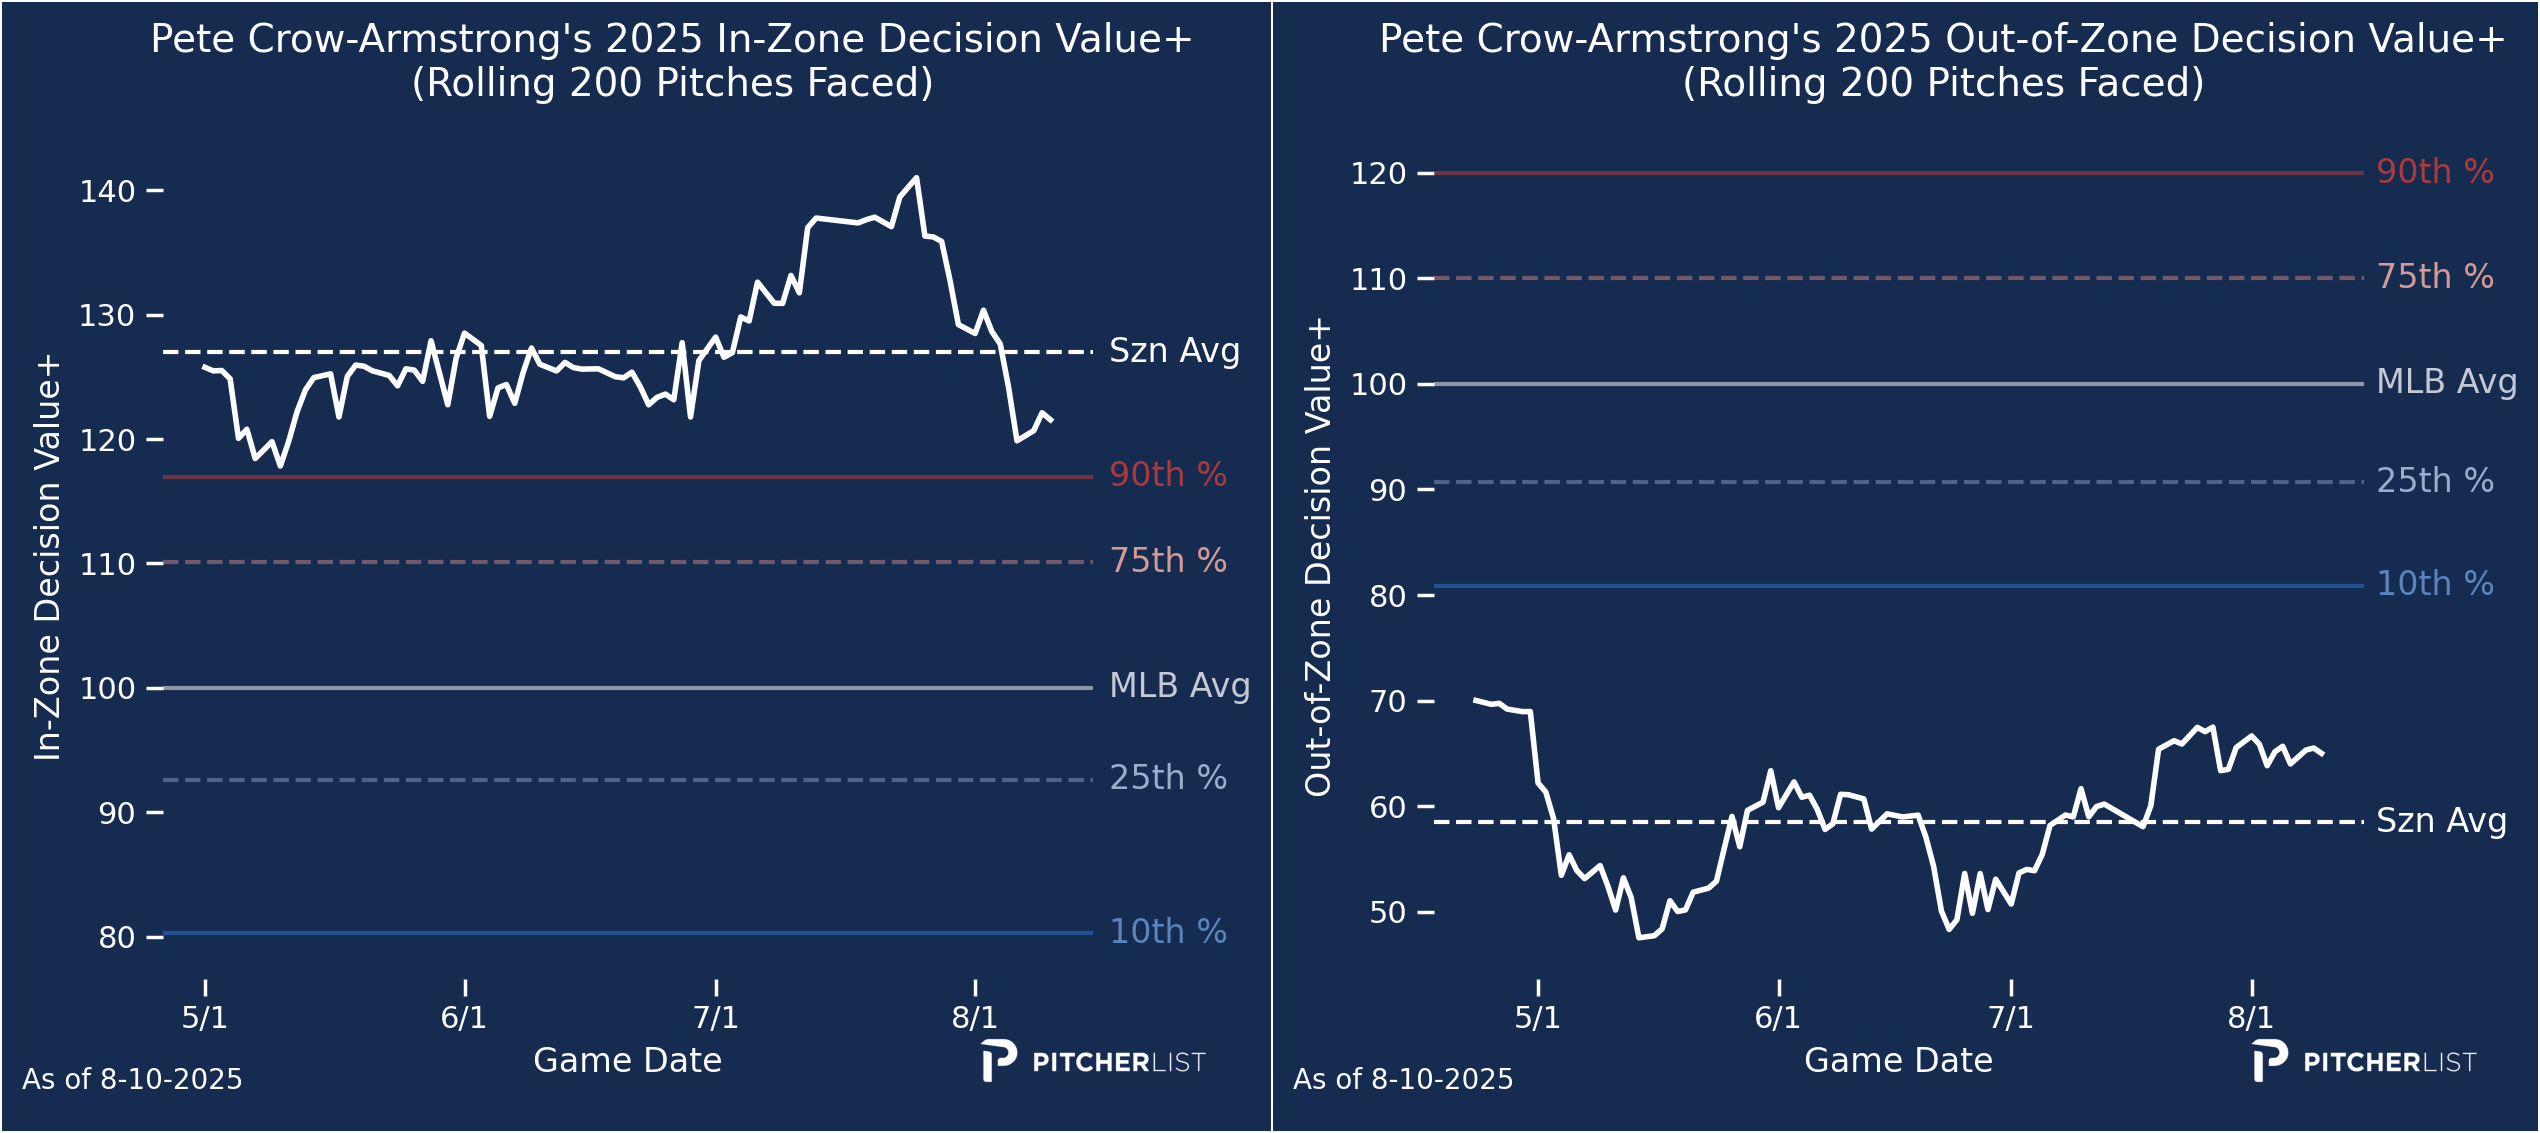
Pete Crow-Armstrong — 2024: 73 | 2025: 65
You probably didn’t need me to tell you that PCA makes bad swing decisions. If you watch a couple of his at-bats, you’ll quickly see that he’s among the most free swingers in the league. He offers at 61.1% of the pitches he sees, placing him in the 99th percentile of all hitters. Of course, it’s not just you and me that know this; opposing pitchers do too, and they attack him accordingly. Only 43% of the pitches PCA sees are located in the strike zone, but that doesn’t stop him from swinging anyway. His 46.1% O-Sw% is the worst mark in baseball.
PCA’s 65 Decision Value is the eighth-lowest among qualified hitters, and his 60 oDV is fifth-worst. With those kinds of grades, you may expect him to have a terrible zDV as well, but that’s actually not the case. With a 125 zDV, PCA ranks 12th best in baseball. It may seem contradictory to have such a bad oDV but an excellent zDV, but this is largely because PCA swings so often that he hardly ever lets a hittable strike go by him. PLV loves to see him attack those pitches in the zone, so that’s how we wind up with such a strong zDV mark.
Despite the poor Swing Decision profile, PCA has found massive success this season. He’s slashing .227/.293/.522 with 27 home runs and 30 steals. Even with his recent slump, he’s still in the thick of the National League MVP conversation.
With elite speed and baserunning prowess to match, it feels like improvements to his swing decisions could have an outsized effect on PCA’s long-term fortunes. If he can start making better swing choices and get on base more often, his already lofty stolen base totals should increase, and that’s a huge weapon that both his real-life and fantasy teams would appreciate.
Addison Barger — 2024: 80 | 2025: 88
Barger’s name didn’t appear in many preseason breakout or sleeper columns, but the second-year third baseman has become an integral part of one of the top-scoring lineups in the game. Barger’s slashing a strong .264/.314/.504 with 18 home runs and 59 RBI. Pretty solid for a player you picked up for almost nothing on your waiver wire!
Not only has Barger’s production ticked up in a big way in his second season with the Blue Jays, but he’s making better swing decisions, too. Unfortunately, he’s still well below average, but an 88 Decision Value is a lot nicer than an 80, and represents half of a standard deviation increase from his rookie campaign.
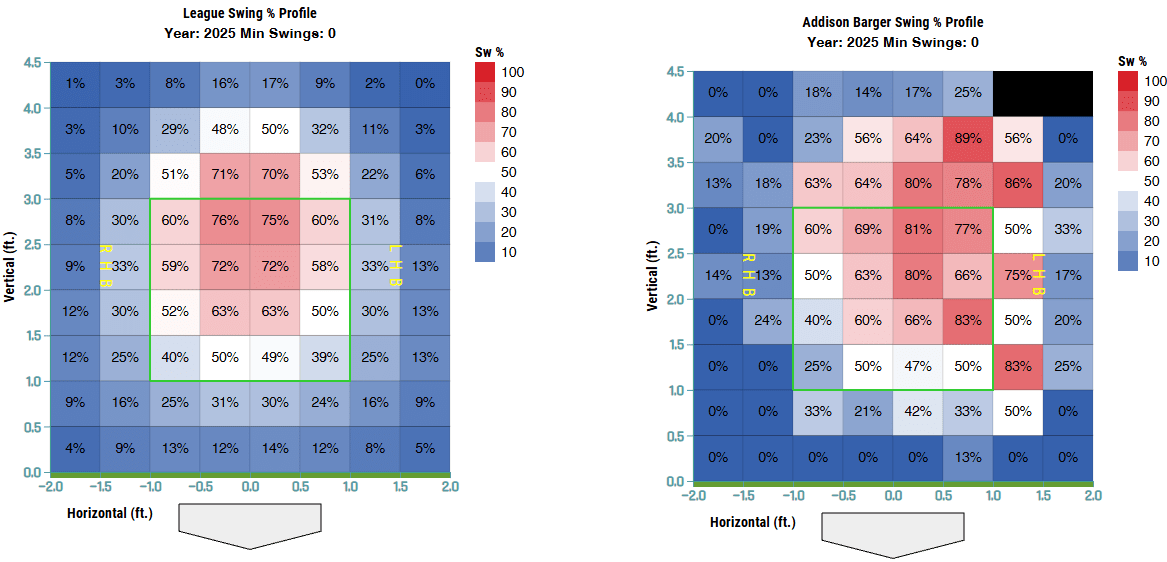
Barger’s generally an aggressive swinger — he attacks 51.1% of the pitches he sees (74th percentile) — but he’s particularly aggressive on inside pitches. Pitchers attack him inside more than the average hitter, and that’s proved to be a questionable game plan. Most of the damage Barger’s done this year has come from those inside pitches, and all but two of his home runs have been pulled. He may chase a little too much at those inside pitches, but the way he’s had success this year, I don’t think he’s looking to make too many changes.
Here’s a look at his swing profile compared to the league average hitter. Those inside swings stick out immediately, glowing a deeper red than any of the boxes in the league swing% side.
Ben Rice — 2024: 120 | 2025: 109
Don’t call it a sophomore slump. Sure, Rice has taken a step back in his swing decisions this year, but he’s still well above league-average and has otherwise enjoyed a breakout campaign. Rice is hitting .232/.327/.459 with 17 home runs. Importantly, he’s dropped his strikeout rate from 27% in his rookie season to a better-than-league-average 19.4%. On the surface, the improving strikeout rate doesn’t exactly square away with worse swing decisions, so let’s dive a little deeper to see what we can uncover.
Rice has been a patient hitter throughout his short MLB career, but he’s become more passive in his second year, dropping his swing rate almost two whole percentage points. Interestingly, though, Rice hasn’t exactly gone about this in a productive way. His overall swing rate is down, but his chase rate is actually up slightly, meaning his in-zone swing rate has dipped. Put simply, he’s letting more strikes go by this year than last year while simultaneously swinging at more pitches out of the zone. That’s why his Decision Value has dropped.
The reason he’s not striking out more often is that he’s gotten better at making contact. He’s gone from a below-average contact rate as a rookie to one in the 63rd percentile of qualified hitters as a sophomore. The actual percentile change in contact has gone 74% to 77.2% which doesn’t look like a huge jump, but it’s led to a lower swinging-strike rate and a higher ball-in-play rate. Hence, fewer strikeouts.
Despite the lower Decision Value mark in 2025, Rice has enjoyed about seven straight weeks of making some of the best swing choices in baseball.
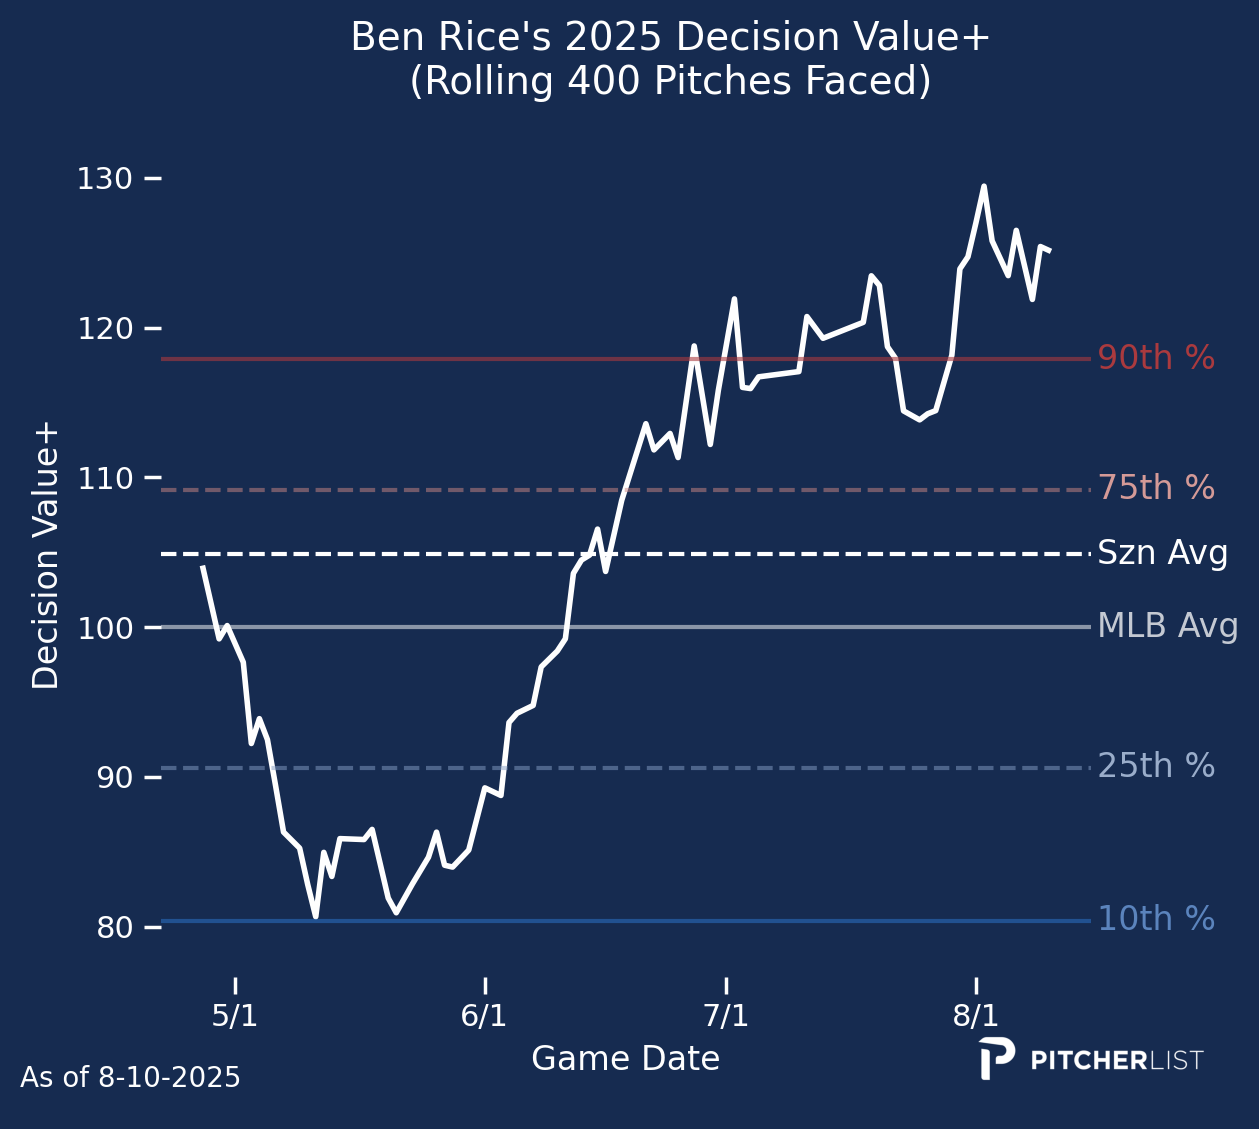
It’s a bit of cherry picking, but since June 21st, when that Decision Value trend line neared the 90th percentile, Rice has a 129 wRC+. Before June 21st, he posted a 113 wRC+.
Hunter Goodman — 2024: 76 | 2025: 79
Goodman hasn’t made many changes to his Decision Value in his sophomore campaign, but I doubt he cares about that when he was selected to the National League All-Star squad for the first time. Sure, the Rockies had to have somebody in the game, but by catcher standards, Goodman’s .275/.322/.519 slash line with 23 home runs and 66 RBI is rather solid.
Under the hood, Goodman’s plate discipline skills leave a lot to be desired, but he has shown improvements in both his strikeout and walk rates from his rookie season, moving the prior from 28.6% to 26.5% and the latter from 3.6% to 5.9%. Like some others above him in this article, Goodman is an aggressive batter. He swings at 55.4% of the pitches he sees (94th percentile), and that leads to a conflicting Decision Value profile. His 110 zDV is good since he swings at so many strikes, but his 77 oDV is remarkably poor because he doesn’t cut those swings when pitches are located out of the zone.
Like those slight improvements we saw in his standard plate discipline metrics, Goodman has also marginally chased fewer pitches. He cut his chase rate four percentage points down to 35.9%, and while that’s a clip that still falls in the very poor 9th percentile, it is a step in the right direction and something that Goodman can hang his hat on as he looks to build on his All-Star sophomore season.
Adapted by Kurt Wasemiller (@kurt_player02 on Instagram & Threads, @kuwasemiller.bksy.social on BlueSky)
