


So, you’re on top of a leaderboard at the end of April.
Leading the league in batting average, home runs, or wRC+ is often a sign of an exciting year ahead. Whether you’re an established star who’s back to their old ways or someone who’s having a breakout April, it’s never a bad thing to have an exceptional start to the year.
As the baseball community is still waiting for most players to provide a legitimate sample size, everyone is scrambling to determine what the early April performances mean. Sure, we can comfortably assume that Mark Canha isn’t continuing his 67% better-than-league-average pace, and Mookie Betts will remain at the top of these leaderboards for the rest of the year. However, a lot of data, even if not a legitimate sample size, can be useful in evaluating the league atmosphere for 2024.
However, baseball’s unpredictableness is sometimes cruel and unfair. Remember Matt Chapman’s start to 2023? After a 216 wRC+ in April and the peripherals indicating a skills change, he’d go on to produce a meager 84 wRC+ the rest of the way.
Caution aside, being successful early in the year largely indicates a good year to come, at least from a law of large numbers perspective. Looking at the top 30 April hitters by wRC+ from 2018-2023 (excluding 2020), I compared their rest of season (ROS) wRC+ to their career wRC+. A torrid April often does mean the rest of the year will be better than a player’s career-average year.
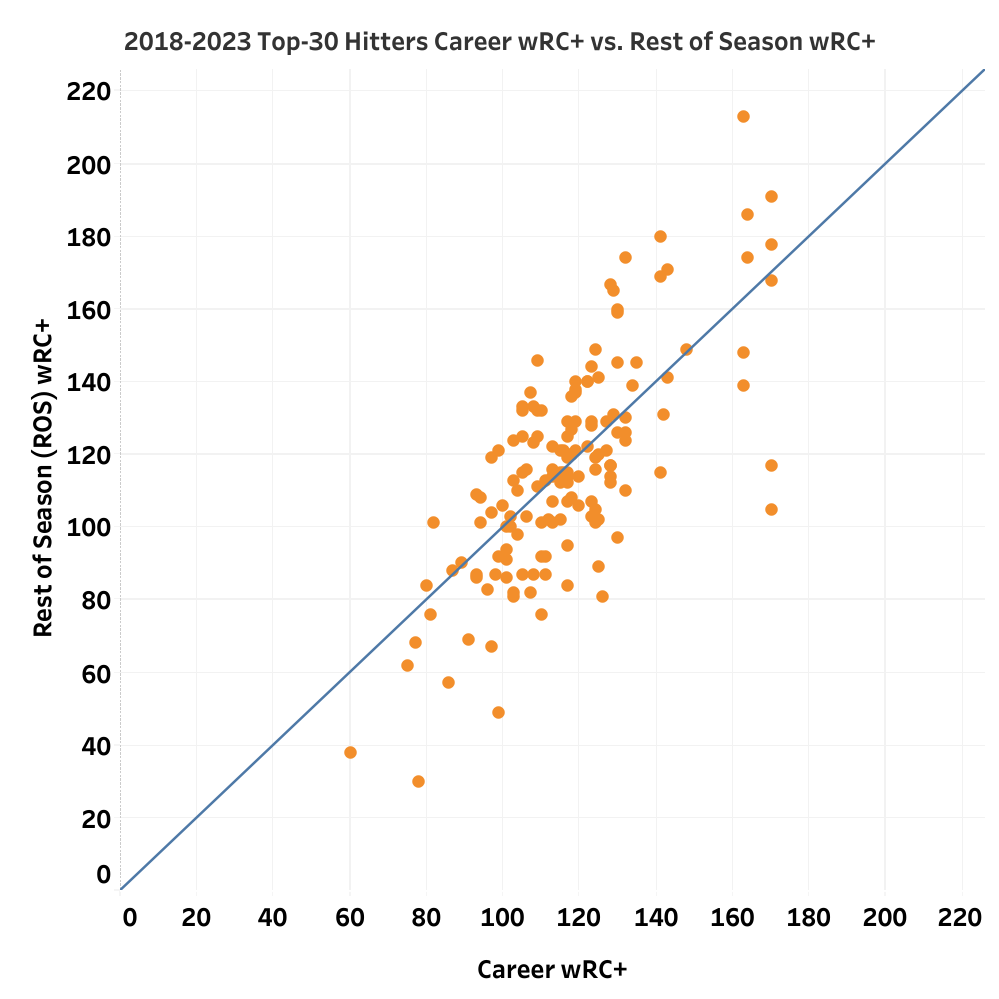
Of the 125-player sample, 57% had a better-than-career-average year, and 86% of those players had a wRC+ above 110. It’s more useful to tell if a player was better than their career norm outside of a hot start to the season rather than keeping up an absurd early pace. Of the 125 player/season sample, only seven top-30 hitters outperformed their April over the rest of the season: 2018 Mike Trout, 2018 J.D. Martinez, 2019 Mike Trout, 2019 Nelson Cruz, 2022 Aaron Judge, 2022 Yordan Alvarez, and 2023 Ronald Acuña Jr.
After splitting the sample into those who had better and worse than career average years the rest of the season, here are their April metrics.
Players who performed better ROS than their career average were slightly better overall, but most stats are very close and generally line up as “all of these players had good Aprils.” The main thing that stands out is that the worse ROS performers had a higher walk rate in their hot Aprils. One hypothesis is players getting fewer pitches in the zone could inflate their performance without an actual skills change. Once the weather warms up and pitchers are more comfortable, these hitters can’t do as much with strikes.
Comparing their April performances to career numbers, the worse performers show that their April is slightly more of a fluke.
Everything is somewhat similar to the previous chart, but the better ROS performer’s hard-hit rate stands out. These players have a substantial improvement in their hard-hit rate over the worse ROS performers. More hard contact is obviously a good thing, but it’s eye-catching to make the change in a month when offense is generally down.
2024 Hard-Hit Rate Changes
I’ve talked a lot about large data points, but we’re still in April, and simply saying “most of these April breakouts will stick” is utterly useless if you don’t know who.
Here are the biggest improvers in hard-hit rate while being in the range of a top-30 hitter. Since the bottom floor for top-30 hitters in previous years is around 140 wRC+, everyone included in this section will have a 130 or greater wRC+ (giving a buffer as we don’t fully know the league scoring environment yet).
This list returns many solid everyday players looking to take the next step. Generally, these are younger players who are still adjusting to the league, such as Bobby Witt Jr., Spencer Steer, or Jordan Westburg. There’s also Shohei Ohtani because why wouldn’t he be here?
Conversely, here are the fallers in hard-hit rate (min. 130 wRC+):
This raises worrying signs for older hitters, such as Pete Alonso, Freddie Freeman, and Mike Trout. However, Mike Trout may be okay since his career hard-hit numbers are uber-inflated from his early career ability. Seeing Michael Busch on this list makes me question how legitimate his five-game home run streak was. He had a higher hard-hit rate during his 81 plate appearance, 49 wRC+ spell with the Dodgers last year.
It’s easy to dream on many of these players at the top of the leaderboard, but not all will stick. By finding who’s improving their consistent hard contact, it’s easier to identify who may stay at the top of the leaderboards come October.
