


I like starting these articles with a visual aid, so here’s a big one. This is every hitting season from 2021 through 2025 for players with at least 300 plate appearances:
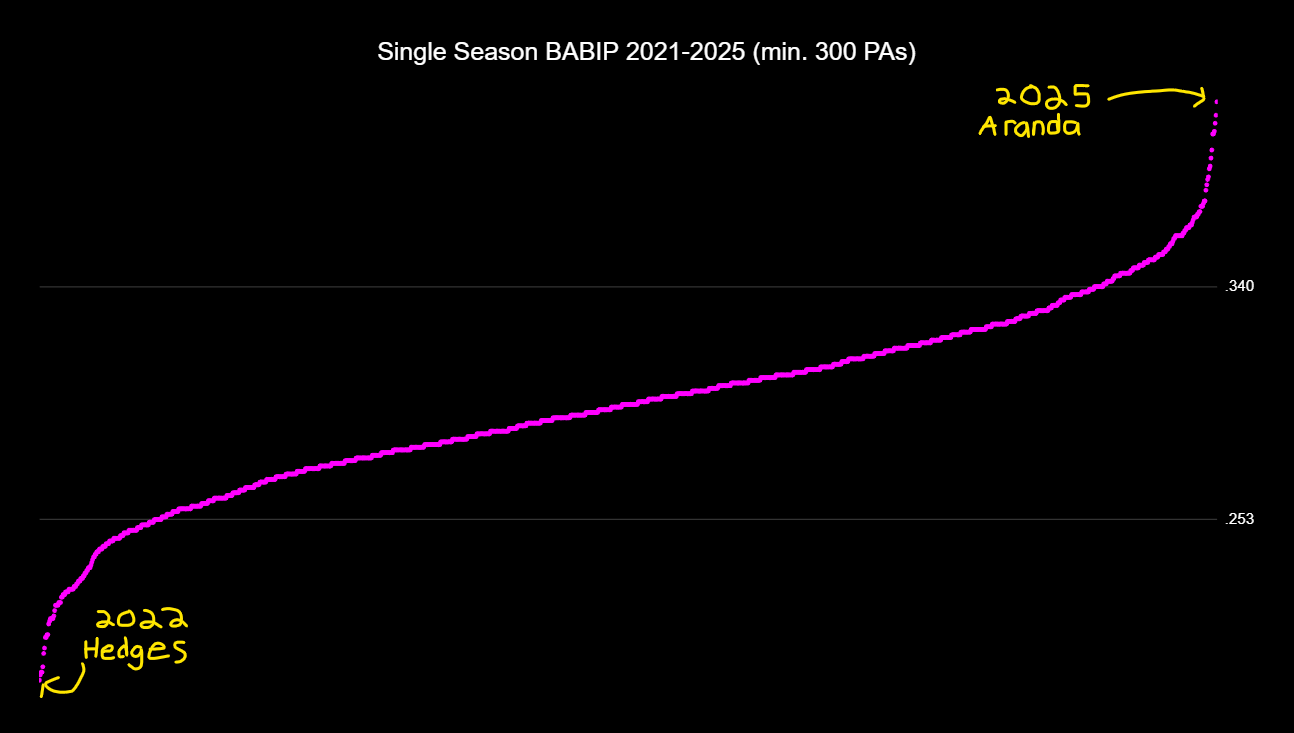
If the Y-axis here seems strange, that’s because it represents the 10th and 90th percentiles of BABIP. Anything above or below these lines is in the realm where we, as baseball followers, should be heavily skeptical about possible regression.
Or not!
Austin Hedges has a career BABIP of .226 due to his batted ball distribution and general lack of pop. This would fall well into our realm of BABIP skepticism, but an astute baseball follower would know that Hedges doesn’t make the kind of contact conducive to a high BABIP. In fact, here’s the BABIP breakdown of Austin Hedges‘ entire career:
It’s awful! His career BABIP is .227. This is because Austin Hedges does almost none of the things that are good for BABIP. Jonathan Aranda, on the other hand, does a lot of things that contribute to a high BABIP. Part 1 and Part 2 looked at pitchers and everything that went into BABIP. Parts 3 (that’s this one!) and 4 will look at the other side of the ball, and everything that goes into a hitter’s BABIP. So let’s start with the (should be) obvious:
Smoke ‘Em If You Got ‘Em (?)
So, you probably already knew this.
It is now decades-old wisdom that hitting the ball harder is more conducive to getting a base hit, although the dramatic difference in results between double and triple-digit exit velos is still fairly shocking. If you want a shorthand answer as to why so many orgs and analysts are obsessed with bat speed and exit velocity, while seemingly being uninterested in old-fashioned contact guys, here ya go. This is sort of the baseball version of the 3-point revolution happening in basketball: A player who has two batted balls at 100 mph has a higher likelihood of getting a hit than a player who has four batted balls at 90.
Or at least I thought that was what was happening here.
So.
Clearly, we have to dig deeper.
Let’s isolate that 100-104 mph mark so we are sure we are minimizing noise, and compare BABIPs on launch angle instead:
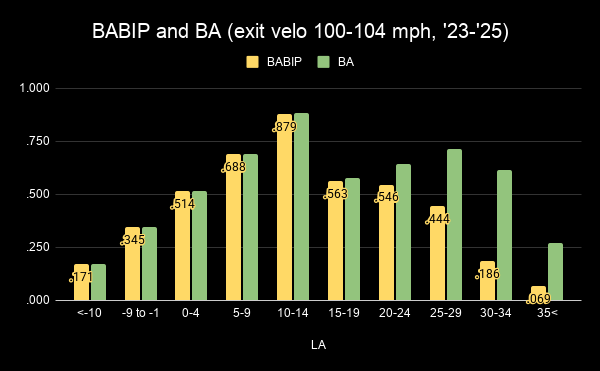
Again, probably something you already know, but I still find it valuable to visualize and properly demonstrate even fairly obvious observations. The reason for doing so is a) it looks nice, look at my lovely graph, and b) because it lets me segue into more interesting things, like this:
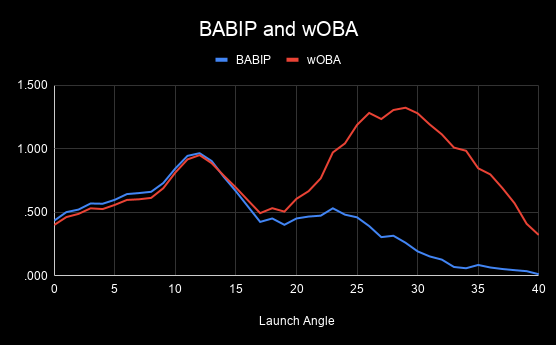
This graph illustrates why I find BABIP so particularly fascinating: its correlation with good hitting is… mixed. Sure, high BABIP means more hits, which means more runs, as we went over in part one (although you probably didn’t need a whole article to read it – still should, though). However, when discussing hitters, BABIP has many other factors that create variance. Let’s bring back this graph on ballparks.
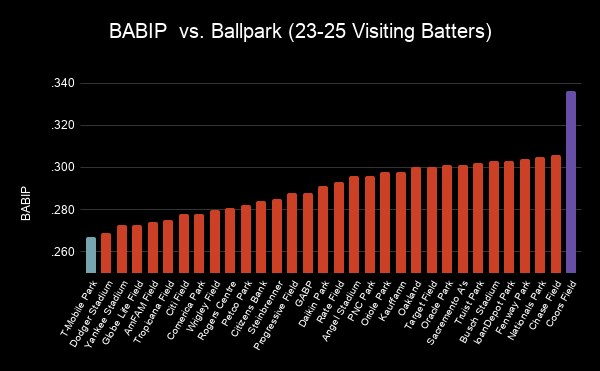
Hi again, Coors.
So BABIP is weird. We know this. What can we use to find out what actually matters?
The Theory of Everything
If exit velo doesn’t appear to matter, and launch angle only sorta matters, what does the best job of analyzing BABIP? Is it speed? slapping it to the opposite field? Hitting it in the sweet spot? I’ve heard all of these explanations, and I’m sure you have too. So, I loaded up every qualified hitter in 2025 and cross-referenced their BABIPs with pretty much every stat I could think of that might have something to do with BABIP.
Here are my results:
There is so much to get through here, so let’s start at the bottom and work our way up. Yes, I’m shamelessly delaying my key finding for a big finale, but I think what doesn’t matter is very interesting as well.
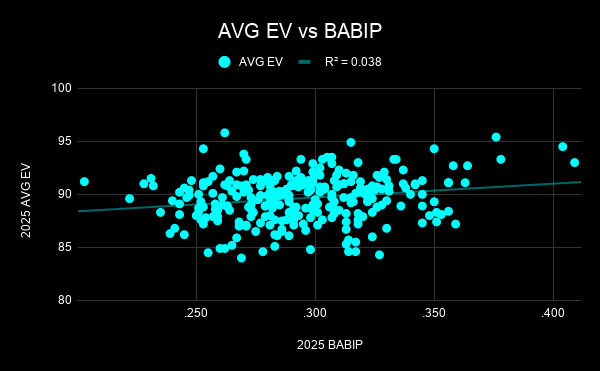
Let’s start with all the power stuff: Barrel%, Bat Speed, Blast%, Weak%, EV, and Squared Up%. Despite the talk earlier about the importance of high exit velos, no batter can reliably produce triple-digit exit velocity at a rate that matters for BABIP purposes. Barrel%, despite its tremendous emphasis in the modern game, is useless for our purposes, as is bat speed. On a micro level, a ball hit harder has a higher chance of landing for a hit, but on a macro scale, we must look elsewhere to properly assess BABIP.
Moving up the list, we find two related and commonly cited hypotheses for a high/low BABIP: sprint speed and home-to-first splits. The logic appears sound—beating out ground balls is hard, and so if you’re faster, you should get more hits as a result—yet this appears to only barely be the case. In fact, because the home to first split is lower—which would in theory be more relevant for our purposes—I’m willing to almost outright discard this entirely. Maybe speed plays a factor in some players’ games, but by and large, it appears to be a non-factor.
Next up, we get a bit more legs to stand on with some directional qualities. Opposite field and poor contact rates have a moderate degree of correlation. Moving up the list, we have GB%, FB%, LD%, as well as Pull% and Ideal Attack Angle. The more ground balls and line drives, the higher the BABIP, while fly balls are often hit for homers, which, of course, aren’t counted in BABIP. These explain why launch angle has such a high relative r^2. A lower average launch angle means they have a higher combination of ground balls and line drives as opposed to fly balls.
Oh, and yes, you saw that correctly – last year’s BABIP has a .093 r^2. Look, I can prove it
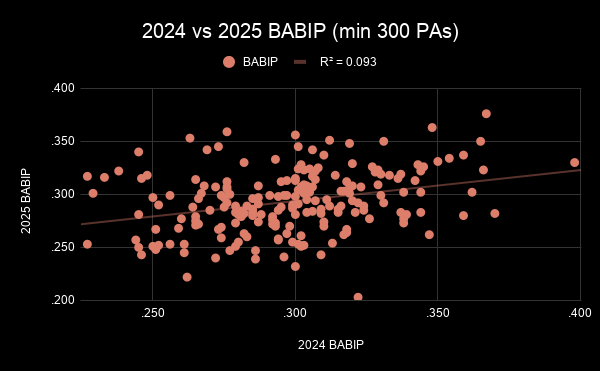
Admittedly, this isn’t adjusted for ballparks and other adjustments, but admittedly, I don’t really care.
Lastly, Flare and Burner%. Flares and Burners actually have the highest BABIP of any main batted ball type, at .664. This is very useful, but the difference between the top F&B guys like Freddie Freeman and Eugenio Suárez at the bottom of the list isn’t very large. Flare and Burner rates are probably the best stats to determine how a player’s batted ball profile fits their BABIP. It doesn’t really matter how hard you hit it; if there are a lot of flares and burners, success in finding the grass should come.
Okay. We’ve gone through the list. You wanna know what matters the most? It’s a fun one.
Under The Radar
Watch this play.
Boring, right?
This is a ball hit at 95 mph with a 45-degree launch angle. This is technically a hard hit ball, but only twice since 2015 has a batted ball with this combination of exit velo and launch angle landed for a hit. One was a 2017 home run that carried to the very corner of PNC Park, and the other, I kid you not, was this all-timer. This was somehow scored a hit, which brings the total to 2-43 over the last decade of baseball. This is a poorly hit fly ball, which we classify as getting under.
The true definition of statcast under% is a bit convoluted. The exact formula varies year to year, but this post from 2017 gives the gist. The formula is: Exit Velocity + 2 (Launch Angle) ≥ 116, with a few additional qualifiers, such as the launch angle needing to be at least 21 degrees, and not overlap with barrels, flares/burners, or poorly hit balls. You may be familiar with this statcast batted ball chart:
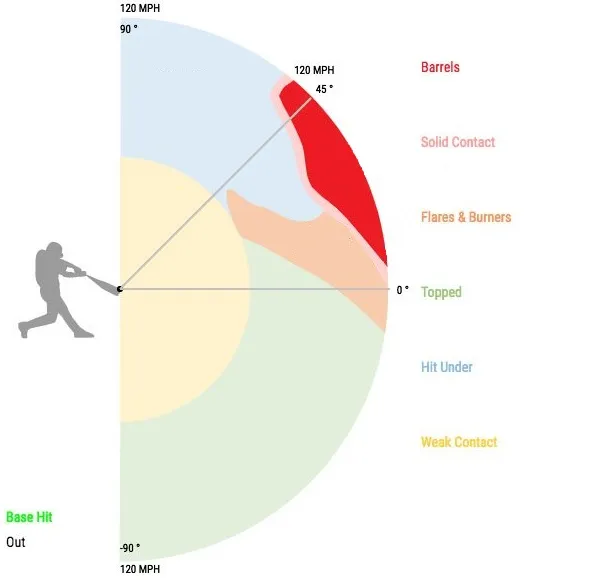 We care about the blue bit. As you can see, there’s a bit of overlap at certain launch angles, so here’s a table to help establish the parameters:
Everything below 60 mph is classified separately under ‘weak,’ and above 52 degrees everything above 60 mph is a guaranteed under. Here’s the BABIP for each of these:
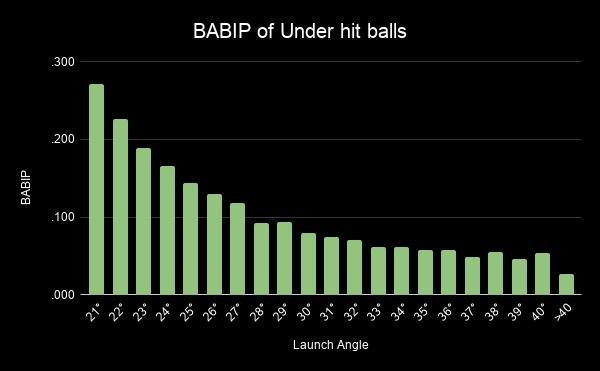
Yeah, I could have logged 41-52 or 41-90, but you get the idea. 21 and 22 degree Under hit balls happen so rarely that even their comparatively high BABIPs don’t skew the results.
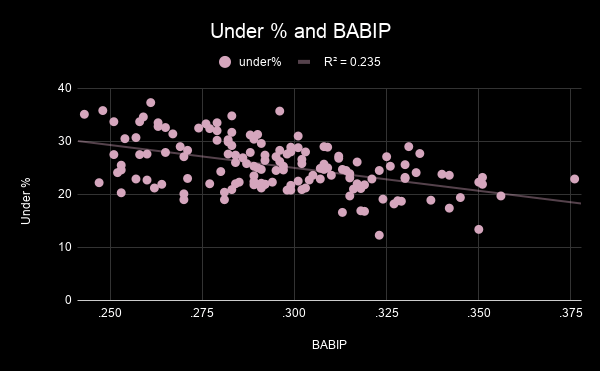
A batted ball in the under range has a BABIP of .057, going back to 2015. These batted balls suck. They are the type of batted ball that is only really useful if you’re totally pulling it down the line or hitting it for sac fly purposes – which wouldn’t count in BABIP anyway. Because of how terrible this result is, it stands to reason that the ability for a batter to avoid the can of corn fly ball is paramount for delivering on high BABIPs. Here’s every qualified hitter in baseball, looking at their under% and BABIP in 2025:
And if you want further proof, here is every batter with at least 300 PAs in a season since 2022:
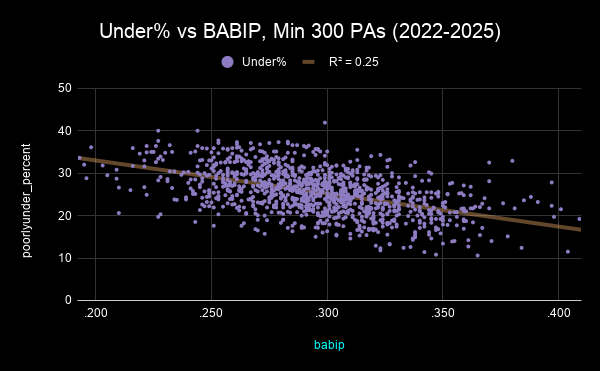
That’s a .25 r^2 exactly. Now, while this is all well and good, as we established earlier, BABIP is a weird stat that only barely matters from year to year. Despite the commonly cited “career norms” point, it doesn’t have all that much to do with a player’s BABIP the following year. So let’s look at how sticky under% is:
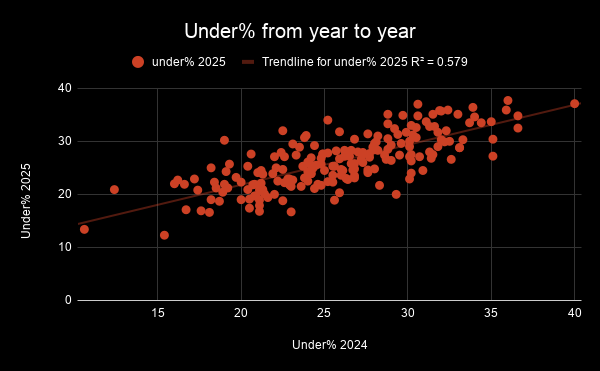
Oh goodness, an r^2 over .500, how lovely. Yep, it holds pretty dang well. This is actually fantastic news because Line Drive rate is notoriously not sticky, and of course, BABIP isn’t. The next step, then, is to combine the stickiness of Under% with year-to-year BABIP. In other words, among players with 300 PAs in both 2024 and 2025, what was the correlation between their 2024 Under% and their 2025 BABIP?
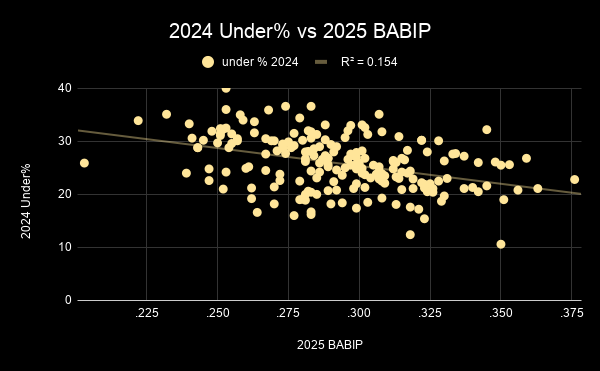
BANG
oh
What’s that? .154 isn’t a lot?
Okay, okay, let’s put this into perspective. To get a sense of how wacky BABIP is, here are a couple of OTHER correlations between stats and BABIP
Once again, Under% significantly outperforms other metrics, and although it only slips by Launch Angle, it makes more sense to use Under% as a measure of BABIP. It’s a more demonstrable ability of being able to avoid the worst kind of contact, and used in this way, it is effectively a more precise tool than strictly launch angle.
So, in conclusion, Under% is the best way to analyze a hitter’s BABIP, and by isolating only the worst contact types, you will get the best picture of how sustainable a player’s BABIP is.
No Longer Under Wraps
At the start of this article, I compared 2022 Austin Hedges to 2025 Jonathan Aranda. What was the difference between these two?
So there you have it. That’s the key to understanding hitter BABIP.
For my fourth and final installment of this series, we will look at a handful of hitters, and using what we’ve discovered, we will analyze whether players’ BABIPs are truly representative of their performance, or if there’s some weird noise happening.
For those interested in how BABIP effects pitcthers, here is Understanding BABIP Part 1 and Understanding BABIP Part 2
