


Throughout the entirety of the exhaustive research process in part 3, there was one question that was running through my mind:
Why did Aaron Judge have a .364 BABIP last year, and a career .349 BABIP?
The answer that seemed the most plausible was that Judge hits the ball crazy hard, but as we established in part 3, exit velocity and barrel rate have next to nothing to do with BABIP. I’m hesitant to completely write off Judge’s prodigious ability to generate almost exclusively hard contact as a factor to his high BABIP, but my research has shown that there simply MUST be more to the story. Most of the answer comes in the form of Under%.
There are going to be a lot of numbers here, so stay with me. There have been 538 players from 2017-2025 to have recorded at least 1,000 PAs. Aaron Judge ranks 7th out of 538 players in BABIP, notably with thousands more PAs. For players with at least 750 batted balls since 2017, Judge ranks 63rd in under%. Furthermore, when Judge gets under a ball, it hurts him considerably less than other batters. Judge’s career BABIP on balls he gets under is .096—which is bad—but is also 38 points higher than the .058 league-wide BABIP on Under hit balls. However, it wasn’t always like this. Look at this year-by-year breakdown of BABIP on Under hit balls:
This doesn’t make much sense!
Same batted ball type, exit velo and launch angle, there isn’t anything in the data that points to anything changing. I actually ran a Statcast search to look through every season since 2015 where a batter had at least 20 Under hit balls, and last year Judge had the 183rd highest BABIP on Under hit balls out of 4535 players. His 2022 season? 57th. It took me a while to figure it out, but once I started looking at the balls that landed for hits, it became more clear. See if you can find what caught my attention:
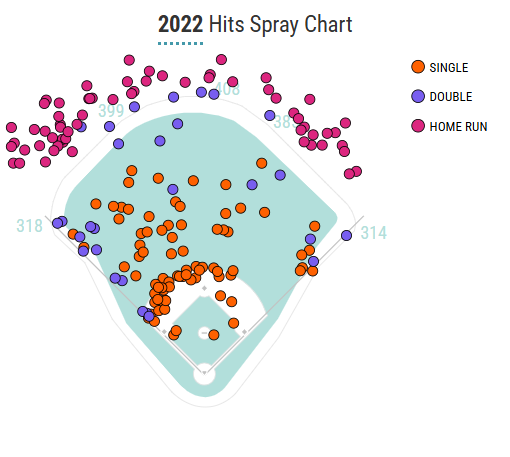
These inside, jam shot pitches that Judge muscles down the right field line? Yeah, he started doing this a lot around 2021, and in general, has been hitting it down the line at much higher rates. Just look at the hit plots from 2017 to 2022, and pay attention to the foul lines:
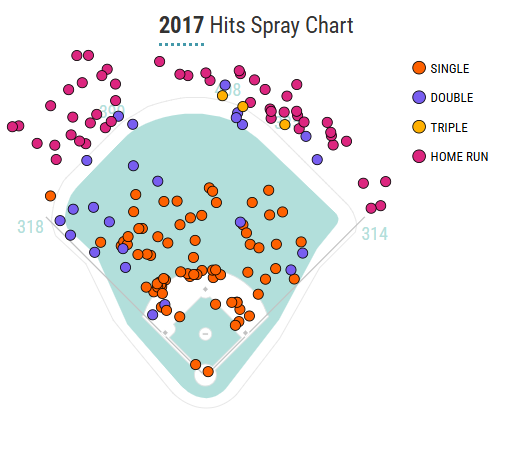
Source: Baseball Savant
Source: Baseball Savant
There are notable clusters around the right and left field lines in the outfield, which we don’t really have metrics for, but is visibly apparent enough to conclude that it’s the culprit for the increased BABIP on these weak flyballs. So, to summarize: Judge rarely has Under hit balls, and when he does, he gets the most out of them.
This gets to the other element that makes Judge so BABIP friendly: his spray angles. Judge has changed his approach a bit throughout his career, but the most recent iterations of Judge have not been the super pull happy hitter we saw in 2022. In fact, relative to many other sluggers, Judge sprays the ball around a lot. I could keep talking about Judge, but this is a good time to bring in the second player who was in the back of my mind writing part 3:
The AL MVP runner up had a season that seems Judgian, but in actuality was quite far off from even Judge’s 62 homer season in 2022. Raleigh had a BABIP of .248, contrasted with Judge’s .376, it was clear that there needed to be more than barrel% and exit velocity. Whatever answers I found would have to show why Judge led MLB in BABIP, while the MVP runner up, who was 4th in WRC+, was 3rd to last.
When I found out about the correlation between Under% and BABIP, Raleigh and Judge were the first two players I looked at. When I saw where they were, I jumped out of my chair:
It’s not a perfect fit, of course, but this clearly established the core differences between these two hitters, and why the BABIP difference was so extreme.
To figure out the rest of the equation though, we will have to go a bit deeper. Under%, as helpful as it is, only tells us a fraction of the story. A very helpful fraction, but more work needs to be done. After all, Judge isn’t last in Under%, so it isn’t 1:1.
Let’s circle back to spray angle. We love pull hitters, don’t we folks? Pulling the ball has the highest wOBA, and thus we want our batters to pull it if they can. Pulled flyballs, from a damage perspective, are the most lethal of batted ball types, but are antithetical to a high BABIP. Home runs, remember, are not in play and are thus not counted in BABIP, so a pulled flyball, despite a .882 wOBA last year, had just a .152 BABIP. Once again, here’s a table for you, this time looking at Pull%:
I swear those ranks are correct and I didn’t forget to change it. Cal Raleigh pulled the ball as much as he could, while Judge relaxed his pull-happiness to spray toward all fields a bit more. Pull percentage’s inverse relationship with BABIP means that Raleigh – whose entire swing is designed to send nukes down the foul lines – had his BABIP hampered by this development.
It’s important to remember, both Judge and Raleigh crunch the ball, with top five barrel rates. Judge had Raleigh comfortably beat in average exit velocity, but it reiterates the point I made before that exit velocity has next to nothing to do with BABIP.
The king of BABIP, Yelich may not seem like an obvious pick, but he’s the poster child for hitting line drives to all fields. Yelich is a strange hitter in many ways: he has never crunched the ball from an exit velocity standpoint, nor has he been a pulled flyball kind of player:
Despite this, however, he has a career .179 ISO, .204 since coming to Milwaukee in 2018. Yelich isn’t a crazy power hitter, but he has the same ISO as Vladimir Guerrero Jr. since 2018. Look at these rankings. Yelich’s swing tilts heavily toward right field, and has a launch angle just a tick over even. That 1.9 degree mark is the lowest of Yelich’s career, but his career average launch angle is 4.1 degrees. For perspective, Juan Soto – who has had a penchant for ground outs – has only ever had an average launch angle as low as 5.8, back in 2021 with the Nationals.
Yelich hits a lot of line drives and groundballs and does so to all fields. He doesn’t hit flyballs and certainly not pulled flyballs. He also has a very good ability to rarely get popped up, which is not something that all low launch angle guys have, although there’s a strong correlation. As such, Yelich is able to find holes in the infield and get the ball to the outfield grass. That Under% is astonishing.
Yelich has consistently been near the top of BABIP lists, and that’s because he gets under the ball at some of the lowest rates in baseball. Yelich holds four of the top five lowest Under% seasons since 2015. If anything, Yelich having a .323 BABIP with a 12.3 under% last year might be too low.
Now, we head back to where we started in the last article, with Jonathan Aranda’s .409 BABIP in 2025. It’s the highest single season mark since 2016. Surely THIS isn’t a sustainable result of their plate approach???
Uh, yeah, it isn’t.
Aranda does a lot of things we like for BABIP. He doesn’t get under the ball often, he sprays to fields a good bit, but he doesn’t do this at a rate that suggests he’s anywhere near a .400 BABIP. Take a look at these ranks, and compare them to Yelich from earlier:
The ranks are different because Aranda was not a qualified hitter last year. Compared to Yelich – the ideal of BABIP generation – Aranda does things well, but nowhere near the level we would expect for Aranda. Looking at the data here, I would expect Aranda to be solidly above average in BABIP based on how rarely he gets under the ball, but I think his BABIP level would sit around .325 or so. Last year, Yelich, with a league leading 12.3 Under %, had a BABIP 86 points lower than Aranda, who had an Under % of 19.2. All of my findings point to Yelich being a slight underperformance in BABIP, if anything, and Aranda being a major regression candidate.
For 3/4 hitters mentioned in this article, their BABIPs make sense, and assuming regression is ill-advised. For Aranda, however, it is all but a certainty.
Wrap Up…
By this point, I’ve written close to 6500 words on BABIP across these four articles. This was a great undertaking, and have been some of my most research intensive articles to date. This is the last of the Understanding BABIP series, so if you’ve read them all, thank you! I hope I could shed some insight onto one of baseball’s most misunderstood stats.
If you missed any of the previous articles, here is Understanding BABIP Part 1, Understanding BABIP Part 2, and Understanding BABIP Part 3.
