


I spent the months before the 2022 MLB season building a pitching projection system by hand. No coding experience. No perspective. No math-major backing. Just Google Sheets, the Dunning-Kruger curve, and a dream.
It was a colossal waste of time, despite its minor successes. Still, I’ve kept my eye on projections since, and as new ones pop up across the industry, I’m continually impressed by both their accuracy and innovation.
When it comes to predicting the future, Baseball Prospectus’s PECOTA is the standard. It’s the bar to clear, but it’s not unimpeachable, and when comparing PECOTA to Pitcher List’s in-house projections, the biggest discrepancies can help illustrate how these models operate. For transparency purposes, I’ll be using PECOTA’s March 13th update and PL Fantasy Baseball Projections v2.3.
International Free Agents
Tatsuya Imai
Pitcher List Projection: 4.21 ERA, 1. 34 WHIP, 23.1 K%, 10.3 BB%, 1.2 HR/9
PECOTA Projection: 3.17 ERA, 1.14 WHIP, 25.0 K%, 9.1 BB%, 0.87 HR/9
There is no greater disagreement between our projections and PECOTA’s than over Tatsuya Imai, the top-ranked pitcher from the 2026 class of international free agents. He landed with the Houston Astros, presumably as their second starter behind Hunter Brown.
Needless to say, these projections differ on whether Imai is likely to live up to those expectations. PECOTA isn’t privy to the changes in fastball quality waiting for him on American soil and subsequently expects Imai’s NPB-leading 27.8 K% to translate. That kind of potency helps explain a delta of more than one run in ERA. While more strikeouts mean fewer opportunities for walks and contact, PECOTA is also optimistic about his damage suppression, with a .265 BABIP on a 26.9 GB%.
Tatsuya Imai (HOU) threw three innings against Miami without allowing a single baserunner pic.twitter.com/LJN5dQO7IR
— Pitcher List Stats (@PitcherListPLV) March 11, 2026
Our projection is less bullish on Imai’s strikeout potential. The jump in level of competition pairs poorly with an arsenal that isn’t engineered for whiffs. His arm-side slider is interesting, but it puts him in a similar bucket to Jonah Tong and Trey Yesavage. Can he generate swings and misses without a traditional glove-side breaker? Kyle Bland’s Pitcher List model thinks he’ll end up on the wrong side of that walk/whiff spectrum, opening the door for some ugly numbers if his batted-ball luck isn’t favorable.
I’ll land somewhere in the middle. Being weird is often a path to being productive. If his fastball exceeds expectations, that funky slider could buy him enough breathing room, especially in his first trip around the majors. Fortunately for Imai, a strong rookie season could quickly turn into a second big-league contract. Given the uncertainty of international free agency, it’s no surprise the projections aren’t in lockstep on his game.
Small-Sample Breakouts
Sal Stewart
Pitcher List Projection: 512 PA, .271 AVG, .328 OBP, .496 SLG, 22.7 K%, 27 HR
PECOTA Projection: 583 PA, .243 AVG, .305 OBP, .399 SLG, 19.9 K%, 17 HR
Our projections can be aggressive on younger players who have flashed in limited MLB action. We’re highest on Sal Stewart, whose five homers in 18 games made good on his Top-100 prospect status during the Cincinnati Reds‘ playoff push.
It was a promising start, although I’m not totally sold on the underlying contact numbers supporting an OPS well over .800.
The model seems very high on Stewart’s contact and power, the latter of which graded out as an 80-grade trait (albeit in a tiny 215-pitch sample). His exit velocities support that notion. However, game power is often only as useful as the decisions and bat-to-ball skills behind it. Stewart had a 39th-percentile Z-contact rate with the Reds, and his chase issues (27th percentile) predictably jumped after his promotion. Players can survive with that profile, but we’ve seen far more prospects struggle to adjust than actualize elite raw power.
Subsequently, I’m rolling with PECOTA on this one. A double-digit gap in home runs is a lot to bridge. Running nearly 30 points higher on batting average (while only 16 points of BABIP) scares me, too.
I’m more confident in regression to the mean than the Reds’ offensive infrastructure.
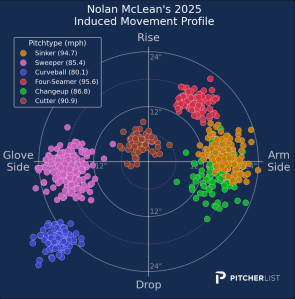
Nolan McLean
Pitcher List Projection: 3.56 ERA, 1.20 WHIP, 25.6 K%, 8.5 BB%, 0.9 HR/9
PECOTA Projection: 4.23 ERA, 1.33 WHIP, 23.3 K%, 9.3 BB%, 0.9 HR/9
Imai and Nolan McLean are on opposite sides of the same coin. The same strikeout potential that holds Imai back in the Pitcher List projections helps make the New York Mets‘ top prospect one of the best young pitchers in baseball. After striking out 29.9% of batters in his limited sample, he was always going to get regressed to the mean in your spreadsheet of choice. The difference here gives McLean an extra 0.65 Ks per nine, which reverberates throughout his projection.
Unlike Imai, McLean doesn’t see much variance in his damage projections. Most agree that he’ll run into issues against lefties as he balances throwing a suboptimal fastball against an uptick in walks, which played out in his two WBC starts. However, the PLV-powered projections have more strikeouts in the forecast, which we can attribute to his sweeper and, potentially, curveball.
PLV favored the former much more, largely due to its location. His sweeper was the best breaker in the minor leagues last season and quickly asserted itself as a plus pitch in the bigs, posting an 84th-percentile PLV (and 94th-percentile Quality Pitch rate). I expect the curve to take a step forward in 2026. It showed outlier horizontal movement and generated swings and misses, both in and out of the zone, at an elite rate last season. The pitch will likely find strikeouts at higher rates than its PLV would suggest. Our projections aren’t just higher than PECOTA on his K%. We’re also higher than the seven public projections on his FanGraphs player page.
That’s the power of pitch-level projections. I want to emphasize that this is not meant to disparage other projection systems. We could be wrong! But if the best way to use an assortment of projections is to marry them, it may be more worthwhile to pick and choose where to use each one. For guys with stupid stuff, I want to take advantage of PLV.
And, my friends, the stuff is stupid. McLean’s spring has showcased an uptick in both velocity and movement (perhaps a consequence of WBC adrenaline). As a former two-way player, his late embrace of pitching combines with elite athleticism to pave a longer runway for development. We’re quickly approaching a version of McLean that capitalizes on the upside of his electric stuff.
Drake Baldwin
Pitcher List Projection: 575 PA, .283 AVG, .349 OBP, .481 SLG, 16.8 K%, 22 HR
PECOTA Projection: 567 PA, .259 AVG, .329 OBP, .404 SLG, 17.6 K%, 16 HR
Drake Baldwin, the reigning National League Rookie of the Year, cannot break out in the typical sense. However, a leap to superstardom could be the only thing saving the Atlanta Braves‘ season. Our model thinks that’s more likely than a sophomore slump.
Baldwin is another example of PLV falling in love with a young player. Likewise, he checks the boxes necessary for the projection to be higher than just about anyone else’s. He had strong 2025 numbers, the backing of our pitch-level metrics, and age on his side. Each gives the model a reason to expect development, rather than regression to the mean.
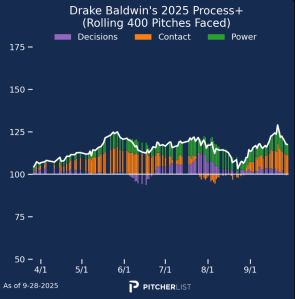
Baldwin isn’t a standout by any one tool. He blends good decisions with above-average contact and power to create a well-rounded offensive approach. His Contact+ (110), Decision Value+ (103), and Power+ (106) set a solid foundation for growth, and culminated in a 115 Process+. Thus, he doesn’t have to rely on batted ball luck or running hot on homers to produce.
Like McLean, I find myself in on Baldwin because of soft factors that aren’t going to show up in a projection. Nathaniel Thomas’s work on swing quantification helps explain Baldwin’s success. His bat-to-ball skills validate those fundamentals and help fill the projected gap in OPS that isn’t covered by those extra six home runs.
Contact% vs. swing-mechanics-based modeled xwOBACON (min. 300 PAs)
Do not be surprised if Drake Baldwin finishes top 5 in MVP voting this year. He is a superstar pic.twitter.com/KpLJIx4PX5
— Nathaniel Thomas (@xwOBA_enjoyer) March 12, 2026
PECOTA’s projected step back isn’t necessarily off-base. By virtue of being an everyday catcher, offensive skepticism is justified. Just ask Adley Rutschman how quickly being the next great catcher can go sideways. Between the six fewer projected home runs, 11 points of BABIP, and nearly identical walk rates, this pessimism is likely rooted in similar players seeing a decline in batted-ball quality.
Aging Veterans
Jameson Taillon
Pitcher List Projection: 4.59 ERA, 1.28 WHIP, 18.7 K%, 6.0 BB%, 1.4 HR/9
PECOTA Projection: 3.95 ERA, 1.19 WHIP, 18.2 K%, 5.7 BB%, 1.3 HR/9
Jameson Taillon is one of the few pitchers who isn’t saved by his impressive PLV metrics. Our models love his command, sporting elite plvLoc+ for his fastball, cutter, sweeper, and curve. And yet, we’re lower on his age-34 season than PECOTA and much of the public.
We can track this to Taillon benefiting from exceptional batted-ball luck in 2025. His .234 BABIP was a 95th-percentile mark for starters. It was 50 points better than his career and the league average. Taillon found that without striking out the world (29th-percentile K%), forcing us to ask why that fortune should be replicable.
PECOTA is a bit friendlier in this regression, predicting a .272 BABIP, nearly identical to his 2024 season, which culminated in a 3.27 ERA and 3.92 FIP. We can assume the Pitcher List model will regress him even further, and it explains the discrepancy. With nearly identical strikeout and walk rates and a limited difference in damage potential, the disagreement is largely tied to H/9. PECOTA’s 8.6 H/9 is a significant difference from our 9.23 mark and explains the gap in both WHIP and ERA.
Taillon will likely need another right-tailed luck outcome to be productive in 2026. Our model is essentially asking why, with strong command but mediocre stuff, should that be expected?
His spring training hasn’t made me any more optimistic. After a 10-run start and a 17.55 spring ERA, there’s a real chance that we no longer live in a world in which Taillon is an average MLB starter.
Age plays a big role here, too. Our model is more aggressive (in both directions) based on age. The mean and median ERA and WHIP were friendlier than PECOTA on pitchers in their age-24 season or younger. The opposite was true for pitchers 34 and older. PECOTA was slightly nicer to pitchers between those two thresholds. I think that’s an attempt to be aggressive in forecasting development and regression, operating under the same principles that fueled McLean’s optimistic outlook.
Seth Lugo
Pitcher List Projection: 4.80 ERA, 1.40 WHIP, 18.9 K%, 7.9 BB%, 1.3 HR/9
PECOTA Projection: 4.21 ERA, 1.28 WHIP, 20.1 K%, 7.7 BB%, 1.1 HR/9
Seth Lugo’s 2024 and 2025 campaigns couldn’t have been more different. And in descending from a consistent mid-rotation arm to a liability on the back end, he’s given little for either projection system to fall in love with.
Still, the degrees to which these models expect him to regress vary. This likely comes down to his stuff, which is in stark decline. Thus, it makes sense that the models weighing stuff more heavily (admittedly a guess on my part) like Lugo the least. Pitcher List, OOPSY, and THE BAT X are lowest on the veteran. That isn’t to say PECOTA doesn’t incorporate stuff into its projection stew. StuffPro is included, and as described ahead of the 2025 season, can help explain why PECOTA isn’t always as bearish on guys with otherwise scary statistics.
“In fact, some of the largest improvements we see are from somebody who otherwise would have been written off as terrible (say, a 6.50 ERA) who now gets projected for something closer to average, say 4.30,” Jonathan Judge wrote. “That may not seem like a sexy upgrade, but if you end up needing 100 innings from somebody, and correctly choose the supposedly replacement-level pitcher who hits that better projection.”
Lugo was the fifth-worst (qualified) pitcher by StuffPro last year, but his projection remains pedestrian, not putrid. That leads me to believe that PECOTA, for better or worse, doesn’t weight stuff as much as other outlets.
Perhaps relying on past production is fitting for Lugo, whose expansive arsenal gives him extra off-ramps. There’s some Chris Bassitt in here, and Lugo’s craftiness could serve as staying power. To his credit, Lugo has outperformed his FIP in each of the last four years. That’s another nod in PECOTA’s direction, although I remain wary of the flooring falling out from under him in Kansas City.
Photo by Scott Winters/Icon Sportswire | Featured Image by Justin Redler (@reldernitsuj on Bsky/Twitter)
