


Announcer:
Faster than a speeding bullet! More powerful than a locomotive! Able to leap tall buildings in a single bound!Voices:
Look, up in the sky! It’s a bird! It’s a plane! It’s Superman!
Or maybe it’s Joey Gallo, who is, in many ways, Major League Baseball’s version of Superman. He’s tall and strong. He runs well (especially for someone of his stature) and he has good instincts that combine to let him cover a lot of ground in the outfield. He can unleash rockets with his right arm. And he hits majestic, towering home runs that sometimes break Statcast and almost always leave mouths agape.
He also swings and misses a lot, and strikes out a ton – the 2nd-highest rate (38.1%) of any player to take at least 1,000 plate appearances in the Statcast era (since 2015).
All of that is to say, to watch Joey Gallo is to watch baseball at the extremes, which the scatterplot of average exit velocities and strikeout rates below makes plain.

Data from Baseball Savant
Earlier this week, when Kyle Bland started sharing the new Pitch Level Value (PLV) heat maps on Twitter, Gallo’s was one of the first ones I wanted to see. Take a look for yourself at this work of art:
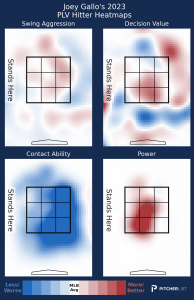
We see the things we expect — top-of-the-scale power middle-middle to down-and-in, and bottom-of-the-scale contact ability pretty much… everywhere. I don’t know what I expected, but I was still taken aback at just how widespread Gallo’s contact issues have been, especially inside the strike zone. I know he punched out 42.8% of the time last season, but… wow.
According to Statcast, Gallo had an in-zone contact rate of 68.9% last season, the lowest in the majors by 1.3 points. Despite that, Gallo was still an above-average offensive contributor by his 104 wRC+ — not by much, but 104 is still greater than 100 — thanks to his power (.440 slugging percentage) and 14.5% walk rate.
That got me wondering about how common it is for a player to make that little contact in the zone and still manage to be an above-average contributor. Could Joey Gallo’s combination of power, patience, and lack of contact be instructive about the outlook for other players?
The Data
Since the start of the Statcast era, there have been 3,412 player seasons of at least 150 plate appearances. Of those, 143 (about 4.2%) have had Zone Contact rates of less than 76%. Gallo produced seven of them by himself. Twenty-eight of them came from catchers, including five by Alex Avila and three by Mike Zunino.
Sixty-five of the seasons (about 45.4% of the 143, and 1.9% of the 3,412) produced wRC+ marks better than 100. You can check out the full list here. That data suggests to me that it’s possible to produce at above-average rates while making low rates of contact, but it’s not likely that a player will do so.
What also stood out to me from that subset is that there are 48 unique names. There are few players who have been able to make a year-over-year habit of producing with such low in-zone contact rates. Gallo (5) and Zunino (3) have, but no one else has pulled off that combination more than twice.
It’s a fine line to walk because it requires them to absolutely mash on the contact they do make, and/or supplement their power with elite walk-drawing discipline. Sixty-three of the 65 had ISO marks that were above league average. The two that didn’t, Avila in 2016 and J.D. Davis in 2021, offset their power deficits with on-base percentages that were more than 10% above league average. The 65 seasons meeting the criteria averaged a .480 slugging percentage and a .238 isolated power. As a reference, Marcus Semien slugged .478 and Freddie Freeman had a .235 ISO last season. That’s what’s required to make this work.
Using this as a Risk Indicator
Scanning through all the names on the list, several stand out for having a strong season or two early in their careers, and then quickly finding themselves in waiver claim purgatory or heading overseas, like Luke Voit, Keston Hiura, Kyle Lewis, Aristides Aquino, and Franmil Reyes. In each case, their inclusion on my arbitrarily contrived list signaled doom for their future outlook.
Voit’s 2021 and 2022 got him here after his 9th-place AL MVP finish in 2020. Lewis, continuing on the ‘2020 was weird’ theme, won the AL Rookie of the Year with this combination that season. Hiura’s 2022 was a bit of a bounce back after he cratered in 2021, but wouldn’t continue. In 2019, Aquino captured everyone’s attention by setting the MLB record for most home runs (13) in a player’s first 100 plate appearances, and then never repeated that kind of production afterward. Franmil Reyes (included for 2020) had another strong season in 2021 before it caught up to him.
For each of these players, their lack of contact in the strike zone, while maybe not the only factor, contributed mightily to their downfalls.
On the other hand, some young players on this list seemingly developed their way off. George Springer in 2015. Brandon Lowe in 2019 and 2020. Ian Happ in 2017 and 2018. Teoscar Hernández in 2018. In each case, they subsequently improved their zone contact rates by several points in future seasons, which helped fuel and sustain significantly higher levels of performance.
The point is, it’s rare to survive like this (as Gallo has). Generally speaking, players either develop their way up and out of this combination, or they end up back in the minors or playing overseas. They don’t tend to repeat.
Looking at 2024
That brings me, finally, to applying this for next season. There were nine of these occurrences in the 2023 season — Gallo (of course), Chris Taylor, Jose Siri, Ryan Noda, Christopher Morel, Jazz Chisholm Jr., Matt Wallner, Zack Gelof, and Nolan Jones.
Gallo is well-known at this point. A lot of Taylor and Siri’s value is tied to their positional flexibility and they will likely most often be deployed as streamers. Noda was not been included in Scott Chu’s top 200 hitters for 2024 ranking. I want to focus on the other five names.
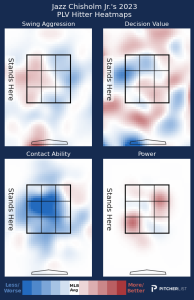
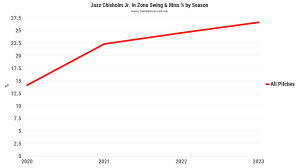
Injuries are obviously the big factor with Jazz, but he’s also got a concerning multi-year trend of making less and less contact. You can see the big hole in his swing up around his hands. Both his zone contact and chase contact rates have now declined year over year, four years in a row.
If healthy, his speed helps set his floor, but with a .206 career ISO and a .304 career OBP, he’s quite a bit below the benchmarks required to make this profile work. He’s going to need to make a lot more contact or much louder contact to deliver on his #37 pre-season ranking.
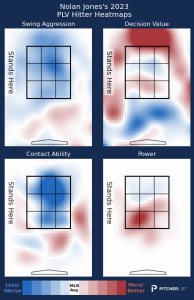
Jones is willing to be patient, but those heatmaps are a bit of a Gallo starter kit, with the power coming from down and in, and everything else up and out over the plate being whiff-worthy.
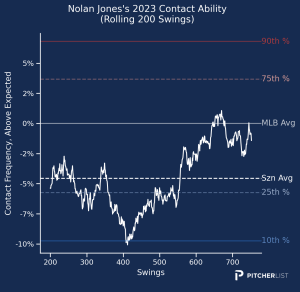
Jones slugged .542 last year, well clear of the .480 average benchmark required above, but his expected slugging was a less impressive .499. That suggests his margin for error is smaller than we might like because of this contact profile. On the positive side, as last season went on he made gains in his ability to make contact, and was closer to league average late in the season.
Playing half his games in Colorado gives him a boost (although the lineup around him cuts into that some) and the on-base skills and stolen bases help solidify Jones’ floor, but the weakness of the outfield crop is already pushing his draft position up higher than it probably should, given his contact risk.
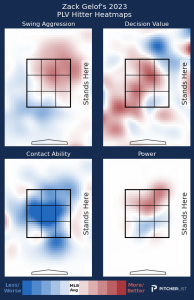
Gelof showed good discipline and decision-making, and his swing aggression and power overlap well on the maps above. He swings where he can do damage, but there is also a lot of swing-and-miss in those same areas. Because he’s aggressive up, and his power is up, he struggles with chasing up above the strike zone.
His xSLG last season was .443, well below the needed benchmark, and his exit velocities were more middle of the bell curve than standout, continuing a trend from his minor league time. His power is likely confined to the upper parts of the zone because of the mechanics and shape of his swing, something that Tess Taruskin covered in depth for FanGraphs back in August.
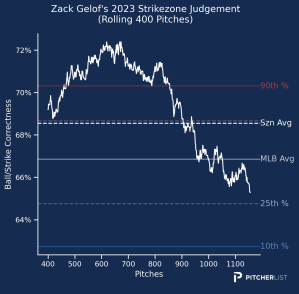
His 8.7% walk rate is also lower than I would want to see with this profile, too, and his rolling strike zone judgment as last season progressed is not encouraging of that improving next season. On the other hand, he ran walk rates between 11 and 13% in the high minors, so that may indicate that he’ll learn from his rookie second half.
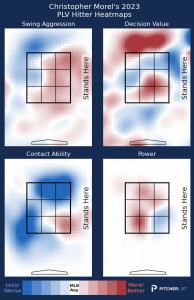
Morel’s contact heatmap looks like a textbook definition of a “book” scouting report — hard stuff up and in, breaking stuff low and away. He’s aggressive at swinging inside and makes the most contact down and in, but that’s also where his power is weakest. That’s a tough combination.
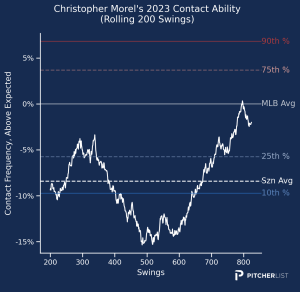
If he can tighten that up some, and get more selective to avoid swinging at pitches that are too far down and in, he might be able to repeat last season, or even find another gear. His expected slugging was .489, just clearing our bar, but his walk rate was in the 8s. That makes it seem like Morel’s path to more is most likely going to be through making more or better contact (or both!). He may have already started that if his second half last season is an indication.
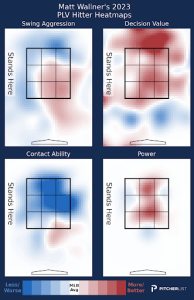
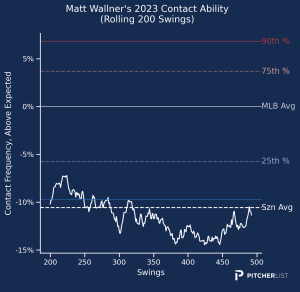
Where the other hitters I’ve highlighted here bring value on the bases or defensive flexibility, Wallner is a one-dimensional slugger who might end up a DH-only kind of player. The power (.517 xSLG) and walks (11%, but even higher in the high minors) are very strong but Wallner also made the least in-zone contact (73.1%) of this group, and the 3rd-least in the majors last season. He was very steady in this category throughout the season. If anything, he trended toward making less contact as the season progressed.
He’s very vulnerable to whiffing up in the zone, but he mitigates that in part by doing a pretty decent job staying off those pitches. He likes to dive out over the plate and scoop low stuff. Altogether, it can work if he keeps mashing, or adds another few points of on-base, but there’s not much floor if the contact rate or plate discipline erodes.
Photo by Randy Litzinger | Icon Sportswire
Adapted by Kurt Wasemiller (@KUWasemiller on Twitter / @kurt_player02 on Instagram
