


This is a clickbait-y headline, I know. Shame on me. It’s not easy to pitch to Juan Soto, at all. Yet here you are, reading the words I typed, so stick with me for a bit.
If you were to take every player’s zone swing rate and subtract their chase rate from it (coined as Z-O swing%), you could get a pretty solid measure of which players best control the zone. This season’s leaders include noted “professional” hitters, such as Corey Seager, Marcus Semien, and Kyle Tucker.
By this measure, however, Juan Soto, widely regarded as having the best eye in baseball, ranks in the 63rd percentile, behind Ozzie Albies and Rafael Devers. Nobody clamors over the plate discipline of those two players, yet by this very solid metric, they come out ahead of Soto. With one of the lowest zone swing rates in the league, Soto’s Z-O swing% is fairly pedestrian.
Soto, subconsciously or not, recognizes the value of a take in the zone versus a swing outside of it. Pitcher List’s PLV hitter application is awesome, and everyone should check it out.
One of the metrics it houses is known as Decision Value, which is a “modeled value (runs per 100 pitches) of a hitter’s decision to swing or take, minus the modeled value of the alternative.” I’m simplifying things here, but it essentially looks at a bunch of different pitch elements, including count, pitcher handedness, velocity, location, etc., and asks whether that pitch should be swung at or not. It’s a much better plate discipline metric than something like Z-O swing% for many nerdy advanced modeling reasons.
Many people have written about this concept, but swinging at a pitch out of the zone has a much greater value to the pitcher than not swinging at a pitch in the zone. Soto ranks in the 100th percentile in this metric. That’s number 1, if you were wondering. Soto’s all-world swing decisions and top-end exit velocities are what make him so special. Let me make that last part clear: Juan Soto is a capital S Special hitter. With that said, nobody’s perfect. Every hitter has some hole in their game, and although I wouldn’t describe Soto’s hole as big, there seems to be an obvious way to attack him.
Hitting It Where It’s Thrown
I was playing around with some launch angle data, hoping to find something interesting. My premise was simple: Pitches hit higher in the strike zone go for higher launch angles than those hit lower in the strike zone. This makes intuitive sense, but in case you need the numbers to back it up: When you split the zone in half, pitches hit in that upper half have an average launch angle of 18.6 degrees. The lower half? 8.7 degrees.
I was curious to see if any players hit pitches up in the zone for a lower launch angle than pitches low in the zone (or the opposite). Using median launch angle as my proxy, three players fit that bill: Riley Greene, Isiah Kiner-Falefa, and Brent Rooker. I can’t tell if there is much to glean from those names – and I could have done a bit more digging there – but I felt it much more prevalent to discuss Soto. I plotted the players who ranked in the top or bottom 5% of median launch angle on high or low pitches. The red and green lines indicate the average median (to my AP stats professor, forgive me) launch angle on low and high pitches, respectively.
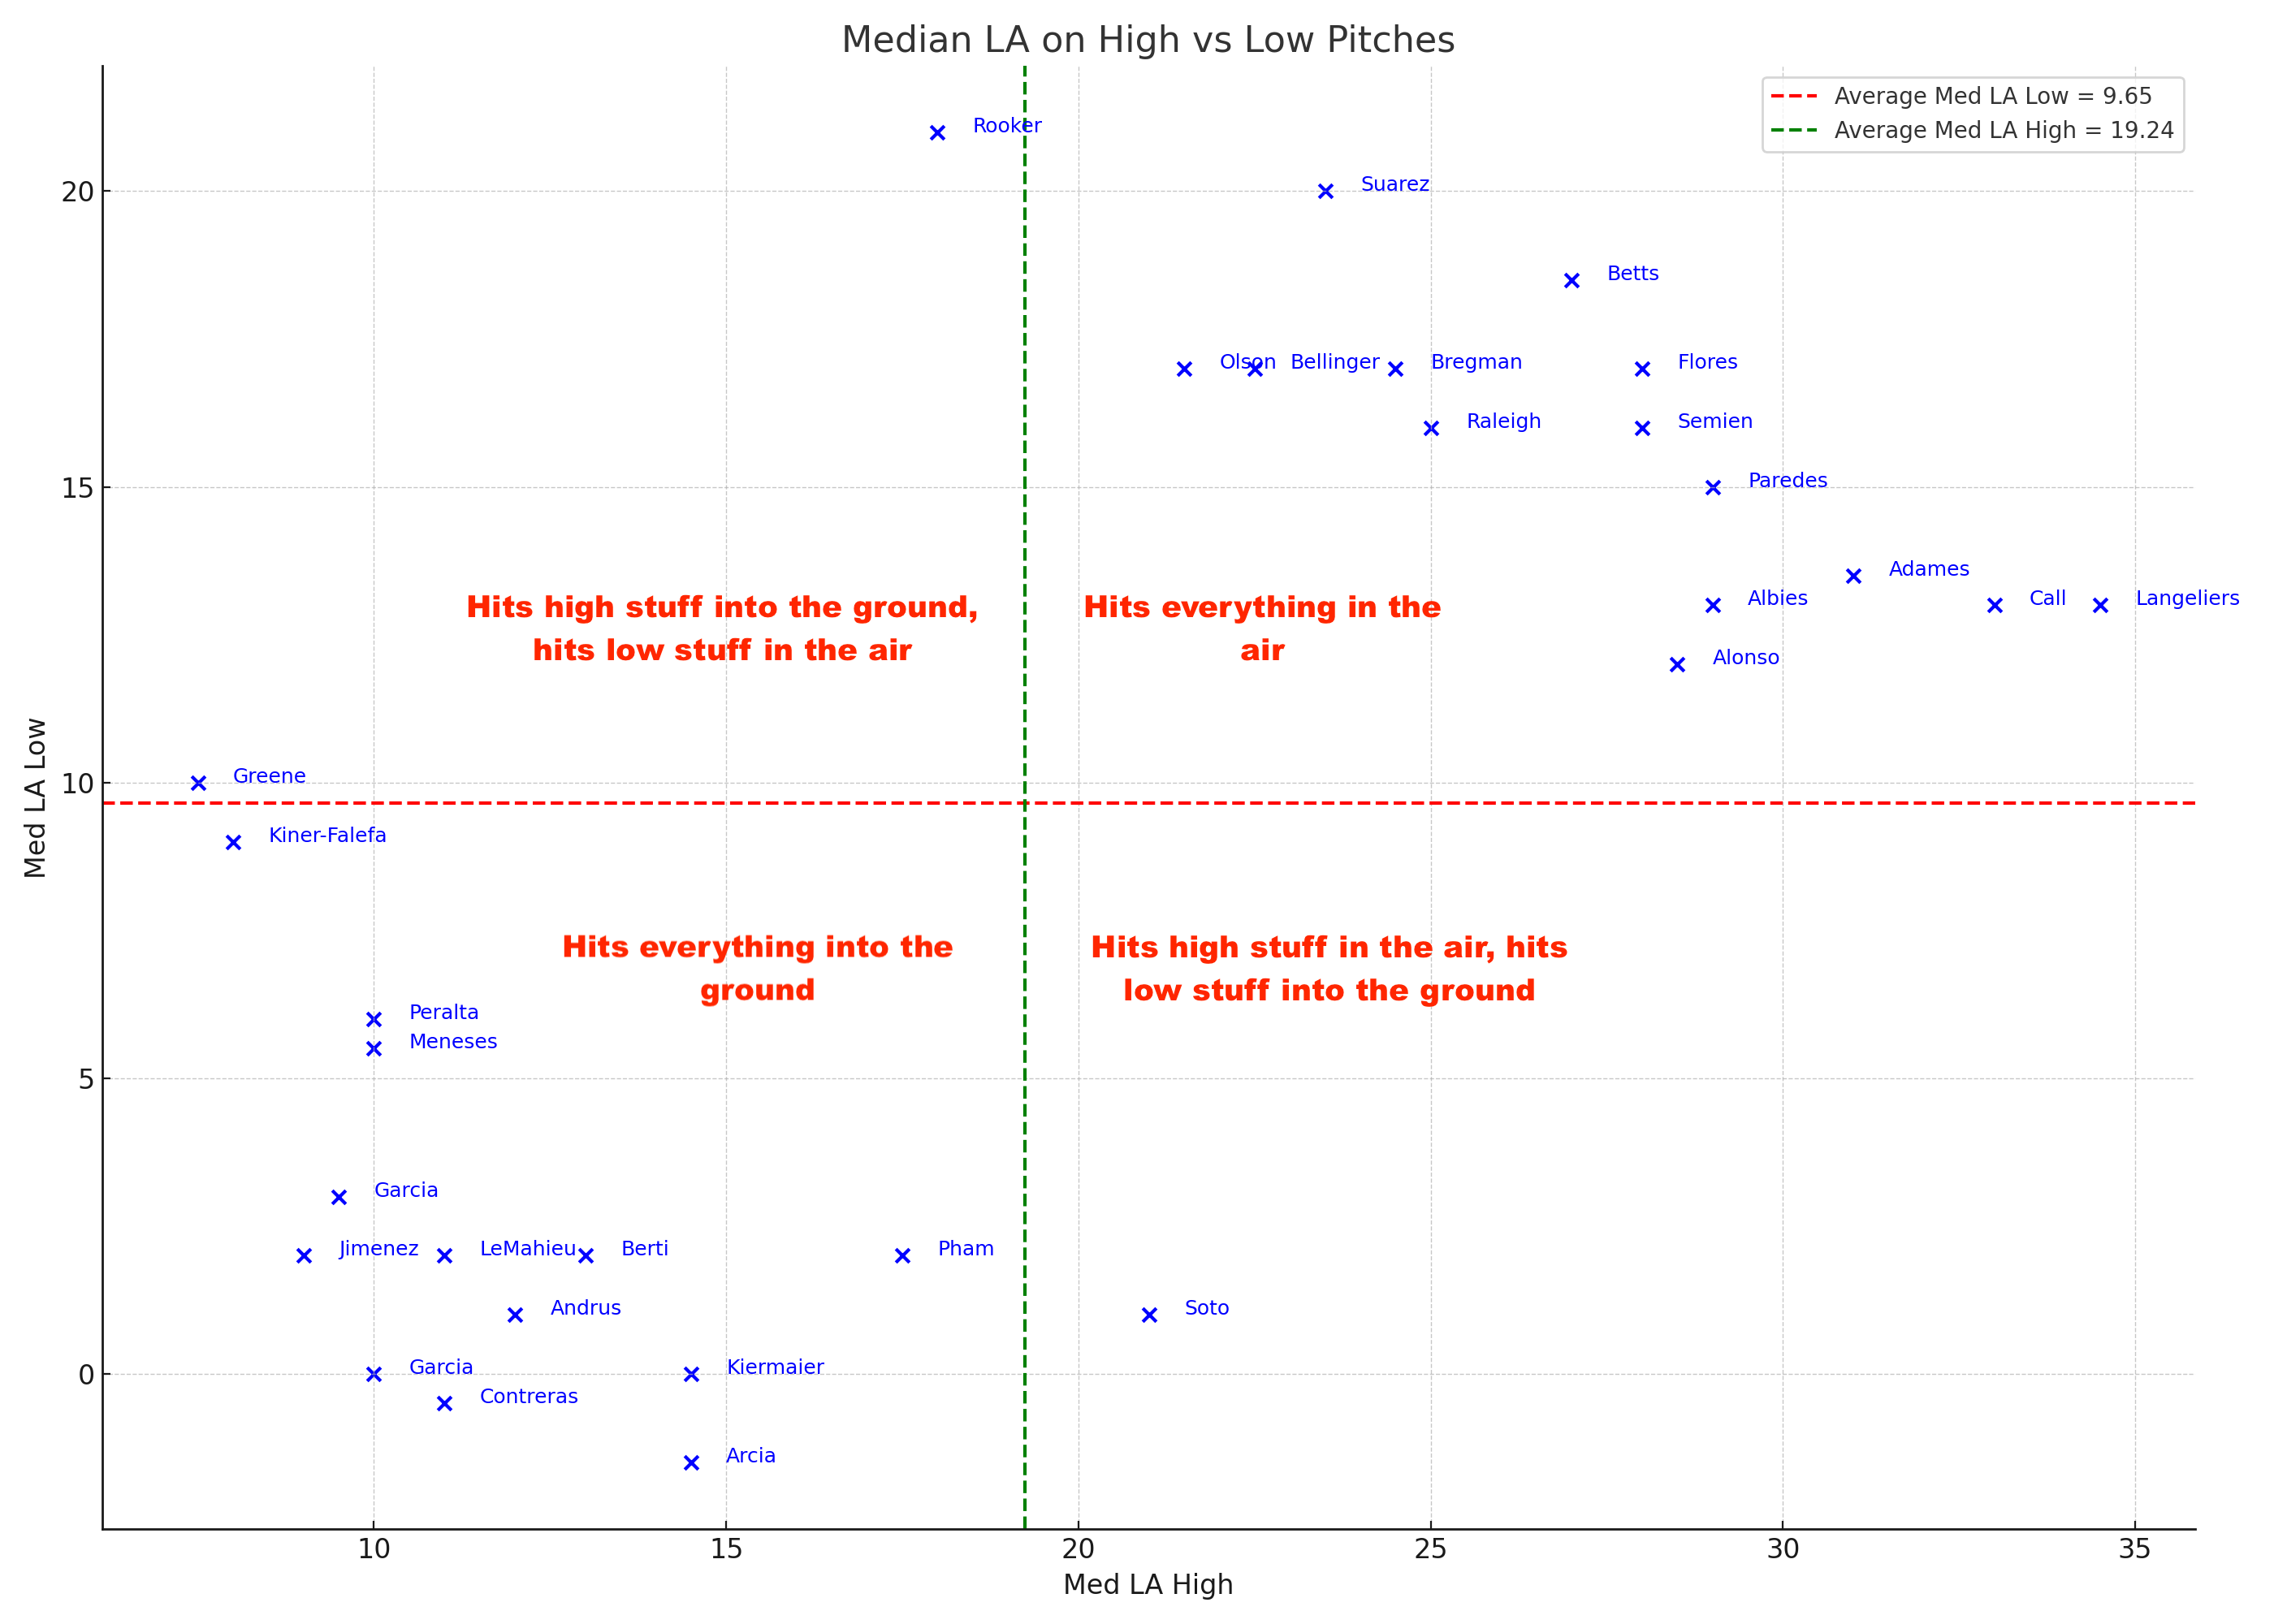
(PSA: When I say “upper” or “lower” half of the zone, I am including pitches out of the zone. Simply imagine a horizontal line going into and through the zone.)
Matt Olson always elevates the baseball, no matter where it’s pitched. Conversely, Eloy Jiménez perpetually kills ants. Juan Soto is the only player in that bottom right quadrant who ranks in that 5% threshold. I see this quadrant as the “hit it where it’s pitched” quadrant. Soto will hit an elevated pitch in the air more often than the average hitter but will also hit anything down in the zone on the ground more often than the average hitter.
Does that make it easy to pitch to him?
A Clear Plan of Attack
Soto’s ground ball tendencies have been well-documented. His propensity to roll over on pitches in the lower half has capped the power we know he possesses. Soto’s best season by xwOBACON (2019) coincided with the lowest ground ball rate of his career (42.8%). This season, his ground ball rate is the eighth-highest among qualified hitters. Hitting ground balls has always been his main bugaboo, so the real finding here is that there’s an obvious way to pitch one of the best hitters in baseball.
Now, would I rather face Masataka Yoshida, another big ground ball hitter, or Juan Soto? The answer is Yoshida, obviously, but the decision of how to pitch to Yoshida is (I think) more complicated. Consider both of their ground ball heatmaps.
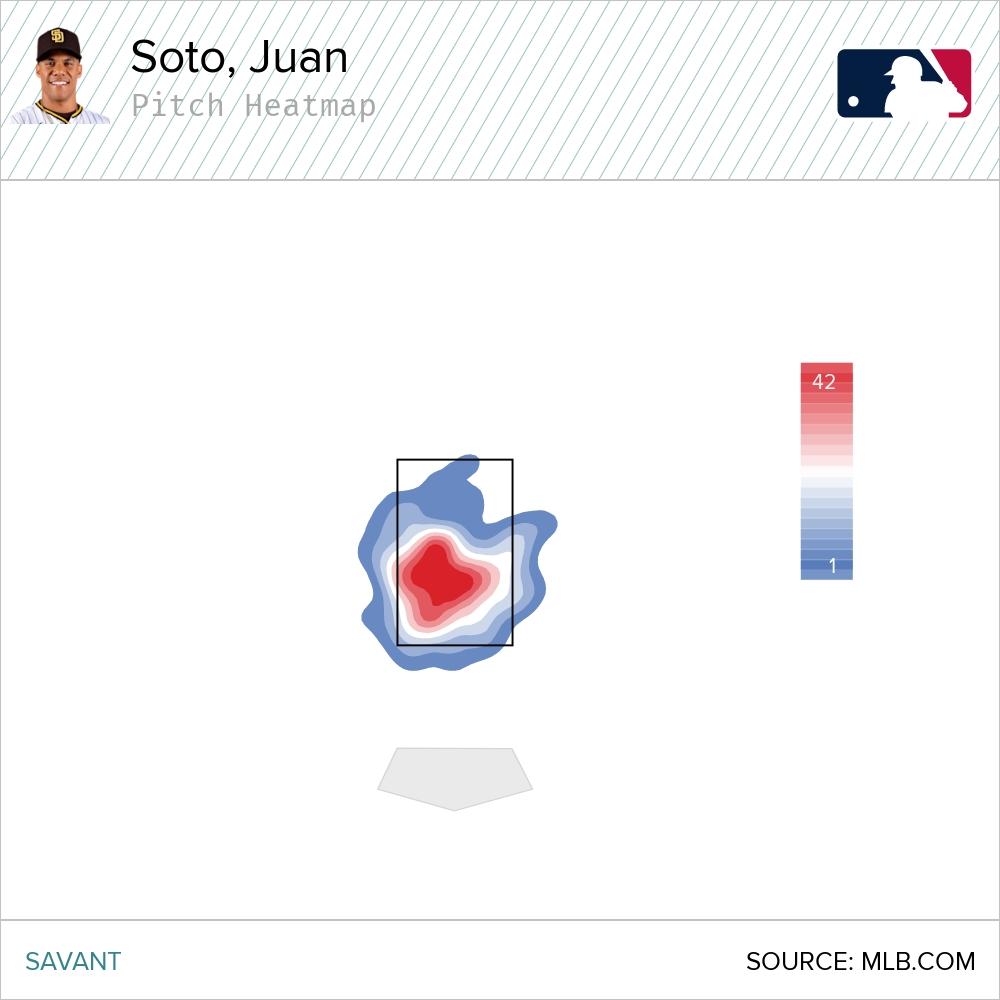
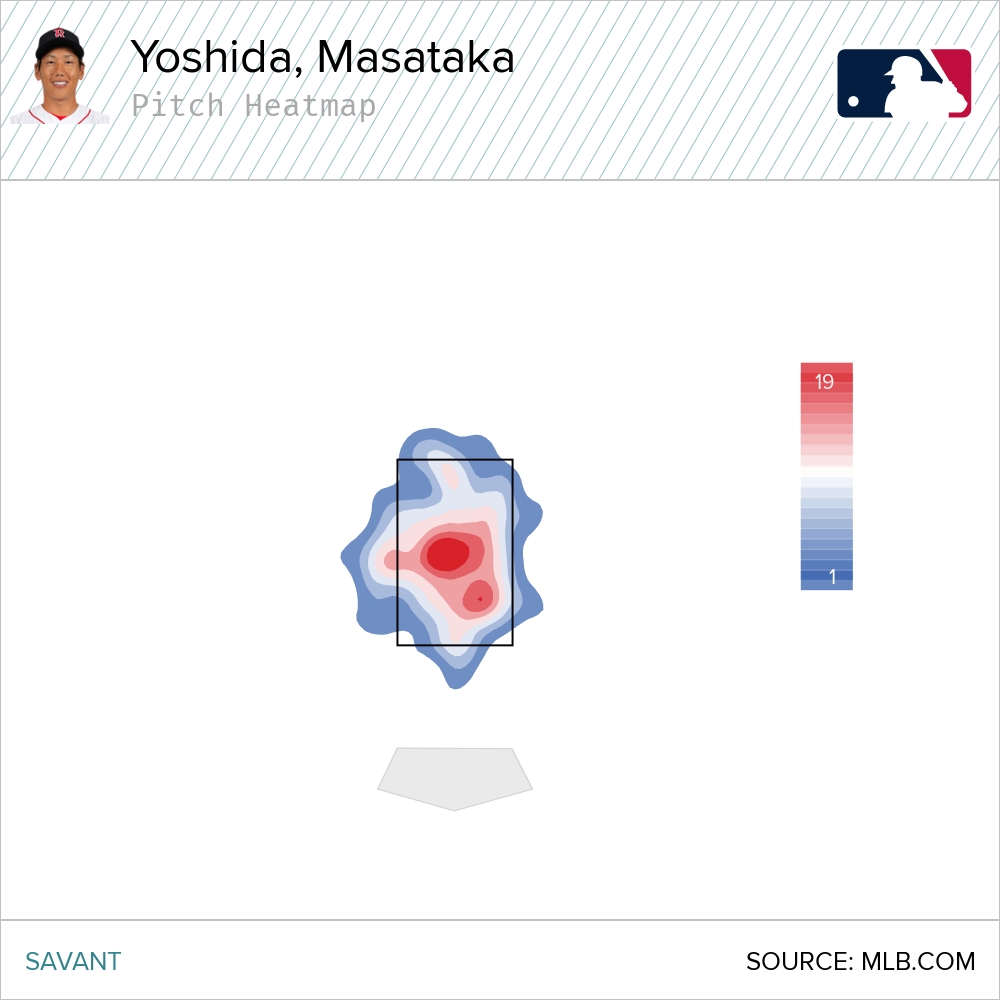
There’s comfort when pitching to Yoshida because it doesn’t really matter where the pitch is thrown. Chances are that Yoshida will hit a ground ball, irrespective of pitch location. With Soto, you really have to locate the pitch down to induce a grounder. It’s a lot more difficult to execute against Soto, yes, but the decision on how to pitch to him is far easier than it is for Yoshida.
Soto has two big spots: A “you messed up to the 95th percentile” spot and a “you did all you could and got to the 55th percentile” spot. Most great hitters don’t have a gap that big between the two halves of the zone. Moreover, the value between the 95 and 55 percentile is not the same as that between the 55th and 15th percentile. Turning Freddie Freeman into Alex Verdugo is a far greater victory for the pitcher than turning Verdugo into Andrew Benintendi.
The difference in expected outcomes between an elevated and non-elevated pitch to Soto is huge. The .082 gap between Soto’s upper and lower half xwOBACON is the 14th largest in baseball. Here’s a graphical representation of the players whose median launch angle differs most (and least) on pitches up versus down.

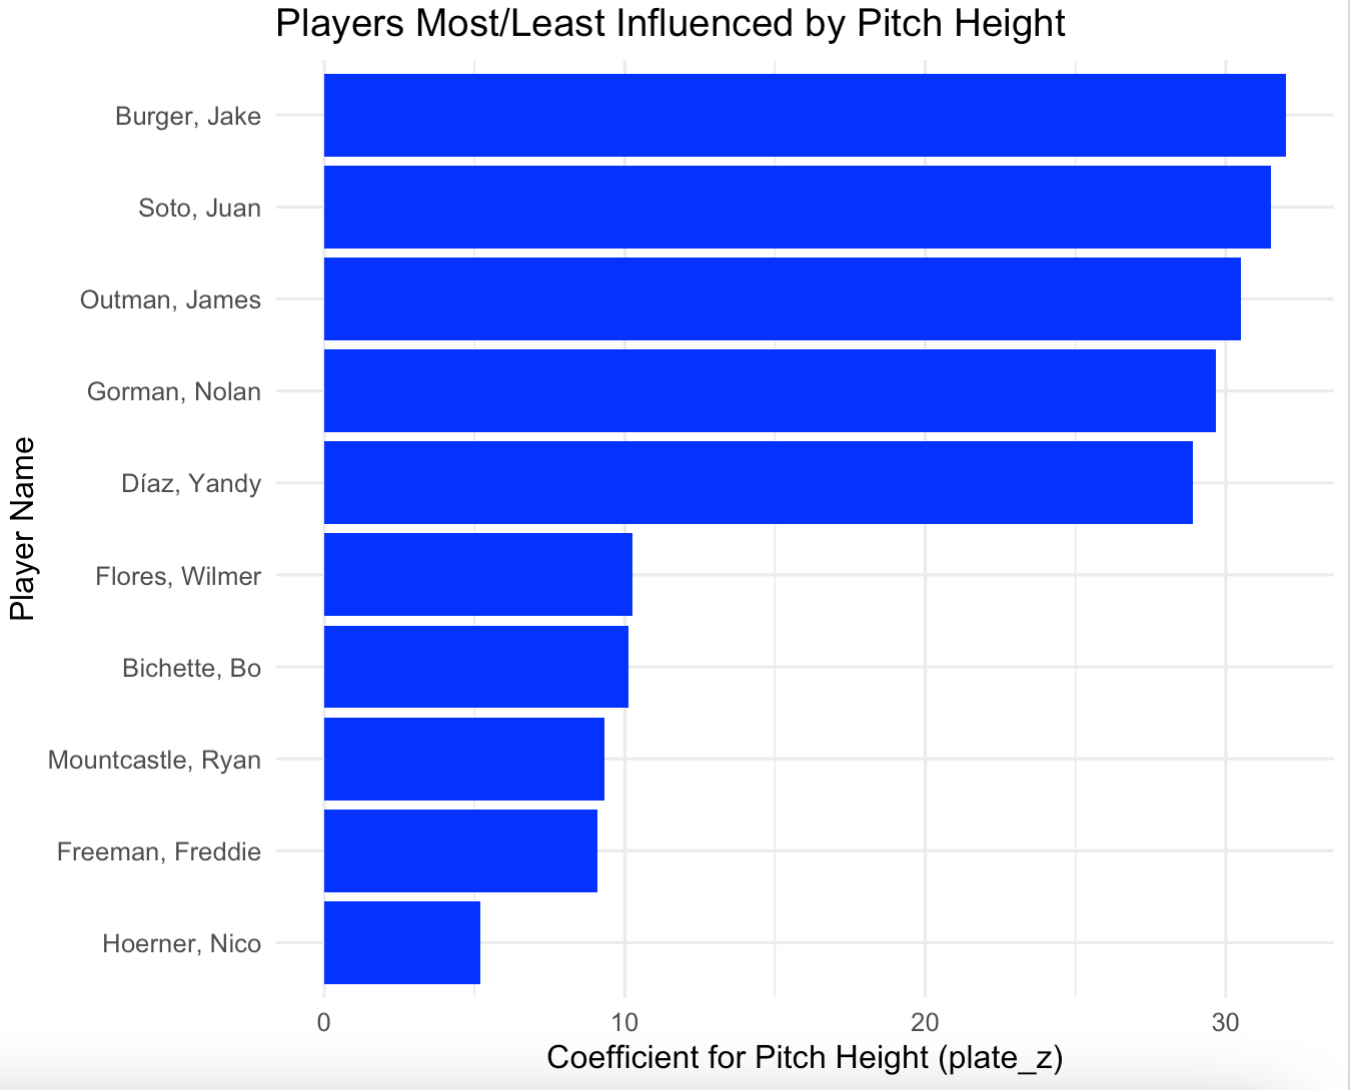
This is an extremely elementary way to quantify which players are most impacted by pitch height, yet Soto ranks third by this measure. A slightly more advanced test would be a linear regression, which can help quantify the relationship between pitch height and launch angle.
I modeled each player’s data individually to derive a coefficient for pitch height. The coefficient indicates how much of a player’s launch angle changes for a one-unit (one foot) increase in pitch height. It’s a rudimentary measure of how sensitive players are to pitch height.
Soto doesn’t make weak contact in the lower half by any means. He offsets the launch angle problem by hitting the ball hard. Still, compared to his 93rd percentile xwOBACON in the upper half, he’s significantly worse.
Here are some quality of contact numbers in the lower half. Note the ground ball rate:
Keen readers may be asking the chicken and the egg question, in that fastballs are usually elevated, and non-fastballs are usually down. Is it actually breaking balls/offspeed pitches that Soto struggles with, more so than low pitches in general? As evidenced by Soto’s 68% sinker ground-ball rate, compared to the 41% on four-seam fastballs (which have been 0.5 feet higher than the sinkers on average), it’s clearly a location thing for Soto.
Another thing to note: Soto has (probably) benefitted from the shift ban. This season, he has his highest BABIP on pulled and straightaway ground balls of his career, as well as the smallest xBA-BA discrepancy since 2019. That checks out, given that he was shifted only 16% of the time in ’19 compared to 47% and 56% in ’21 and ’22, respectively. To be clear, I still think ground balls are generally detrimental to hitter production; they’re just not as detrimental as they used to be.
There are caveats, of course. The most prevalent is that Soto chases more fastballs than breaking balls. He is one of the few qualified hitters with a higher fastball chase rate than that of breaking balls. Since fastballs live up in the zone, and breaking balls live below it, there’s a pretty good chance Soto works a walk if you adopt my suggested strategy and fail to throw it in the zone.
Then again, everyone already walks Juan Soto anyway!
So, what is it about Soto’s swing that allows the pitch height to determine the launch angle more so than any other player?
I have no idea. Swing path information could likely help with an explanation. Regardless, a variable as simple as pitch height having such a profound impact on Juan Freakin’ Soto is a worthwhile discussion.
This graphic was created by Aaron Polcare (@bearydoesgfx)
